. 2022 Jul 6;42(27):5438-5450.
doi: 10.1523/JNEUROSCI.2324-21.2022. Epub 2022 May 31.

A Spatiotemporal Map of Reading Aloud

Affiliations

A Spatiotemporal Map of Reading Aloud

Oscar Woolnough et al. J Neurosci. .

Abstract

Reading words aloud is a fundamental aspect of literacy. The rapid rate at which multiple distributed neural substrates are engaged in this process can only be probed via techniques with high spatiotemporal resolution. We probed this with direct intracranial recordings covering most of the left hemisphere in 46 humans (26 male, 20 female) as they read aloud regular, exception and pseudo-words. We used this to create a spatiotemporal map of word processing and to derive how broadband γ activity varies with multiple word attributes critical to reading speed: lexicality, word frequency, and orthographic neighborhood. We found that lexicality is encoded earliest in mid-fusiform (mFus) cortex, and precentral sulcus, and is represented reliably enough to allow single-trial lexicality decoding. Word frequency is first represented in mFus and later in the inferior frontal gyrus (IFG) and inferior parietal sulcus (IPS), while orthographic neighborhood sensitivity resides solely in IPS. We thus isolate the neural correlates of the distributed reading network involving mFus, IFG, IPS, precentral sulcus, and motor cortex and provide direct evidence for parallel processes via the lexical route from mFus to IFG, and the sublexical route from IPS and precentral sulcus to anterior IFG.SIGNIFICANCE STATEMENT Reading aloud depends on multiple complex cerebral computations: mapping from a written letter string on a page to a sequence of spoken sound representations. Here, we used direct intracranial recordings in a large cohort while they read aloud known and novel words, to track, across space and time, the progression of neural representations of behaviorally relevant factors that govern reading speed. We find, concordant with cognitive models of reading, that known and novel words are differentially processed through a lexical route, sensitive to frequency of occurrence of known words in natural language, and a sublexical route, performing letter-by-letter construction of novel words.

Keywords: dyslexia; human; intracranial recording; language; reading; speech.


Figures

Figure 1.
Figure 1.
Experimental design and electrode coverage. A, Schematic representation of the reading task. B, Representative coverage map (46 patients) and (C) individual electrode locations (3846 electrodes) for the left hemisphere, highlighting responsive electrodes (1248 electrodes; >20% activation above baseline).
Figure 2.
Figure 2.
Population word RTs. A, RT distribution for each of the three word classes, averaged within participant. B, Sorted mean (±SE) RTs for each item within the three word classes, averaged across participants, highlighting some exemplar words.
Figure 3.
Figure 3.
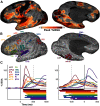
Spatiotemporal profile of cortical activations. A, Collapsed articulation-locked activation movie (Movie 2) highlighting the amplitude of peak BGA. B, Representative ROIs in 12 anatomically and functionally distinct regions, showing all responsive electrodes. C, Mean activation during word reading of each ROI, averaged within patient, time-locked to stimulus onset (left) and articulation onset (right). SEs omitted for visual clarity. Colored bars represent regions of activation greater than baseline (Wilcoxon signed-rank, q < 0.05).
Figure 4.
Figure 4.
Conjunction map of word class activations. MEMA conjunction maps showing overlap of binarized activation maps of each of the three word classes tested (%BGA > 5%, t > 2.58, patients ≥ 3), over three time windows locked to stimulus onset. Across all time windows, all three word classes demonstrate a gross overlap of activation (white). In the later time window, areas associated with postarticulatory processes (e.g., auditory cortex) show selective activation for known words, reflecting differences in RT between known words and novel pseudowords. Regions in black did not have consistent coverage for reliable MEMA results.
Figure 5.
Figure 5.
Contrasting word classes. A, B, MEMA contrasts of (A) exception versus pseudoword, and (B) exception versus regular, revealing regions of significantly different mean BGA between conditions (p < 0.01 corrected) within each time window. Regions in black did not have consistent coverage for reliable MEMA results. C, Decoding accuracies of the logistic regression decoders trained to distinguish exception word versus pseudoword trials (left) and exception word versus regular word trials (right). Gray lines indicate individual patient decoding accuracies. Colored line indicates median accuracy. Colored bars represent time periods significantly greater than chance (Wilcoxon signed-rank, q < 0.05). D, Cortical surface representation of population average electrode weightings of the exception versus pseudoword decoder between 300 and 500 ms.
Figure 6.
Figure 6.
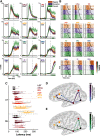
Spatiotemporal activation profiles of known and novel words. A, Mean activation (±SE) for each word class, within each ROI, during word reading, averaged within patient, time-locked to stimulus onset. Number of electrodes and patients, per ROI, is indicated. Colored bars represent regions of significant difference from exception words (Wilcoxon signed-rank, p < 0.05 for >100 ms). B, Mean activation per unique word, within each ROI. Trials separated by word class and sorted by the word's mean RT for the patients included within the given ROI. Mean RT for each word is highlighted. C, Latency of first onset of activation (first derivative of BGA >3.5 SD above baseline) for each electrode within each ROI. D, E, Network representations demonstrating maximum likelihood latency differences between ROIs, within patients with simultaneous coverage, for (D) initial activation latency and (E) initial lexicality distinction latency (first derivative of pseudowords, known words >3.5 SD above baseline). Lines excluded for ROI pairs where there was no simultaneous coverage of significant electrodes. Arrowheads not shown for differences <10 ms.
Figure 7.
Figure 7.
Anterior-to-posterior spread of lexicality in ventral temporal cortex. A, Ventral temporal ROI electrodes on an N27 pial surface. B, Mean activation (±SE) for known words (regular and exception) and pseudowords, within each ROI, during word reading, averaged within patient, time-locked to stimulus onset. Number of electrodes and patients, per ROI, is indicated. Colored bars represent regions of a significant effect of lexicality (LME, q < 0.05, effects of word length regressed out). EVC, Early visual cortex (Talairach center of mass −17, −81, −15).
Figure 8.
Figure 8.
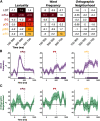
Regression of lexical factors. A, BF analysis of lexicality, word frequency, and orthographic neighborhood effects in the six prearticulatory ROIs, for three time windows. BF analysis was used here because of the variability in coverage between ROIs. Frequentist methods can lack statistical significance either because of a lack of effect or lack of power. BF analysis allowed us to disambiguate and show the strength of evidence for or against the presence of an effect. Lexicality tested all known words against pseudowords. Word frequency was regressed across all known words. Orthographic neighborhood was regressed across all pseudowords. ln(BF10) shown for each contrast, and values >2.3 are highlighted. B, C, LME model regression of (B) word frequency in known words and (C) orthographic neighborhood in pseudowords, in three ROIs (β ± SE; mFus, 62 electrodes, 21 patients; IPS, 21 electrodes, 9 patients; aIFG, 35 electrodes, 9 patients). Colored bars represent regions of significance (q < 0.05).
Figure 9.
Figure 9.
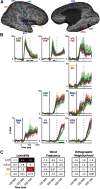
Spatiotemporal activation profiles in right hemisphere. A, Right hemisphere analogs of the main analysis ROIs, highlighting all 588 responsive electrodes (of 1712 implanted in right hemisphere). B, Mean activation (±SE) for each word class, within each ROI, during word reading, averaged within patient, time-locked to stimulus onset. Number of electrodes and patients, per ROI, is indicated. Colored bars represent regions of significant difference from exception words (Wilcoxon signed-rank, p < 0.05 for >100 ms). C, BF analysis of lexicality, word frequency, and orthographic neighborhood effects in the four prearticulatory ROIs, for three time windows. Lexicality tested all known words against pseudowords. Word frequency was regressed across all known words. Orthographic neighborhood was regressed across all pseudowords. ln(BF10) shown for each contrast and values >2.3 are highlighted. Centers of mass for each of the right hemispheric ROIs, in Talairach space, were as follows: LOT, 32, −61, −15; mFus, 39, −33, −21; IPS, 30, −57, 43; aIFG, 43, 30, 9; vMC, 50, −14, 32; SMG, 36, −30, 39; SMA, 5, −9, 48; PI, 38, −16, 12; STG, 56, −31, −4.
Figure 10.
Figure 10.
Functional topography of mFus. A, Ventral view of the pial surface, highlighting the medial (green) and lateral (pink) mFus sub-ROIs. B, Mean (±SE) BGA within each sub-ROI. Number of electrodes and patients, per sub-ROI, is indicated. C, β ± SE of the LME-derived effect of word frequency for each sub-ROI. Colored bars represent regions of significance (q < 0.05).

References

    1. Argall BD, Saad ZS, Beauchamp MS (2006) Simplified intersubject averaging on the cortical surface using SUMA. Hum Brain Mapp 27:14–27. 10.1002/hbm.20158 - DOI - PMC - PubMed
    1. Baldo JV, Wilkins DP, Ogar J, Willock S, Dronkers NF (2011) Role of the precentral gyrus of the insula in complex articulation. Cortex 47:800–807. 10.1016/j.cortex.2010.07.001 - DOI - PubMed
    1. Binder JR, Desai RH, Graves WW, Conant LL (2009) Where is the semantic system? A critical review and meta-analysis of 120 functional neuroimaging studies. Cereb Cortex 19:2767–2796. 10.1093/cercor/bhp055 - DOI - PMC - PubMed
    1. Binder JR, et al. . (2020) Temporal lobe regions essential for preserved picture naming after left temporal epilepsy surgery. Epilepsia 61:1939–1948. 10.1111/epi.16643 - DOI - PMC - PubMed
    1. Bouhali F, Bézagu Z, Dehaene S, Cohen L (2019) A mesial-to-lateral dissociation for orthographic processing in the visual cortex. Proc Natl Acad Sci USA 116:21936–21946. 10.1073/pnas.1904184116 - DOI - PMC - PubMed

Publication types