

Variation in Peritoneal Dialysis Time on Therapy by Country: Results from the Peritoneal Dialysis Outcomes and Practice Patterns Study
- PMID: 35641246
- PMCID: PMC9269666
- DOI: 10.2215/CJN.16341221
Variation in Peritoneal Dialysis Time on Therapy by Country: Results from the Peritoneal Dialysis Outcomes and Practice Patterns Study
Abstract
Background and objectives: Quantifying contemporary peritoneal dialysis time on therapy is important for patients and providers. We describe time on peritoneal dialysis in the context of outcomes of hemodialysis transfer, death, and kidney transplantation on the basis of the multinational, observational Peritoneal Dialysis Outcomes and Practice Patterns Study (PDOPPS) from 2014 to 2017.
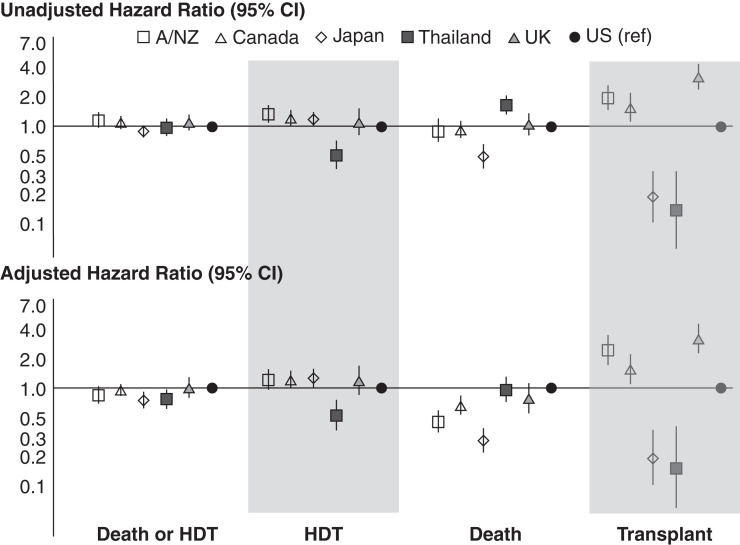
Design, setting, participants, & measurements: Among 218 randomly selected peritoneal dialysis facilities (7121 patients) in the PDOPPS from Australia/New Zealand, Canada, Japan, Thailand, the United Kingdom, and the United States, we calculated the cumulative incidence from peritoneal dialysis start to hemodialysis transfer, death, or kidney transplantation over 5 years and adjusted hazard ratios for patient and facility factors associated with death and hemodialysis transfer.
Results: Median time on peritoneal dialysis ranged from 1.7 (interquartile range, 0.8-2.9; the United Kingdom) to 3.2 (interquartile range, 1.5-6.0; Japan) years and was longer with lower kidney transplantation rates (range: 32% [the United Kingdom] to 2% [Japan and Thailand] over 3 years). Adjusted hemodialysis transfer risk was lowest in Thailand, but death risk was higher in Thailand and the United States compared with most countries. Infection was the leading cause of hemodialysis transfer, with higher hemodialysis transfer risks seen in patients having psychiatric disorder history or elevated body mass index. The proportion of patients with total weekly Kt/V ≥1.7 at a facility was not associated with death or hemodialysis transfer.
Conclusions: Countries in the PDOPPS with higher rates of kidney transplantation tended to have shorter median times on peritoneal dialysis. Identification of infection as a leading cause of hemodialysis transfer and patient and facility factors associated with the risk of hemodialysis transfer can facilitate interventions to reduce these events.
Podcast: This article contains a podcast at https://www.asn-online.org/media/podcast/CJASN/2022_05_31_CJN16341221.mp3.
Keywords: hemodialysis; kidney transplantation; peritoneal dialysis.
Copyright © 2022 by the American Society of Nephrology.
Figures


Comment in
-
International Variation in Time on Peritoneal Dialysis: Time for a Closer Look?Clin J Am Soc Nephrol. 2022 Jun;17(6):782-784. doi: 10.2215/CJN.04800422. Clin J Am Soc Nephrol. 2022. PMID: 35641247 Free PMC article. No abstract available.
References
-
- Pecoits-Filho R, Okpechi IG, Donner JA, Harris DCH, Aljubori HM, Bello AK, Bellorin-Font E, Caskey FJ, Collins A, Cueto-Manzano AM, Feehally J, Goh BL, Jager KJ, Nangaku M, Rahman M, Sahay M, Saleh A, Sola L, Turan Kazancioglu R, Walker RC, Walker R, Yao Q, Yu X, Zhao MH, Johnson DW: Capturing and monitoring global differences in untreated and treated end-stage kidney disease, kidney replacement therapy modality, and outcomes. Kidney Int Suppl (2011) 10: e3–e9, 2020 - PMC - PubMed
-
- Li PK, Chow KM, Van de Luijtgaarden MW, Johnson DW, Jager KJ, Mehrotra R, Naicker S, Pecoits-Filho R, Yu XQ, Lameire N: Changes in the worldwide epidemiology of peritoneal dialysis. Nat Rev Nephrol 13: 90–103, 2017 - PubMed
-
- Collins AJ, Hao W, Xia H, Ebben JP, Everson SE, Constantini EG, Ma JZ: Mortality risks of peritoneal dialysis and hemodialysis. Am J Kidney Dis 34: 1065–1074, 1999 - PubMed
Publication types
MeSH terms
Grants and funding
LinkOut - more resources
Full Text Sources
Medical
