. 2022 Aug 1;99(5):e476-e487.
doi: 10.1212/WNL.0000000000200605.

β-Amyloid-Dependent and -Independent Genetic Pathways Regulating CSF Tau Biomarkers in Alzheimer Disease

Collaborators, Affiliations

β-Amyloid-Dependent and -Independent Genetic Pathways Regulating CSF Tau Biomarkers in Alzheimer Disease

Atul Kumar et al. Neurology. .

Abstract

Background and objectives: Abnormal metabolism of β-amyloid (Aβ) and soluble phosphorylated tau (P-tau), as well as neurodegeneration, are key components of Alzheimer disease (AD), but it is unclear how these different processes are related to genetic risk factors for AD.

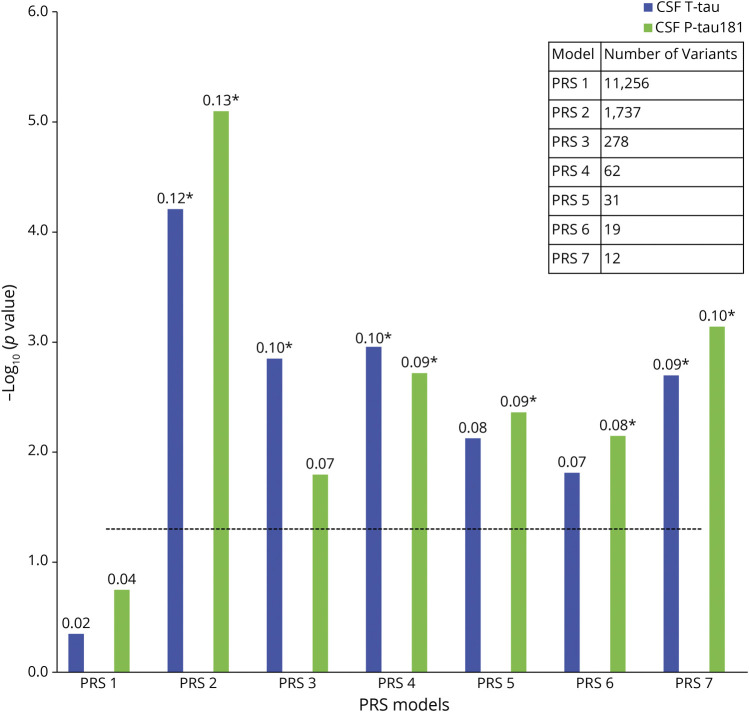
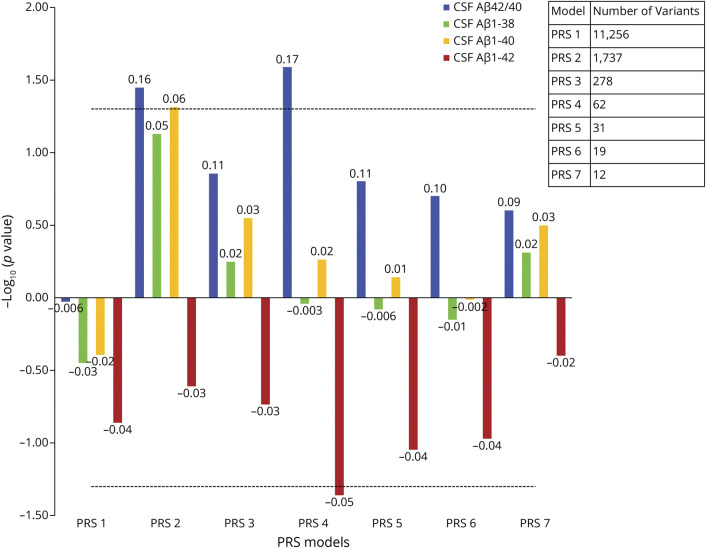
Methods: In the Swedish BioFINDER study, we tested associations between a priori defined polygenic risk scores (PRSs) for AD (excluding single-nucleotide polymorphism [SNP] within the APOE region in the main analysis) and biomarkers in CSF (total tau [T-tau] and P-tau181; Aβ1-38, Aβ1-40, Aβ1-42, and Aβ1-42/1-40; and neurofilament light [NfL]) in cognitively unimpaired (CU) individuals (n = 751), and in patients with mild cognitive impairment (MCI) (n = 212) and AD dementia (n = 150). Results were validated in the Alzheimer's Disease Neuroimaging Initiative data set with 777 individuals (AD = 119, MCI = 442, and CU = 216).

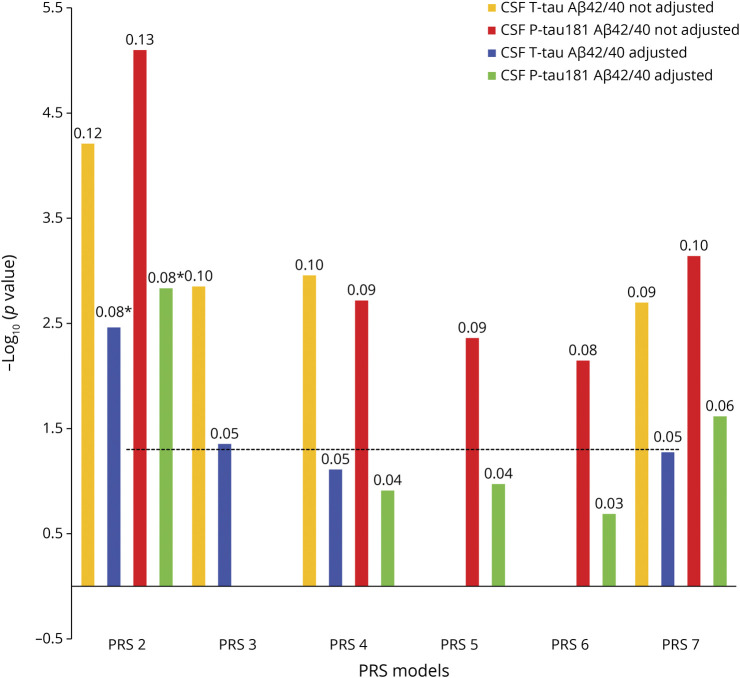
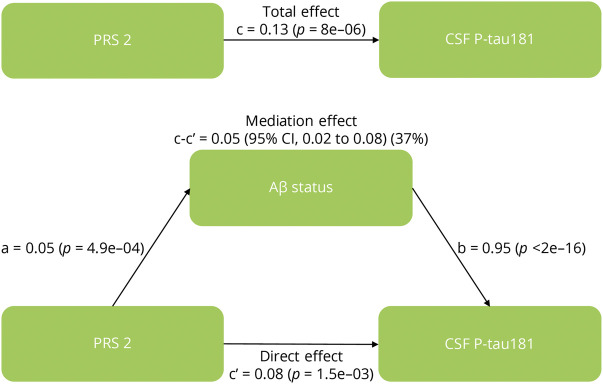
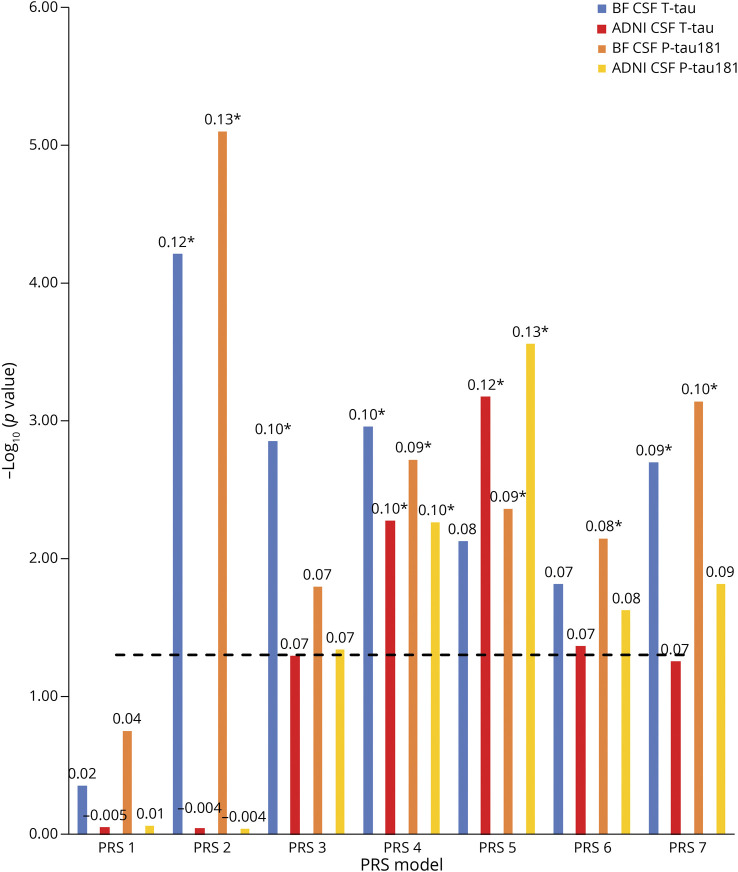
Results: PRSs with SNPs significant at p < 5e-03 (∼1,742 variants) were associated with higher CSF P-tau181 (β = 0.13, p = 5.6e-05) and T-tau (β = 0.12, p = 4.3e-04). The associations between PRS and tau measures were partly attenuated but remained significant after adjusting for Aβ status. Aβ pathology mediated 37% of the effect of this PRS on tau levels. Aβ-dependent and Aβ-independent subsets of the PRS were identified and characterized. There were also associations between PRSs and CSF Aβ biomarkers with nominal significance, but not when corrected for multiple comparisons. There were no associations between PRSs and CSF NfL.

Discussion: Genetic pathways implicated in causing AD are related to altered levels of soluble tau through both Aβ-dependent and Aβ-independent mechanisms, which may have relevance for anti-tau drug development.


Figures

Figure 1
Figure 1. Associations Between PRSs and Tau Measures
The x-axis represents the 7 different PRS models at different p value thresholds based on the GWAS summary statistics (PRS1 ≤ 0.05, PRS2 ≤ 5e-3, PRS3 ≤ 5e-4, PRS4 ≤ 5e-5, PRS5 ≤ 5e-6, PRS6 ≤ 5e-7, and PRS7 ≤ 5e-8). The models were adjusted for age, sex, education, baseline MMSE, APOE ε2 and ε4 count, and the top 10 principal components from the principal component analysis on the entire set of genotype data. The y-axis shows the negative log of the p value for the significance of associations between PRS models with different tau measures. The values on the top of each bar show the association's effect size (β-coefficient). The horizontal dotted line shows the p value threshold of 0.05. *These PRSs were significant after Bonferroni correction at p value <0.05. GWAS = genome-wide association study; MMSE = mini‐mental state examination; PRS = polygenic risk score.
Figure 2
Figure 2. Associations Between PRSs and Aβ Measures
The x-axis represents the 7 different PRS models at different p value thresholds based on the GWAS summary statistics (PRS1 ≤ 0.05, PRS2 ≤ 5e-3, PRS3 ≤ 5e-4, PRS4 ≤ 5e-5, PRS5 ≤ 5e-6, PRS6 ≤ 5e-7, and PRS7 ≤ 5e-8). The models were adjusted for age, sex, education, baseline MMSE (not for the intercept), APOE ε2 and ε4 count, and the top 10 principal components from the principal component analysis on the entire set of genotype data. The y-axis shows the negative log of the p value showing the significance of association for PRS models with different β-amyloid measures. The values on the top of each bar show the association's effect size (β-coefficient). For negative effect size, the bar is inverted. CSF Aβ42/Aβ40 is used as a dichotomous variable here (with 1 = Aβ positive). The horizontal dotted line shows the p value threshold of 0.05. Aβ = β-amyloid; MMSE = mini‐mental state examination; PRS = polygenic risk score; P-tau181 = phosphorylated tau181; T-tau = total tau.
Figure 3
Figure 3. Associations Between Significant PRSs and Tau Measures Adjusted for CSF Aβ42/Aβ40 Ratios
The x-axis shows the different PRS models (this analysis only included models that were significantly associated with tau measures when not adjusted for CSF Aβ42/Aβ40 ratios, Figure 1). The models were adjusted for age, sex, education, baseline MMSE (not for the intercept), APOE ε2 and ε4 count, and the top 10 principal components from the principal component analysis on the entire set of genotype data, as well as CSF Aβ42/Aβ40 ratios. The y-axis shows the negative log of the p value for the significance of associations between PRS models with different tau measures. The values on the top of each bar show the association's effect size (β-coefficient). The horizontal dotted line shows the p value threshold of 0.05. *These PRSs were significant after adjusted for CSF Aβ42/Aβ40 ratios and Bonferroni correction at p value < 0.05. Aβ = β-amyloid; MMSE = mini‐mental state examination; PRS = polygenic risk score; P-tau181 = phosphorylated tau181; T-tau = total tau.
Figure 4
Figure 4. Mediation Analysis Between PRS, Aβ Status, and CSF P-tau181
Mediation analysis with PRS2 as a predictor of CSF P-tau181, mediated by Aβ status. This figure includes the following standardized regression coefficients: a, the effect of PRS on Aβ; b, the effect of Aβ on the CSF P-tau181 level; c, the direct association between PRS and CSF P-tau181 level; c', the association between PRS and CSF P-tau181 level when adjusting for Aβ; and c-c', the mediated effect on the CSF P-tau181 level (with % mediation). Aβ = β-amyloid; PRS = polygenic risk score; P-tau181 = phosphorylated tau181.
Figure 5
Figure 5. Comparative Results for Associations Between PRSs and Tau Measures in BF and ADNI
The x-axis represents the 7 different PRS models at different p value thresholds based on the GWAS summary statistics (PRS1 ≤ 0.05, PRS2 ≤ 5e-3, PRS3 ≤ 5e-4, PRS4 ≤ 5e-5, PRS5 ≤ 5e-6, PRS6 ≤ 5e-7, and PRS7 ≤ 5e-8). The models were adjusted for age, sex, education, baseline MMSE, APOE ε2 and ε4 count, and the top 10 principal components from the principal component analysis on the entire set of genotype data. The y-axis shows the negative log of the p value for the significance of associations between PRS models with different tau measures. The values on the top of each bar show the association's effect size (β-coefficient). The horizontal dotted line shows the p value threshold of 0.05. *These PRSs were significant after Bonferroni correction at p value <0.05. Aβ = β-amyloid; ADNI = Alzheimer's Disease Neuroimaging Initiative; BF = BioFINDER; MMSE = mini‐mental state examination; PRS = polygenic risk score; P-tau181 = phosphorylated tau181; T-tau = total tau.

References

    1. Hardy J, Selkoe DJ. The amyloid hypothesis of Alzheimer's disease: progress and problems on the road to therapeutics. Science. 2002;297(5580):353-356. - PubMed
    1. Jack CR, Petersen RC, Xu Y, et al. . Rates of hippocampal atrophy correlate with change in clinical status in aging and AD. Neurology. 2000;55(4):484-490. - PMC - PubMed
    1. Jack CR Jr, Lowe VJ, Weigand SD, et al. . Serial PIB and MRI in normal, mild cognitive impairment and Alzheimer's disease: implications for sequence of pathological events in Alzheimer's disease. Brain. 2009;132(5):1355-1365. - PMC - PubMed
    1. Hagenaars SP, Radaković R, Crockford C, et al. ; International FTD-Genomics Consortium. Genetic risk for neurodegenerative disorders, and its overlap with cognitive ability and physical function. PLoS One. 2018;13(6):e0198187. - PMC - PubMed
    1. Blennow K. A review of fluid biomarkers for Alzheimer's disease: moving from CSF to blood. Neurol Ther. 2017;6(1):15-24. - PMC - PubMed