. 2022 May 31;13(1):3017.
doi: 10.1038/s41467-022-30717-6.

Genomic dissection of Klebsiella pneumoniae infections in hospital patients reveals insights into an opportunistic pathogen

Affiliations

Genomic dissection of Klebsiella pneumoniae infections in hospital patients reveals insights into an opportunistic pathogen

Claire L Gorrie et al. Nat Commun. .

Abstract

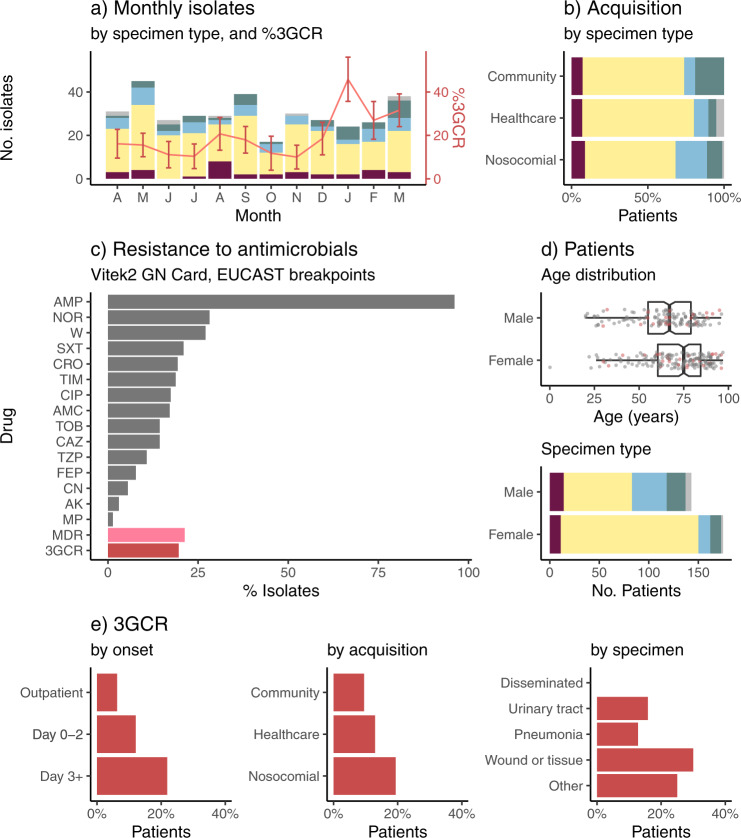
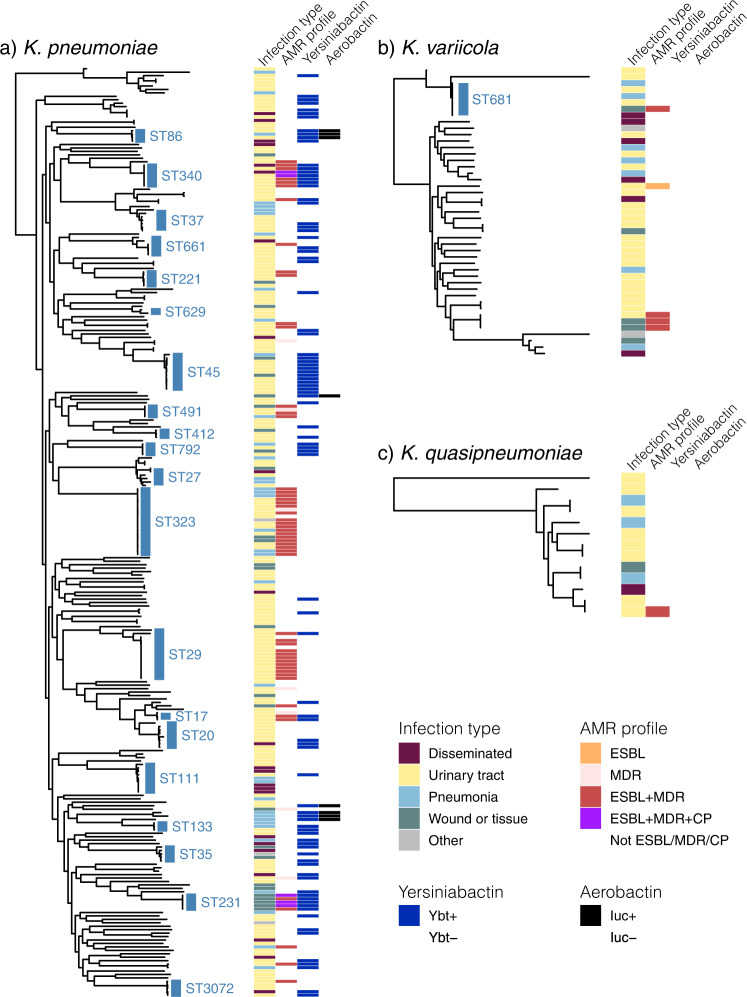
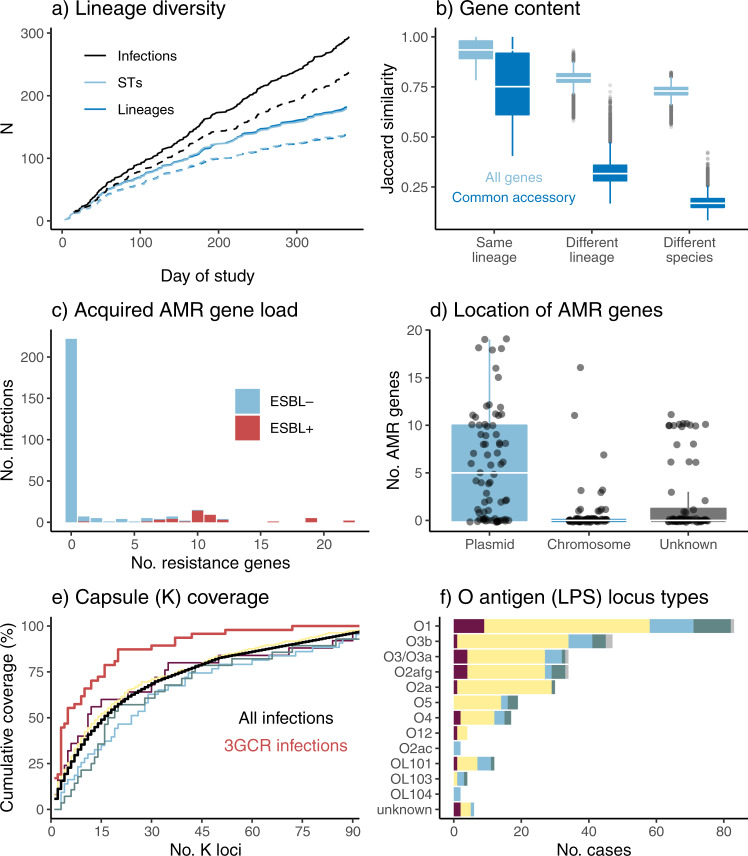
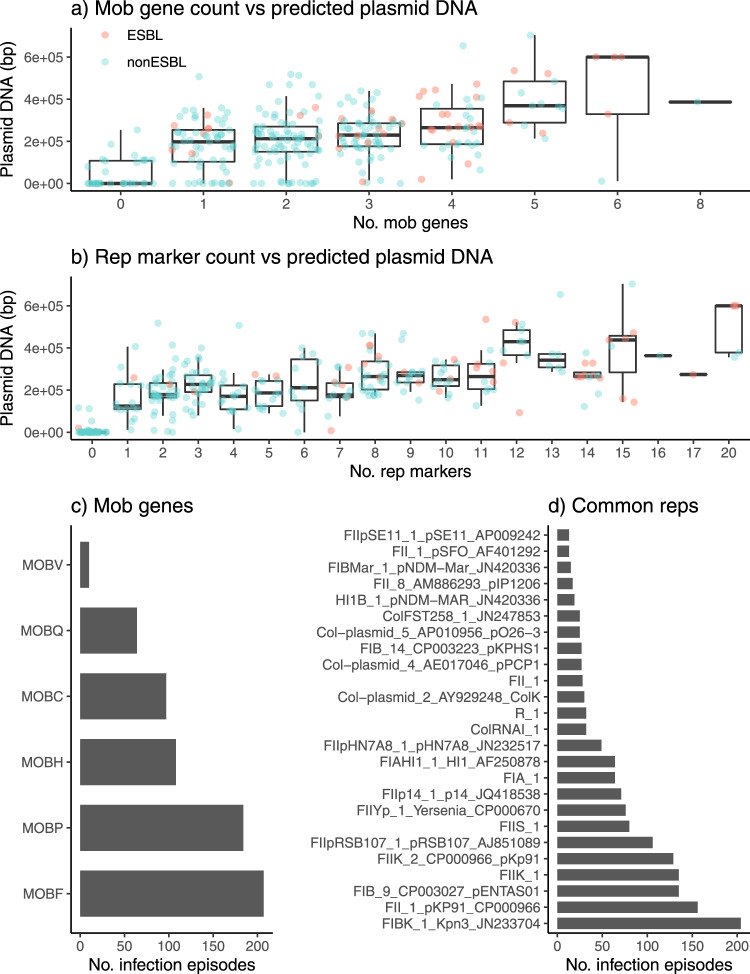
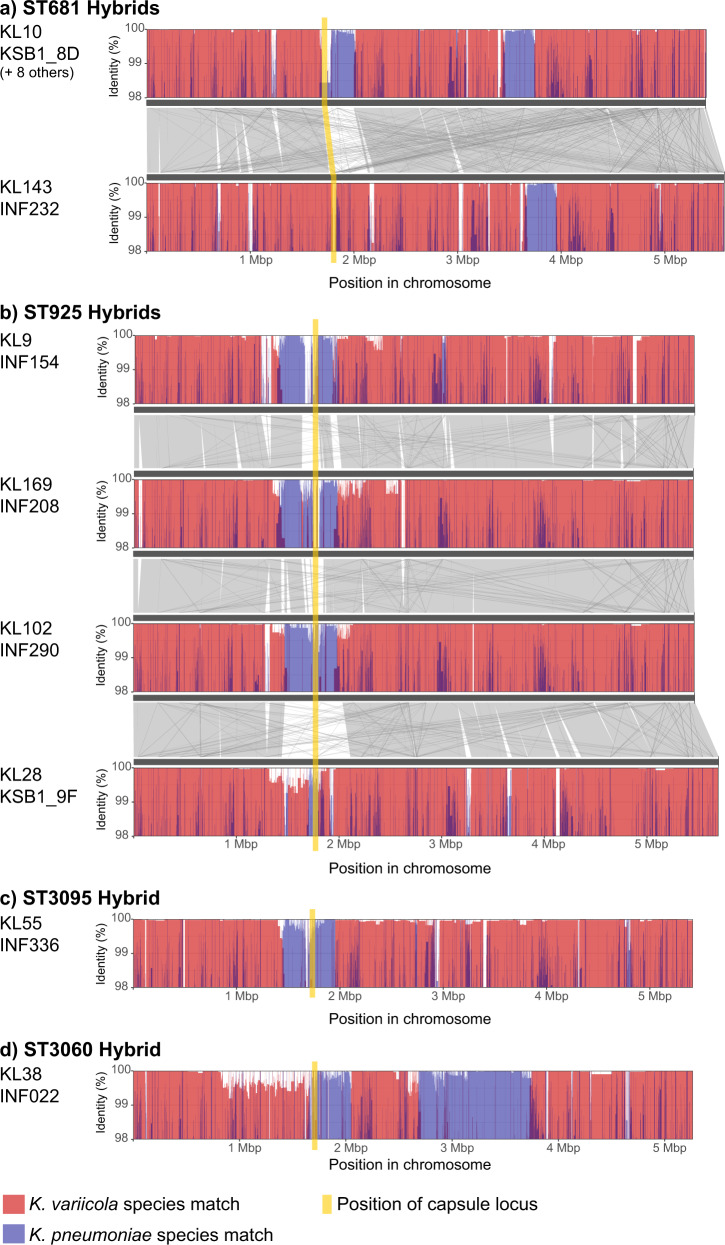
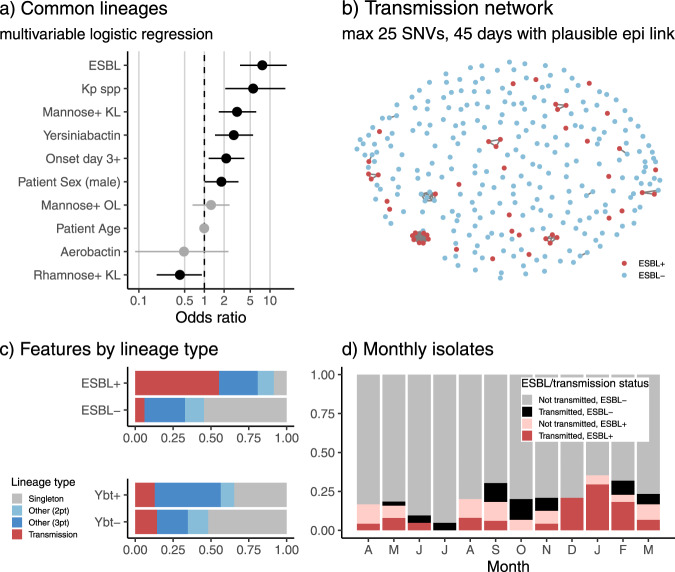
Klebsiella pneumoniae is a major cause of opportunistic healthcare-associated infections, which are increasingly complicated by the presence of extended-spectrum beta-lactamases (ESBLs) and carbapenem resistance. We conducted a year-long prospective surveillance study of K. pneumoniae clinical isolates in hospital patients. Whole-genome sequence (WGS) data reveals a diverse pathogen population, including other species within the K. pneumoniae species complex (18%). Several infections were caused by K. variicola/K. pneumoniae hybrids, one of which shows evidence of nosocomial transmission. A wide range of antimicrobial resistance (AMR) phenotypes are observed, and diverse genetic mechanisms identified (mainly plasmid-borne genes). ESBLs are correlated with presence of other acquired AMR genes (median n = 10). Bacterial genomic features associated with nosocomial onset are ESBLs (OR 2.34, p = 0.015) and rhamnose-positive capsules (OR 3.12, p < 0.001). Virulence plasmid-encoded features (aerobactin, hypermucoidy) are observed at low-prevalence (<3%), mostly in community-onset cases. WGS-confirmed nosocomial transmission is implicated in just 10% of cases, but strongly associated with ESBLs (OR 21, p < 1 × 10-11). We estimate 28% risk of onward nosocomial transmission for ESBL-positive strains vs 1.7% for ESBL-negative strains. These data indicate that K. pneumoniae infections in hospitalised patients are due largely to opportunistic infections with diverse strains, with an additional burden from nosocomially-transmitted AMR strains and community-acquired hypervirulent strains.


Conflict of interest statement

The authors declare no competing interests.

Figures

Fig. 1
Fig. 1. Characteristics of clinical isolates identified as K. pneumoniae in the hospital microbiological diagnostic laboratory.
a Monthly isolate counts (total 362 isolates, from 318 patients), coloured by specimen type (maroon = disseminated, yellow = urine, blue = respiratory, green = wound, grey = other). Red line shows frequency of 3rd generation cephalosporin resistant (3GCR) isolates per month, according to the right-hand y-axis (central point indicates frequency, error bars indicate standard error). b Specimen types (coloured as per panel a) according to inferred mode of acquisition of infection (inferred from hospital contact in past 30 days (nosocomial) or past year (healthcare associated), see Methods). c Bars show proportion of isolates resistant to each drug (AK, amikacin; AMC, amoxicillin–clavulanic acid; AMP, ampicillin; CAZ, ceftazidime; CIP, ciprofloxacin; CRO, ceftriaxone; FEP, cefepime; CN, gentamicin; MP, meropenem; NOR, norfloxacin; SXT, trimethoprim-sulfamethoxazole; TIM, ticarcillin–clavulanic acid; W, trimethoprim; TOB, tobramycin; TZP, tazobactam-piperacillin). MDR = resistant to ≥3 drug classes other than ampicillin; 3GCR = resistant to CRO and/or CAZ. d Characteristics of patients (n = 318) from whom K. pneumoniae was isolated. Age distribution: points indicate individual patients (those with ≥1 3GCR isolate are coloured red). Boxplot elements are: center line, median; box limits, upper and lower quartiles; whiskers, 1.5x interquartile range; points, all individual patients. Specimen type: stacked bars are coloured as per panel a to indicate the first specimen type, for each patient, from which K. pneumoniae was isolated. e 3GCR rates (amongst first isolate per patient, n = 318 patients), stratified by (i) day of onset of infection, relative to day of hospital admission = 0; (ii) mode of acquisition, inferred from hospital contact in past 30 days (nosocomial) or past year (healthcare associated) (see Methods); (iii) specimen type (note one patient had 3GCR disseminated infection, after an initial susceptible UTI).
Fig. 2
Fig. 2. Core genome phylogenies for K. pneumoniae species complex isolates.
a K. pneumoniae, b K. variicola, c K. quasipneumoniae. Trees shown are subtrees extracted from a maximum likelihood phylogeny inferred from a complex-wide alignment of core gene SNVs for all 328 sequenced clinical isolates (i.e., each species tree is rooted using the others as outgroups), available at https://microreact.org/project/kaspahclinical. The 21 ‘common’ lineages, each identified in ≥3 patients, are labelled in blue with their sequence type (ST). Columns indicate (1) infection type (disseminated, urinary tract, respiratory, wound/tissue, other); (2) antimicrobial resistance (ESBL, MDR, ESBL + MDR, ESBL + MDR + CP); (3) yersiniabactin (Ybt+, identified in K. pneumoniae only); (4) aerobactin (Iuc+, identified in K. pneumoniae only); coloured as per inset legend. ESBL = extended spectrum beta-lactamase, MDR = resistant to ≥3 drug classes other than ampicillin, CP = carbapenemase producing.
Fig. 3
Fig. 3. Genomic diversity of clinical isolates identified as K. pneumoniae in the hospital microbiological diagnostic laboratory (one per infection episode, n = 294).
a Accumulation of unique infection episodes (total 294 in 289 patients), lineages or sequence types (STs) over the study period. Solid lines = all K. pneumoniae species complex (KpSC); dashed lines = K. pneumoniae only (total n = 238). b Distribution of pairwise gene content Jaccard similarity between genomes, calculated using either all genes (including n = 3095 core genes present in all strains), or the n = 4,001 common accessory genes (each present in 5–95% of genomes sequenced). Boxplots elements are: center line, median; box limits, upper and lower quartiles; whiskers, 1.5x interquartile range; points, outliers. c Distribution of the number of acquired antimicrobial resistance (AMR) genes per genome, stratified by detection of an extended spectrum beta-lactamase (ESBL) gene. d Number of AMR genes per genome that were attributed to plasmid- or chromosome-derived contigs using Kraken. Counts in each category are given for each of the n = 294 genomes. Boxplots elements are: center line, median; box limits, upper and lower quartiles; whiskers, 1.5x interquartile range; points, outliers. e Theoretical coverage of infections (y-axis) by vaccines targeting capsular antigens encoded by increasing numbers of K loci (x-axis, K loci ordered from most to least common in this data set as shown in Supplementary Table 1). Black line shows cumulative coverage of all unique infections (n = 294); red line shows unique 3GCR infections (n = 47); other lines show coverage of different infection types (maroon = disseminated, yellow = urine, blue = respiratory, green = wound, grey = other). f Frequency of O antigen (LPS) synthesis loci, stratified by specimen type (coloured as per panel e).
Fig. 4
Fig. 4. Measures of plasmid number and diversity.
Data used for this analysis was the first isolate per unique infection episode, for 294 genomically-defined infection episodes. Distribution of total DNA sequence (bp) in contigs assigned as plasmids are shown, stratified by a number of mob genes identified per genome and b number of uniquely distributed replicon markers identified per genome. Each point represents a unique genome sequence and is coloured according to whether ESBL genes were detected in the genome (inset legend). Boxplots elements are: center line, median; box limits, upper and lower quartiles; whiskers, 1.5x interquartile range. Linear regression model fit: Total plasmid DNA (kbp) ~79 + 18 *(#mob) + 16 *(#rep); p = 8 x 10−4 for mob; p < 1 × 10−15 for rep. c Frequency of individual mob types. d Frequency of 25 common replicon markers (each present in ≥5% of infections).
Fig. 5
Fig. 5. Details of hybrids identified between different species of the Klebsiella pneumoniae species complex.
Plots show nucleotide identity to K. variicola (red) or K. pneumoniae (blue) sequences in sliding windows along each genome. For a and b, homology between different genomes is shown in grey. Position of the capsule (K) biosynthesis locus is shown in yellow and is directly adjacent to the outer lipopolysaccharide (O) synthesis locus.
Fig. 6
Fig. 6. Features of common lineages, and contribution of common and transmitted lineages to infection burden.
a Genetic and patient characteristics associated with common lineages (identified in ≥3 patients), across n = 294 unique infection episodes. Circles indicate odds ratios estimated in a single multivariable logistic regression model with all 10 predictors; lines indicate 95% confidence intervals for those odds ratios; unadjusted p-values are shown, significant (p < 0.05) associations are coloured black. Binary variables: ESBL (extended spectrum beta-lactamase detected); Kp spp (K. pneumoniae species); Mannose+ KL (K locus includes man operon); Yersiniabactin (ybt detected); Onset day 3+ (isolated from specimen collected on day 3 or later); Patient sex (male); Mannose+ OL (O locus includes man operon); Aerobactin (iuc detected); Rhamnose+ KL (K locus includes rml operon). Continuous variable: Patient age (years). b Transmission network showing 12 clusters, defined as infection episodes in different patients identified less than 45 days apart with isolate genomes separated by ≤25 SNVs (mean 0.7 SNVs) and with plausible epidemiology (onset of non-index case occurred during hospital stay, at least 2 days after index case, and patients spent time in same hospital). Details of clusters are given in Supplementary Table 2. c Infections of different classes (ESBL+/−, ybt+/−) stratified by lineage type (transmission cluster, as defined in b; other common lineage, identified in ≥3 patients; lineage identified in 2 patients; or singleton lineage identified in 1 patient). d Monthly frequencies of ESBL+ and/or transmission-linked isolates. These analyses were completed using one isolate per unique infection episode (n = 294); where there were ESBL+ and ESBL- variants of the same strain associated with the same infection episode, the ESBL+ variant was included in order to best reflect the nature of the ESBL infection burden.

References

    1. Cassini A, et al. Burden of six healthcare-associated infections on European population health: estimating incidence-based disability-adjusted life years through a population prevalence-based modelling study. PLoS Med. 2016;13:e1002150. doi: 10.1371/journal.pmed.1002150. - DOI - PMC - PubMed
    1. Magill SS, et al. Multistate point-prevalence survey of health care-associated infections. N. Engl. J. Med. 2014;370:1198–1208. doi: 10.1056/NEJMoa1306801. - DOI - PMC - PubMed
    1. Boucher HW, et al. Bad bugs, no drugs: no ESKAPE! An update from the Infectious Diseases Society of America. Clin. Infect. Dis. 2009;48:1–12. doi: 10.1086/595011. - DOI - PubMed
    1. Peleg AY, Hooper DC. Hospital-acquired infections due to Gram-negative bacteria. N. Engl. J. Med. 2010;362:1804–1813. doi: 10.1056/NEJMra0904124. - DOI - PMC - PubMed
    1. Selden R, Lee S, Wang WLL, Bennett JV, Eickhoff TC. Nosocomial Klebsiella infections: intestinal colonization as a reservoir. Ann. Intern Med. 1971;74:657–664. doi: 10.7326/0003-4819-74-5-657. - DOI - PubMed

Publication types