. 2022 May 31;22(1):270.
doi: 10.1186/s12876-022-02352-4.

Serum O-glycosylated hepatitis B surface antigen levels in patients with chronic hepatitis B during nucleos(t)ide analog therapy

Affiliations

Serum O-glycosylated hepatitis B surface antigen levels in patients with chronic hepatitis B during nucleos(t)ide analog therapy

Ayato Murata et al. BMC Gastroenterol. .

Abstract

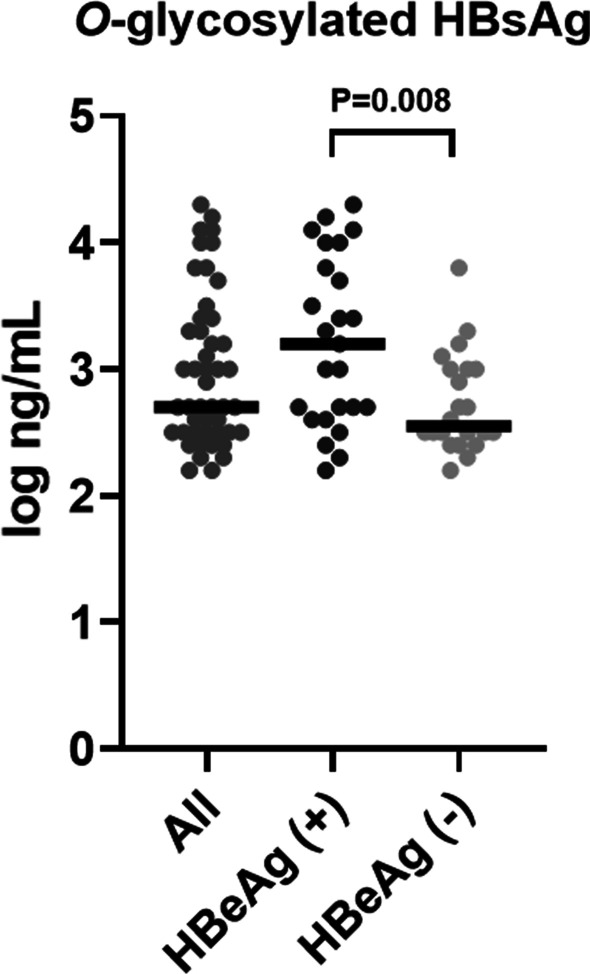
Background: Serum hepatitis B surface antigen (HBsAg) is a component of both hepatitis B virus (HBV) virions and non-infectious subviral particles (SVPs). Recently, O-glycosylation of the PreS2 domain of middle HBsAg protein has been identified as a distinct characteristic of genotype C HBV virions versus SVPs. This study aimed to evaluate serum O-glycosylated HBsAg levels in patients with chronic hepatitis B (CHB) treated with nucleos(t)ide analogs (NAs).

Methods: Forty-seven treatment-naïve patients with genotype C CHB were retrospectively enrolled. Serum O-glycosylated HBsAg levels at baseline and after 48 weeks of NA therapy were quantified by immunoassay using a monoclonal antibody against the O-glycosylated PreS2 domain of middle HBsAg, and their correlations with conventional HBV marker levels were analyzed.

Results: At baseline, the serum O-glycosylated HBsAg levels were significantly correlated with the HBV DNA (P = 0.004), HBsAg (P = 0.005), and hepatitis B-core related antigen (HBcrAg, P = 0.001) levels. Both HBV DNA and O-glycosylated HBsAg levels were decreased after 48 weeks of NA therapy. The significant correlation of the O-glycosylated HBsAg level with the HBsAg or HBcrAg level was lost in patients who achieved undetectable HBV DNA (HBsAg, P = 0.429; HBcrAg, P = 0.065). Immunoprecipitation assays demonstrated that HBV DNA and RNA were detected in the O-glycosylated HBsAg-binding serum fraction, and the proportion of HBV RNA increased during NA therapy (P = 0.048).

Conclusion: Serum O-glycosylated HBsAg levels change during NA therapy and may reflect combined levels of serum HBV DNA and RNA virions. An O-glycosylated HBsAg-based immunoassay may provide a novel means to monitor viral kinetics during NA therapy.

Keywords: Hepatitis B surface antigen; Hepatitis B virus; O-Glycan; Pregenomic RNA; Virion.


Conflict of interest statement

TG has received honoraria from AbbVie, Gilead Sciences Inc., and MSD K.K., and research funding from AbbVie, Otsuka Pharmaceutical, Mitsubishi Tanabe Pharma, JIMRO, and Takeda Pharmaceutical. KA, MS, and HN are employees and CEO of RCMG, Inc., one of the AIST venture companies. AM, SS, and TI had no competing interests.

Figures

Fig. 1
Fig. 1
Distribution of baseline O-glycosylated HBsAg serum levels in the study cohort. The bar in each scatter plot represents the median value. Results for HBeAg-positive and -negative patients were compared using the Mann–Whitney U-test. HBeAg hepatitis B e antigen, HBsAg hepatitis B surface antigen
Fig. 2
Fig. 2
Relationships between O-glycosylated HBsAg levels and conventional HBV marker levels at baseline. Data were analyzed using Spearman’s rank correlation coefficient. Light gray circles represent HBeAg-negative patients, dark gray circles represent HBeAg-positive patients. HBcrAg hepatitis B core-related antigen, HBeAg hepatitis B e antigen, HBsAg hepatitis B surface antigen, HBV hepatitis B virus
Fig. 3
Fig. 3
Comparison of HBV marker levels at baseline and after 48 weeks of NA therapy. The bar in each scatter plot represents the median value. Data were analyzed using Wilcoxon’s signed rank test. HBcrAg hepatitis B core-related antigen, HBsAg hepatitis B surface antigen, HBV hepatitis B virus, NAs nucleos(t)ide analog.
Fig. 4
Fig. 4
Relationships between O-glycosylated HBsAg levels and conventional HBV marker levels after 48 weeks of NA therapy. Data were analyzed using Spearman’s rank correlation coefficient. Light gray circles represent HBeAg-negative patients, dark gray circles represent HBeAg-positive patients. HBcrAg hepatitis B core-related antigen, HBeAg hepatitis B e antigen, HBsAg hepatitis B surface antigen, HBV hepatitis B virus, NA nucleos(t)ide analog
Fig. 5
Fig. 5
Correlations between O-glycosylated HBsAg levels and HBsAg or HBcrAg levels after 48 weeks of NA therapy, stratified by HBV DNA levels at 48 weeks. Data were analyzed using Spearman’s rank correlation coefficient. Light gray circles represent HBeAg-negative patients, dark gray circles represent HBeAg-positive patients. HBcrAg hepatitis B core-related antigen, HBeAg hepatitis B e antigen, HBsAg hepatitis B surface antigen, NA nucleos(t)ide analog
Fig. 6
Fig. 6
Quantification of serum HBV DNA and RNA levels, and proportion of HBV RNA in the O-glycosylated HBsAg-binding fraction in patients with undetectable HBV DNA after 48 weeks of nucleos(t)ide analog therapy. The bars in the scatter plots represent the median values. In the floating boxes, the box length represents the range and the horizontal line within the box represents the median value. Results at baseline and at 48 weeks were compared using Wilcoxon’s signed rank test. HBcrAg hepatitis B core-related antigen, HBsAg hepatitis B surface antigen, HBV hepatitis B virus, IP immunoprecipitate

References

    1. Polaris Observatory Collaborators Global prevalence, treatment, and prevention of hepatitis B virus infection in 2016: a modelling study. Lancet Gastroenterol Hepatol. 2018;3:383–403. doi: 10.1016/S2468-1253(18)30056-6. - DOI - PubMed
    1. Ganem D, Prince AM. Hepatitis B virus infection—natural history and clinical consequence. N Engl J Med. 2004;350:1118–1129. doi: 10.1056/NEJMra031087. - DOI - PubMed
    1. Lee JM, Ahn SH, Kim HS, Park H, Chang HY, Kim DY, et al. Quantitative hepatitis B surface antigen and hepatitis B e antigen titers in prediction of treatment response to entecavir. Hepatology. 2011;53:1486–1493. doi: 10.1002/hep.24221. - DOI - PubMed
    1. Nguyen MH, Wong G, Gane E, Kao JH, Dusheiko G. Hepatitis B virus: advances in prevention, diagnosis, and therapy. Clin Microbiol Rev. 2020;33:e00046–e119. doi: 10.1128/CMR.00046-19. - DOI - PMC - PubMed
    1. Bruss V. Hepatitis B virus morphogenesis. World J Gastroenterol. 2007;13:65–73. doi: 10.3748/wjg.v13.i1.65. - DOI - PMC - PubMed

LinkOut - more resources