. 2022 May 31;19(1):128.
doi: 10.1186/s12974-022-02480-4.

Pentoxifylline alleviates ischemic white matter injury through up-regulating Mertk-mediated myelin clearance

Affiliations

Pentoxifylline alleviates ischemic white matter injury through up-regulating Mertk-mediated myelin clearance

Lili Zheng et al. J Neuroinflammation. .

Abstract

Background: Vascular dementia (VAD) is the second most common type of dementia lacking effective treatments. Pentoxifylline (PTX), a nonselective phosphodiesterase inhibitor, displays protective effects in multiple cerebral diseases. In this study, we aimed to investigate the therapeutic effects and potential mechanisms of PTX in VAD.

Methods: Bilateral common carotid artery stenosis (BCAS) mouse model was established to mimic VAD. Mouse behavior was tested by open field test, novel object recognition test, Y-maze and Morris water maze (MWM) tests. Histological staining, magnetic resonance imaging (MRI) and electron microscopy were used to define white matter integrity. The impact of PTX on microglia phagocytosis, peroxisome proliferator-activated receptors-γ (PPAR-γ) activation and Mer receptor tyrosine kinase (Mertk) expression was assessed by immunofluorescence, western blotting and flow cytometry with the application of microglia-specific Mertk knockout mice, Mertk inhibitor and PPAR-γ inhibitor.

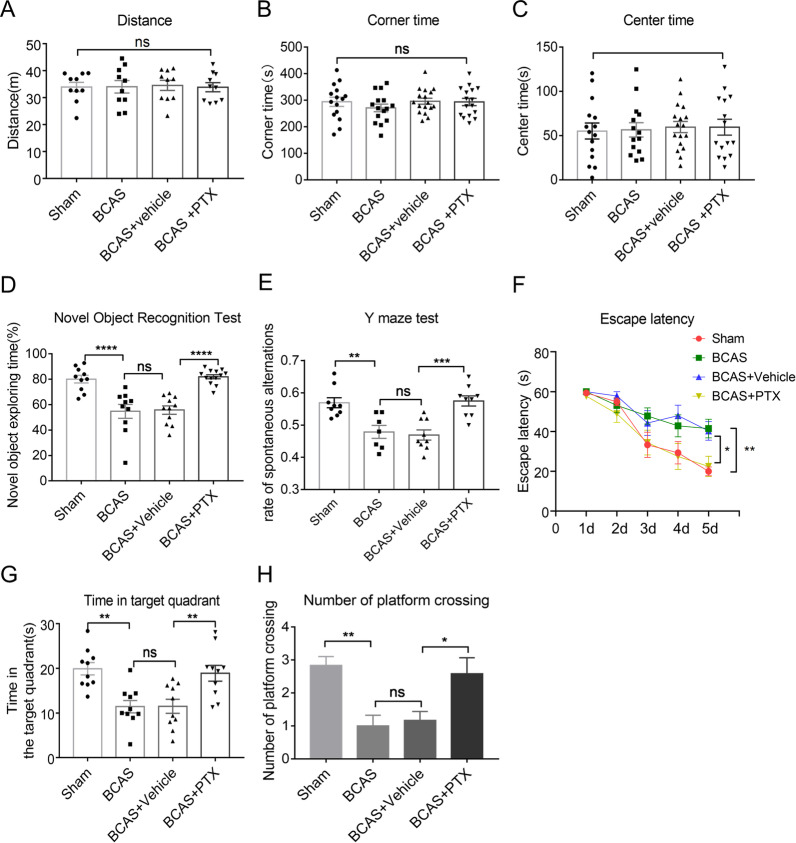
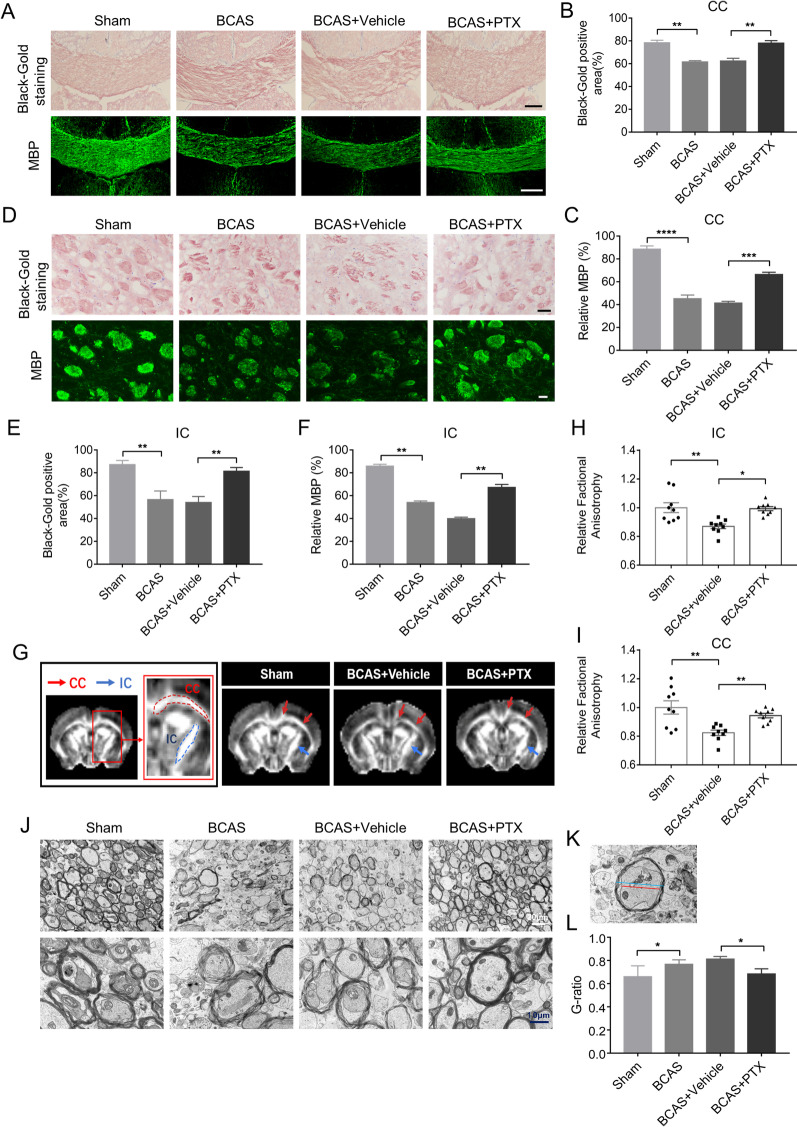
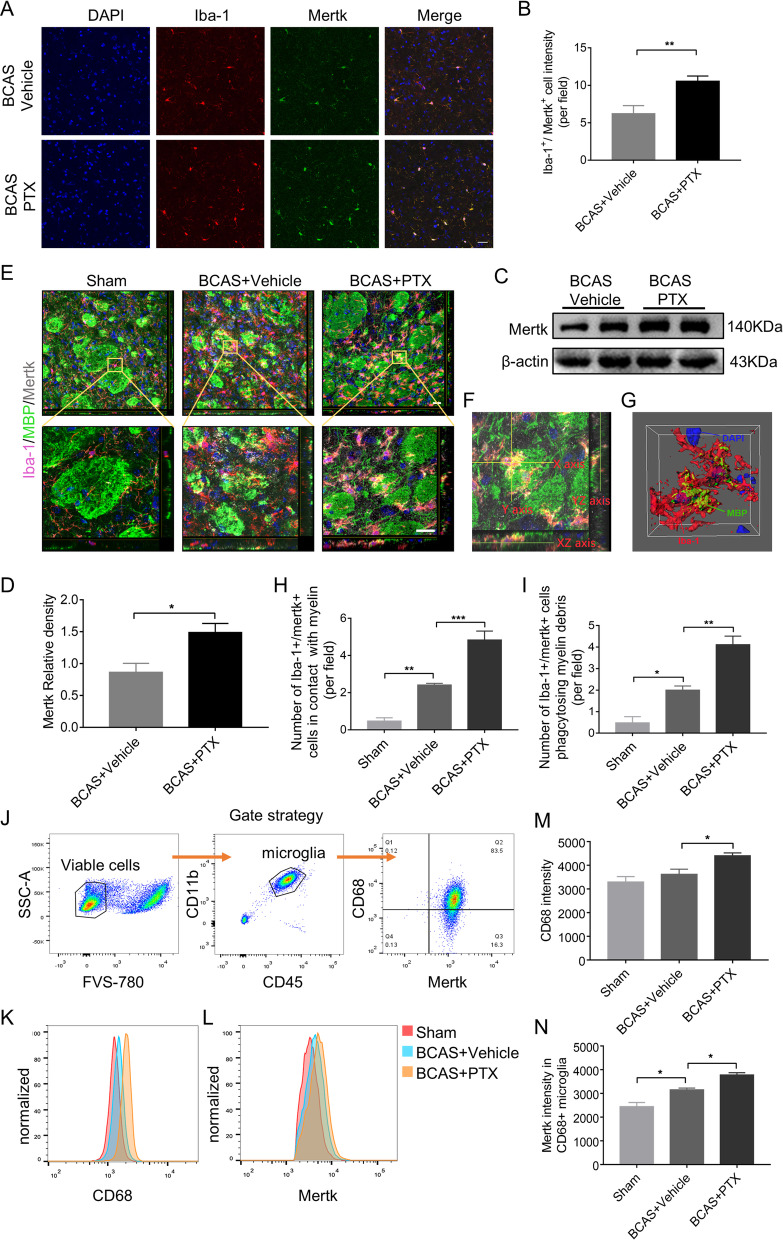
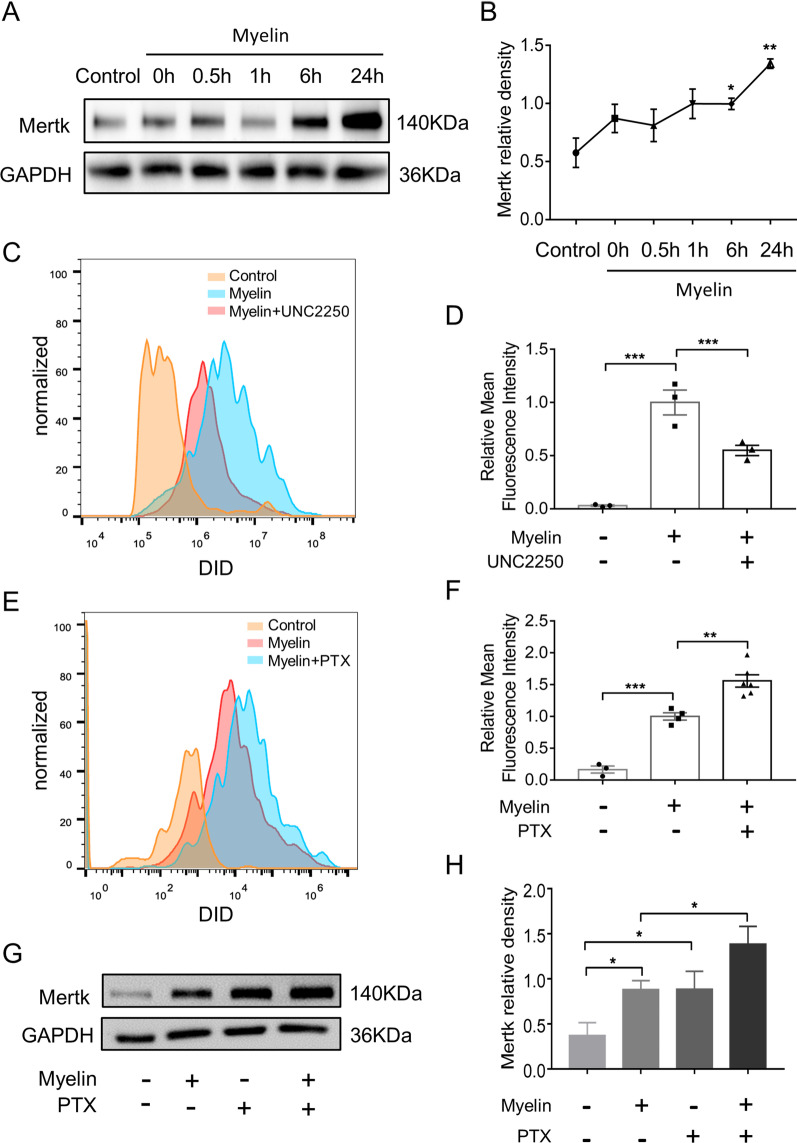
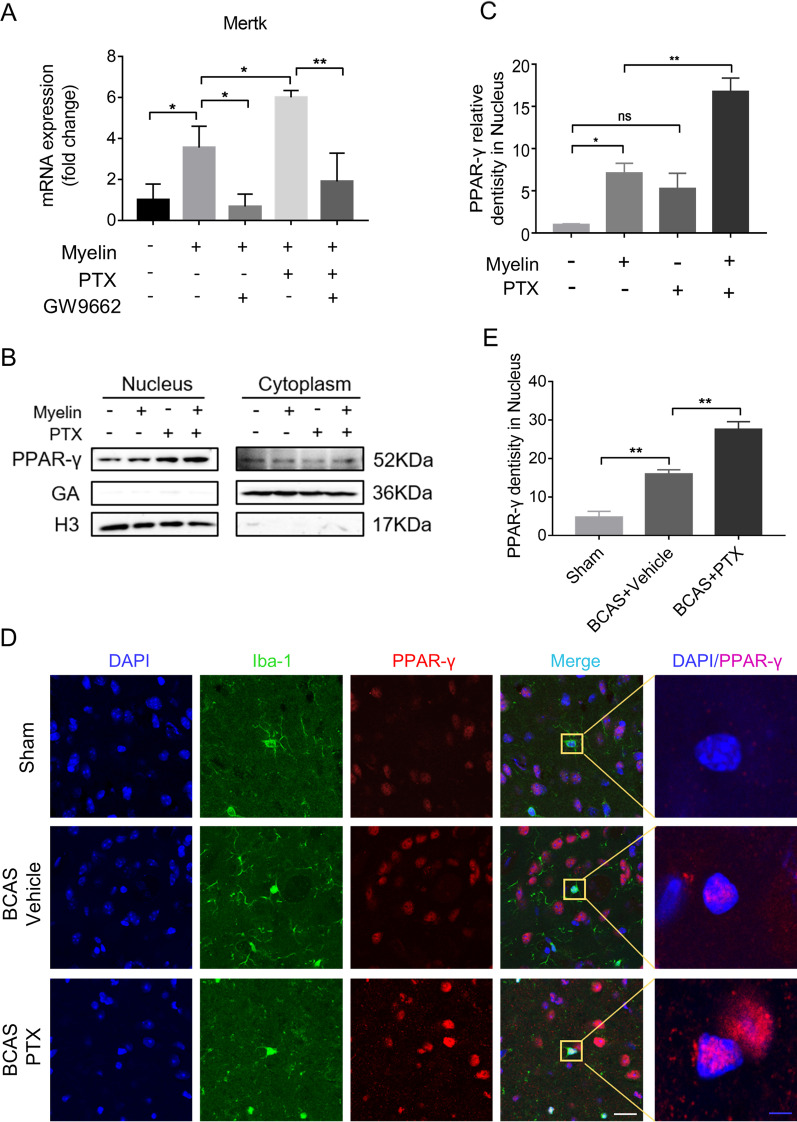
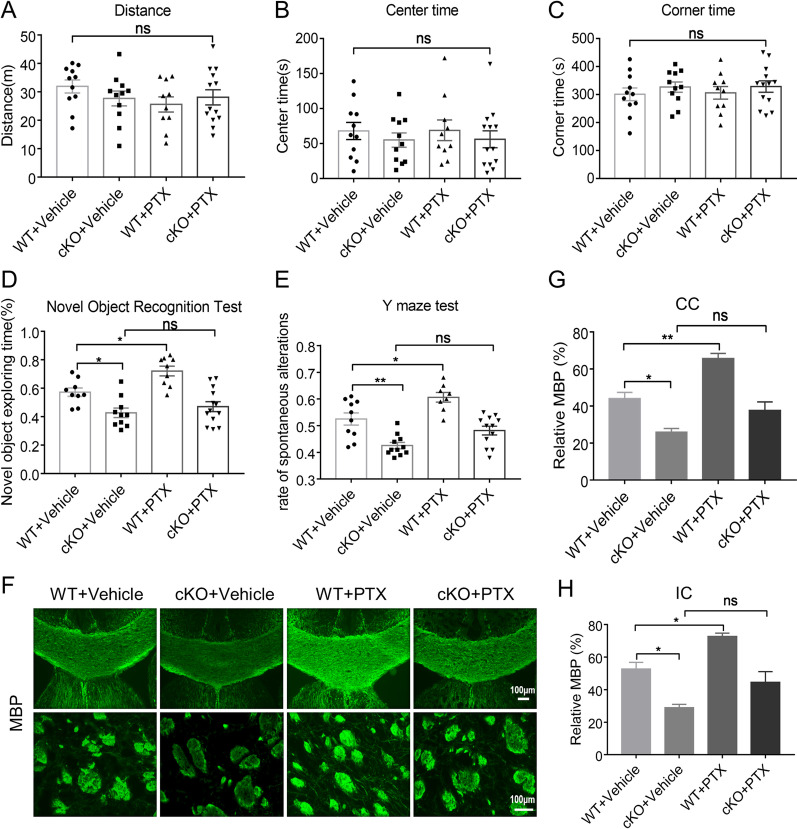
Results: Here, we found that PTX treatment alleviated cognitive impairment in novel object recognition test, Y-maze and Morris water maze tests. Furthermore, PTX alleviated white matter injury in corpus callosum (CC) and internal capsule (IC) areas as shown by histological staining and MRI analysis. PTX-treatment group presented thicker myelin sheath than vehicle group by electron microscopy. Mechanistically, PTX facilitated microglial phagocytosis of myelin debris by up-regulating the expression of Mertk in BCAS model and primary cultured microglia. Importantly, microglia-specific Mertk knockout blocked the therapeutic effects of PTX in BCAS model. Moreover, Mertk expression was regulated by the nuclear translocation of PPAR-γ. Through modulating PPAR-γ, PTX enhanced Mertk expression.

Conclusions: Collectively, our results demonstrated that PTX showed therapeutic potentials in VAD and alleviated ischemic white matter injury via modulating Mertk-mediated myelin clearance in microglia.

Keywords: Mertk; Microglia; PPAR-γ; Pentoxifylline; Phagocytosis; Vascular dementia.


Conflict of interest statement

The authors declare no competing interests.

Figures

Fig. 1
Fig. 1
PTX alleviated cognitive impairment after BCAS. AC The total distance moved (distance) (n = 10 mice per group), the percentage of time in the corner (corner time) (n ≥ 15 mice per group) and the percentage of time in the center (center time) (n ≥ 14 mice per group) of open field test. D, The exploratory preference to novel objects (n ≥ 10 mice per group) in the novel object recognition. E The percentage of spontaneous alternations in the Y-maze test (n ≥ 7 mice per group). FH Escape latency during the acquisition phase (Days 1–5) (n ≥ 10 mice per group), the time in target quadrant (n = 10 mice per group) and the number of platform crossing (n = 12 mice per group) of the probe test (Day 6). All data were presented as the mean ± SEM. *p < 0.05, **p < 0.01, ***p < 0.005, **** < 0.001, “ns” means no significance (p > 0.05)
Fig. 2
Fig. 2
PTX alleviated white matter damage after BCAS. A Representative images of black-gold staining (lavender) and myelin basic protein (green) in corpus callosum (CC) at Day 30 after BCAS. Scale bar: 200 μm. D Representative images of black-gold staining (lavender) and myelin basic protein (green) in internal capsule (IC) at Day 30 after BCAS. Scale bar: 50 μm. B, E Quantification of immunofluorescent intensity of black-gold staining area in CC and IC (n ≥ 3 mice per group). C, F Quantification of immunofluorescent intensity of MBP area in CC and IC (n ≥ 3 mice per group). G Representative images of FA maps of mice brain; Red arrows indicate the CC, Blue arrows indicate the IC. H, Quantification of FA value in IC (n = 9 mice per group). I Quantification of FA value in CC (n = 9 mice per group). J Representative images of Electron microscopy in IC. K Schematic diagram showing the diameter of the axon (red line) and the diameter of the entire myelinated fiber (blue line). L Quantification of G-ratio (n ≥ 4 mice per group). All data were presented as the mean ± SEM. *p < 0.05, **p < 0.01, ***p < 0.005, ****p < 0.001
Fig. 3
Fig. 3
PTX promoted microglia phagocytosis and upregulated Mertk expression after BCAS. A Immunofluorescent images of Iba-1 (red)/Mertk (green)/DAPI (blue) colocalization in IC at Day 30 after BCAS. Scale bar: 20 μm. B Quantification of Iba-1 and Mertk double-positive cells (n = 4 mice per group). C Representative immunoblots probed with antibodies against Mertk and β-actin at Day 30 after BCAS. D Quantification of the levels of Mertk normalized to β-actin (n = 3 mice per group). E Immunostaining of Iba-1 (red)/ MBP (green)/Mertk (grey)/DAPI (blue) in IC at Day 30 after BCAS. F, G 3D-confocal images of Iba-1 (red) phagocytosing MBP debris (green). Scale bar: 40 μm. H Quantification of Iba-1 and Mertk double-positive cells adhered to MBP (n = 3 mice per group). I Quantification of Iba-1 and Mertk double-positive cells phagocytosing MBP (n = 3 mice per group). J Gate strategy for microglia isolation at the Day 30 after BCAS via FACS. K, M CD68 expression intensity of isolated microglia in each group (n = 4 mice per group). Detailed gating strategy can be found in the Additional file 3: Fig. S3C. I, N Mertk expression intensity in CD68 + microglia in each group (n = 4 mice per group). All data were presented as the mean ± SEM. *p < 0.05, **p < 0.01, ***p < 0.005
Fig. 4
Fig. 4
PTX upregulated Mertk expression and promoted phagocytosis in primary microglia exposed to myelin debris. A Representative immunoblots probed with antibodies against Mertk and GAPDH at different time points after myelin stimulation. B Quantification of Mertk bands normalized to GAPDH (n = 3 repeats per group). C, D Primary microglia were treated with UNC2250 (100 nM) for 2 h, and then con-cultured with myelin debris (0.01 mg/ml) stained with DID for 0.5 h, primary microglia were collected and myelin debris signal intensity in microglia were conduct by FACS (n = 3 repeats per group). E, F Primary microglia were treated with vehicle or PTX (25 μM) for 2 h, and then incubated with myelin debris (0.01 mg/ml) for 0.5 h. Myelin debris signal intensity in microglia were detected by FACS (n ≥ 3 repeats per group). G Representative immunoblots probed with antibodies against Mertk and GAPDH. H Quantification of the levels of Mertk normalized to GAPDH (n = 3 repeats per group). All data were presented as the mean ± SEM. *p < 0.05, **p < 0.01, ****p < 0.001
Fig. 5
Fig. 5
PTX upregulated Mertk by stimulating PPAR-γ nuclear translocation in vivo and in vitro. A Primary microglia were incubated with GW9662 (10 μM) for 1 h, followed with myelin debris (0.01 mg/ml) with or without PTX (25 μM) for 6 h. Quantitative RT-PCR analysis of Mertk mRNA in primary microglia (n = 3 repeats per group). B Representative immunoblots probed with antibodies against PPAR-γ, GADPH and H3 in nucleus and in cytoplasm of BV2 cells. C, Quantification of PPAR-γ levels normalized to H3 in nucleus (n = 3 repeats per group). D Immunofluorescent images of Iba-1 (green)/PPAR-γ (red)/DAPI (blue) colocalization in IC at Day 30 after BCAS. White scale bar: 20 μm, blue scale bar: 4 μm. E, Quantification of immunofluorescent intensity of PPAR-γ in DAPI area. The values were normalized to those of the control group (n = 4 mice per group). All data were presented as the mean ± SEM. *p < 0.05, **p < 0.01, “ns” means no significance (p > 0.05)
Fig. 6
Fig. 6
PTX improved cognitive impairment and white matter integrity dependent on Mertk. The total moved distance (A), the percentage of time in the corner (B) and the percentage of time in the center (C) (n ≥ 10 mice per group) detected by open field test. D The exploratory preference to novel objects (n ≥ 9 mice per group) in the novel object recognition. E The percentage of spontaneous alternations in the Y-maze test (n ≥ 8 mice per group). F Representative images of myelin basic protein (green) in corpus callosum (CC) and Internal Capsule (IC) at Day 30 after BCAS. Scale bar: 100 μm. G, H Quantification of immunofluorescent intensity of MBP area in CC and IC (n = 3 mice per group). All data were presented as the mean ± SEM. *p < 0.05, **p < 0.01, “ns” means no significance (p > 0.05)

References

    1. Kalaria RN. The pathology and pathophysiology of vascular dementia. Neuropharmacology. 2018;134:226–239. - PubMed
    1. Iadecola C. The pathobiology of vascular dementia. Neuron. 2013;80(4):844–866. - PMC - PubMed
    1. Harrison DG, Guzik TJ. Macrophages come to mind as keys to cognitive decline. J Clin Invest. 2016;126(12):4393–4395. - PMC - PubMed
    1. Lee J, et al. Heterogeneity of microglia and their differential roles in white matter pathology. CNS Neurosci Ther. 2019;25(12):1290–1298. - PMC - PubMed
    1. McCarty MF, O'Keefe JH, DiNicolantonio JJ. Pentoxifylline for vascular health: a brief review of the literature. Open Heart. 2016;3(1):e000365. - PMC - PubMed

MeSH terms

Substances

LinkOut - more resources