. 2022 Sep;20(9):1807-1818.
doi: 10.1111/pbi.13865. Epub 2022 Jul 4.

Natural allelic variation of GmST05 controlling seed size and quality in soybean

Affiliations

Natural allelic variation of GmST05 controlling seed size and quality in soybean

Zongbiao Duan et al. Plant Biotechnol J. 2022 Sep.

Abstract

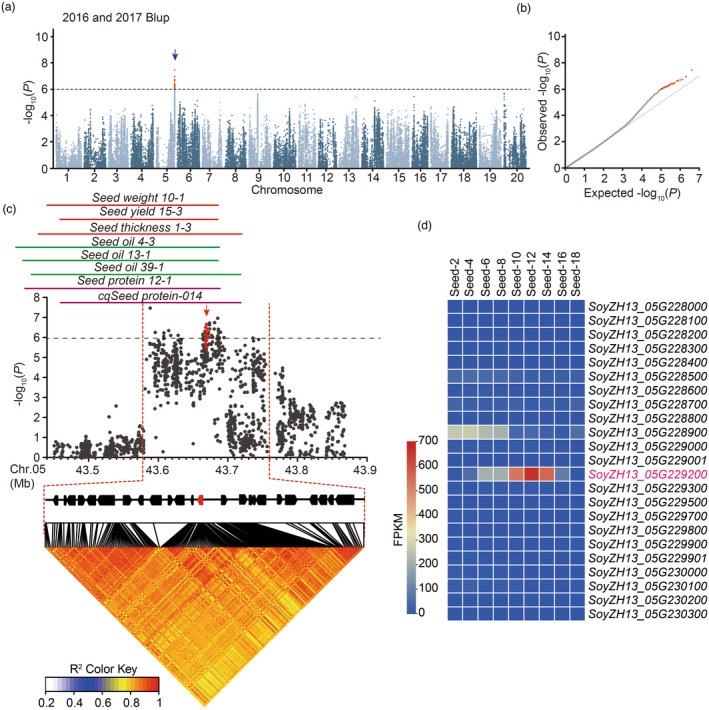
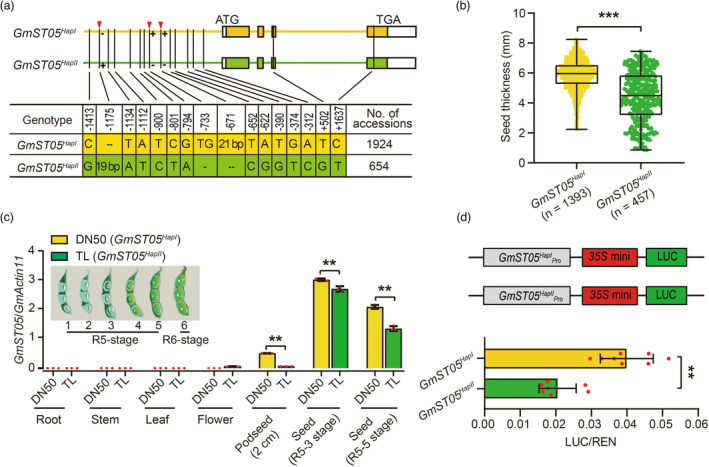
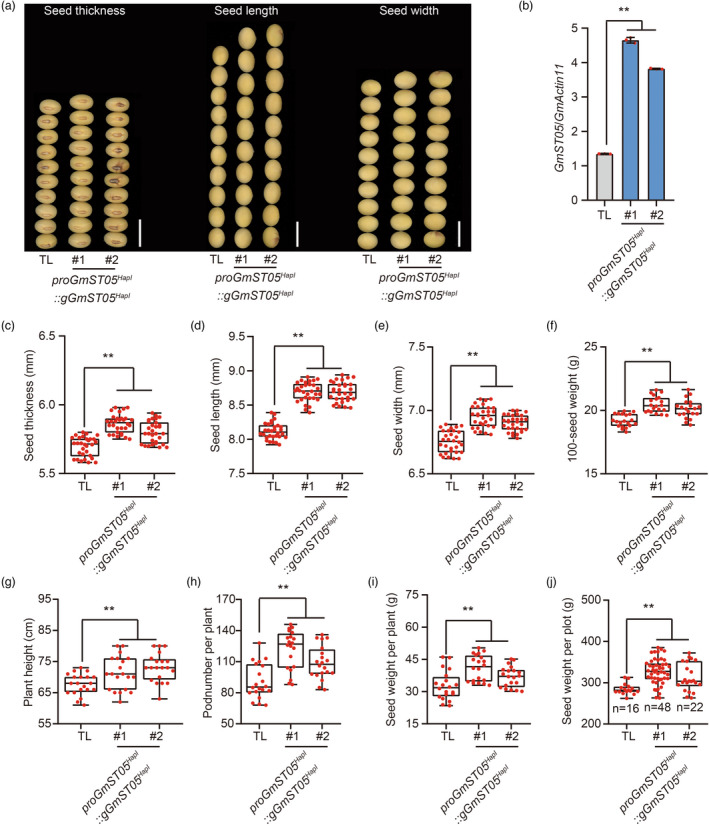
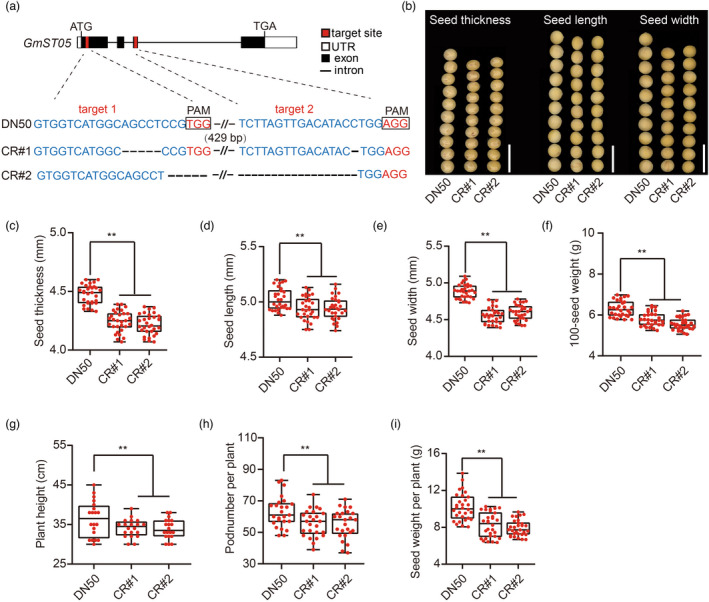
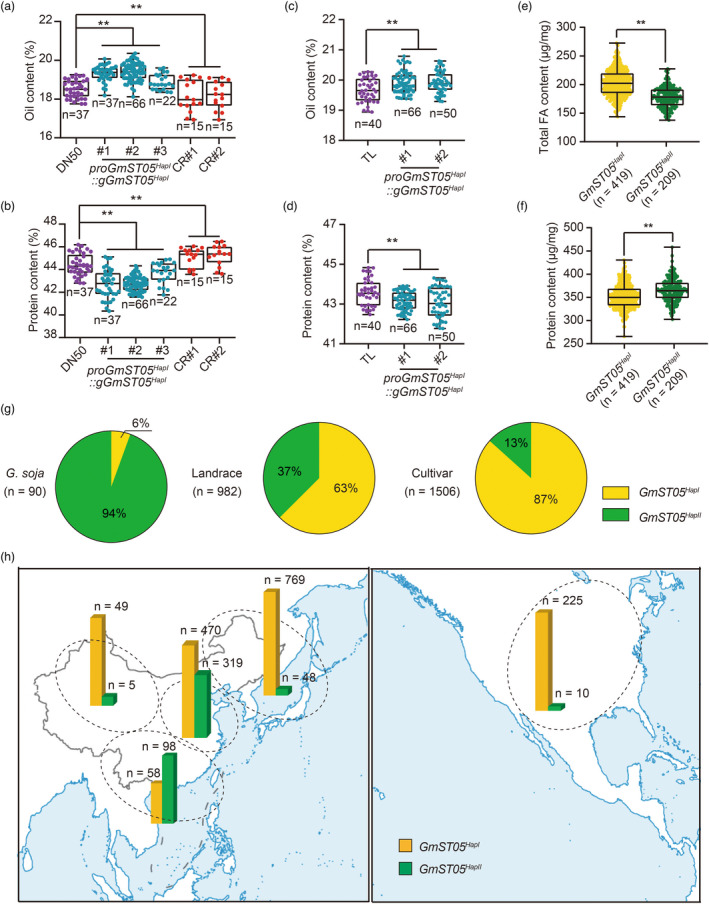
Seed size is one of the most important agronomic traits determining the yield of crops. Cloning the key genes controlling seed size and pyramiding their elite alleles will facilitate yield improvement. To date, few genes controlling seed size have been identified in soybean, a major crop that provides half of the plant oil and one quarter of the plant protein globally. Here, through a genome-wide association study of over 1800 soybean accessions, we determined that natural allelic variation at GmST05 (Seed Thickness 05) predominantly controlled seed thickness and size in soybean germplasm. Further analyses suggested that the two major haplotypes of GmST05 differed significantly at the transcriptional level. Transgenic experiments demonstrated that GmST05 positively regulated seed size and influenced oil and protein contents, possibly by regulating the transcription of GmSWEET10a. Population genetic diversity analysis suggested that allelic variations of GmST05 were selected during geographical differentiation but have not been fixed. In summary, natural variation in GmST05 determines transcription levels and influences seed size and quality in soybean, making it an important gene resource for soybean molecular breeding.

Keywords: GmST05; GWAS; natural allelic variation; oil and protein contents; seed size; soybean.


Conflict of interest statement

The authors declare no competing interests.

Figures

Figure 1
Figure 1
GWAS of seed thickness in the soybean germplasm. (a) Manhattan plot of GWAS results for seed thickness from 2016 and 2017 best linear unbiased prediction (BLUP) data. (b) Quantile–quantile plot of the GWAS results under a mixed linear model (MLM). (c) Local Manhattan plot (top) and linkage disequilibrium plot (bottom) for SNPs surrounding the peak on chromosome 5. The red dashed lines indicate the candidate region for the peak. The red plot indicates the nucleotide variation of GmST05. The solid lines above the plot represent the genomic locations of quantitative trait loci (QTLs) retrieved from SoyBase (https://soybase.org/). The red, green and orange lines are QTLs for seed size (yield), seed oil content and protein content, respectively. (d) A heat map for candidate genes located in the candidate region. The colour key (blue to red) represents gene expression (fragments per kilobase per million mapped reads, FPKM).
Figure 2
Figure 2
Two GmST05 haplotypes exhibiting differential expression levels. (a) Schematic representation of the two haplotypes of GmST05. (b) Comparison of seed thickness between two different haplotypes in 1853 soybean accessions. Each dot represents the seed thickness of an accession. All values represent the means ± SDs. Student's t test; *** P < 0.001. (c) qRT‐PCR results of GmST05 expression levels in various organs in DN50 and TL, which contained different haplotypes of GmST05. Values are means ± SDs (n = 3). Student's t test; ** P < 0.01. (d) Transient expression assays of the two GmST05 promoter types in Arabidopsis protoplasts. Values are means ± SDs (n = 8). Student's t test; ** P < 0.01.
Figure 3
Figure 3
Functional validation of GmST05 in controlling seed size. (a) Comparison of the seed thickness, seed length and seed width of Tianlong (TL, background GmST05 HapII ) and overexpression transgenic plants. Scale bars, 1 cm. (b) Expression levels of GmST05 in TL and overexpression transgenic plants. Total RNA was isolated from soybean seeds in the R5‐4 stage. Values are means ± SDs (n = 3). (c‐j) Statistical analysis of seed thickness (c), seed length (d), seed width (e), 100‐seed weight (f), plant height (g), pod number per plant (h), seed weight per plant (i) and seed weight per plot (j) of TL and overexpression transgenic plants. Values are means ± SDs (for g, h, and i, n = 20; for others, n = 30; one plot indicates 1 m2; Student's t test; ** P < 0.01).
Figure 4
Figure 4
Knockout of GmST05 using CRISPR‐Cas9. (a) Schematics illustrating sgRNA (red lines) targets in the GmST05 coding region. sgRNA targets are highlighted in red. Sequences of the CRISPR‐Cas9‐induced mutant site are shown. (b) Comparison of seed thickness, seed length and seed width between the DN50 and GmST05 HapI knockout lines. Scale bars, 1 cm. (c‐i). Statistical analysis of seed thickness (c), seed length (d), seed width (e), 100‐seed weight (f), plant height (g), pod number per plant (h) and seed weight per plant (i) of DN50 and GmST05 HapI knockout transgenic plants. Values are means ± SDs (for g, n = 20; for others, n = 30; Student's t test; ** P < 0.01).
Figure 5
Figure 5
Geographic differentiation of two GmST05 haplotypes and their effects on soybean protein and oil contents. (a‐d) Comparison of the oil content and protein content of mature seeds from DN50 (or Tianlong, TL), GmST05 HapI overexpression transgenic plants and GmST05 HapI knockout transgenic plants. Student's t test; ** P < 0.01. (e, f) Total fatty acid (FA) content and protein content from the accessions of different GmST05 haplotypes. (g) Haplotype frequency distribution of GmST05 in soybean germplasm. (h) The geographical distribution of GmST05 alleles (landraces and cultivars) in Asia and North America.

References

    1. Bai, X. , Huang, Y. , Hu, Y. , Liu, H. , Zhang, B. , Smaczniak, C. , Hu, G. et al. (2017) Duplication of an upstream silencer of FZP increases grain yield in rice. Nat. Plants, 3, 885–893. - PubMed
    1. Bednarek, J. , Boulaflous, A. , Girousse, C. , Ravel, C. , Tassy, C. , Barret, P. , Bouzidi, M.F. et al. (2012) Down‐regulation of the TaGW2 gene by RNA interference results in decreased grain size and weight in wheat. J. Exp. Bot. 63, 5945–5955. - PubMed
    1. Bodirsky, B.L. , Rolinski, S. , Biewald, A. , Weindl, I. , Popp, A. and Lotze‐Campen, H. (2015) Global food demand scenarios for the 21st century. PLoS One, 10, e0139201. - PMC - PubMed
    1. Bradley, D. , Ratcliffe, O. , Vincent, C. , Carpenter, R. and Coen, E. (1997) Inflorescence commitment and architecture in Arabidopsis . Science, 275, 80–83. - PubMed
    1. Brummer, E. , Graef, G. , Orf, J. , Wilcox, J. and Shoemaker, R. (1997) Mapping QTL for seed protein and oil content in eight soybean populations. Crop. Sci. 37, 370–378.

Publication types

LinkOut - more resources