. 2022 Oct;94(10):4704-4711.
doi: 10.1002/jmv.27898. Epub 2022 Jun 8.

Performance of nasopharyngeal swab and saliva in detecting Delta and Omicron SARS-CoV-2 variants

Affiliations

Performance of nasopharyngeal swab and saliva in detecting Delta and Omicron SARS-CoV-2 variants

Tina Uršič et al. J Med Virol. 2022 Oct.

Abstract

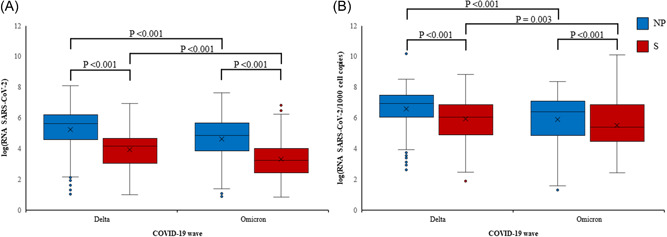
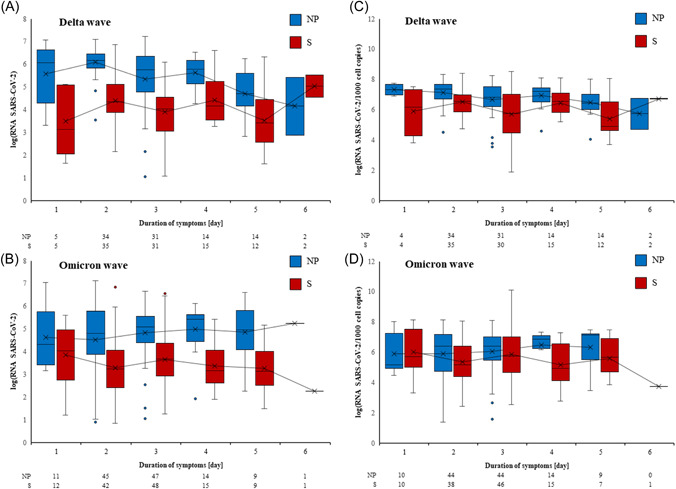
A prospective cohort study was conducted during the Delta and Omicron severe acute respiratory syndrome coronavirus type 2 (SARS-CoV-2) epidemic waves from paired nasopharyngeal swab (NPS or NP swab) and saliva samples taken from 624 participants. The study aimed to assess if any differences among participants from both waves could be observed and if any difference in molecular diagnostic performance could be observed among the two sample types. Samples were transported immediately to the laboratory to ensure the highest possible sample quality without any freezing and thawing steps before processing. Nucleic acids from saliva and NPS were prospectively extracted and SARS-CoV-2 was detected using a real-time reverse-transcription polymerase chain reaction. All observed results were statistically analyzed. Although the results obtained with NP and saliva agreed overall, higher viral loads were observed in NP swabs regardless of the day of specimen collection in both SARS-CoV-2 epidemic waves. No significant difference could be observed between the two epidemic waves characterized by Delta or Omicron SARS-CoV-2. To note, Delta infection resulted in higher viral loads both in NP and saliva and more symptoms, including rhinorrhea, cough, and dyspnea, whereas Omicron wave patients more frequently reported sore throat. An increase in the mean log RNA of SARS-CoV-2 was observed with the number of expressed symptoms in both waves, however, the difference was not significant. Data confirmed that results from saliva were concordant with those from NP swabs, although saliva proved to be a challenging sample with frequent inhibitions that required substantial retesting.

Keywords: COVID-19; SARS-CoV-2 diagnostics; nasopharyngeal swab; real-time RT-PCR; saliva.


Conflict of interest statement

The authors declare no conflict of interest.

Figures

FIGURE 1
FIGURE 1
Comparison of viral loads in nasopharyngeal (NP) swabs (blue) and saliva (S) samples (red) between Delta and Omicron waves. Non‐normalized (A) and normalized (B) viral loads are presented as log10 (SARS‐CoV‐2 RNA copies/µl) or as log10 (SARS‐CoV‐2 RNA copies/1000 cell copies), respectively. The box represents the first and third quartile, the line in the box, the median, the cross, the mean value, and the whiskers, the minimal and maximal value, excluding outliers that are presented as individual dots. Outliers are defined as values that deviate >1.5 times the interquartile range from the box limits. Statistical significance for individual comparisons is shown as p‐values. SARS‐CoV‐2, severe acute respiratory syndrome coronavirus 2.
FIGURE 2
FIGURE 2
Viral loads at respective days after symptom onset in Delta (A and C) and Omicron (B and D) wave patients. Nasopharynx (nasopharyngeal, NP) samples are presented in blue and saliva (S) samples in red. Non‐normalized (A and B) and normalized (C and D) viral loads are presented as log10 (SARS‐CoV‐2 RNA copies/µl) or as log10 (SARS‐CoV‐2 RNA copies/1000 cell copies), respectively. The box represents the first and third quartile, the line in the box the median, the cross the mean value, and the whiskers the minimal and maximal value, excluding outliers that are presented as individual dots. Outliers are defined as values that deviate >1.5 times the interquartile range from the box limits. A trend line connects the means of viral loads across days of symptom duration. The number of participants on respective days after symptom onset included in calculations is presented below each graph. SARS‐CoV‐2, severe acute respiratory syndrome coronavirus 2.

Similar articles

Cited by

References

    1. Tang YW, Schmitz JE, Persing DH, Stratton CW. Laboratory diagnosis of COVID‐19: current issues and challenges. J Clin Microbiol. 2020;58(6):e00512. - PMC - PubMed
    1. Miller EW, Lamberson CM, Akabari RR, et al. Development and validation of two quantitative RT‐PCR diagnostic assays for detecting severe acute respiratory syndrome coronavirus 2 genomic targets across two specimen types. J Mol Diagn. 2022;24:294‐308. - PMC - PubMed
    1. Ravi N, Cortade DL, Ng E, Wang SX. Diagnostics for SARS‐CoV‐2 detection: a comprehensive review of the FDA‐EUA COVID‐19 testing landscape. Biosens Bioelectron. 2020;165:112454. - PMC - PubMed
    1. Loeffelholz MJ, Tang YW. Laboratory diagnosis of emerging human coronavirus infections—the state of the art. Emerg Microbes Infect. 2020;9(1):747‐756. - PMC - PubMed
    1. Poljak M, Korva M, Knap Gašper N, et al. Clinical evaluation of the cobas SARS‐CoV‐2 test and a diagnostic platform switch during 48 hours in the midst of the COVID‐19 pandemic. J Clin Microbiol. 2020;58(6):e00599. - PMC - PubMed

Publication types

Supplementary concepts