. 2022 Jul;28(7):1355-1365.
doi: 10.3201/eid2807.220033. Epub 2022 May 31.

Analyzing and Modeling the Spread of SARS-CoV-2 Omicron Lineages BA.1 and BA.2, France, September 2021-February 2022

Analyzing and Modeling the Spread of SARS-CoV-2 Omicron Lineages BA.1 and BA.2, France, September 2021-February 2022

Mircea T Sofonea et al. Emerg Infect Dis. 2022 Jul.

Abstract

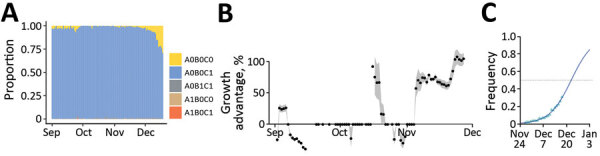
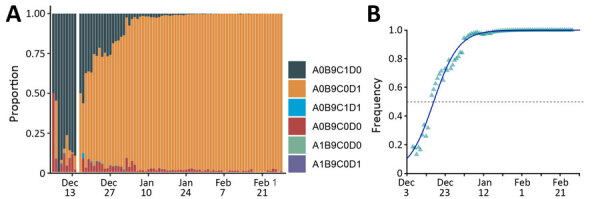
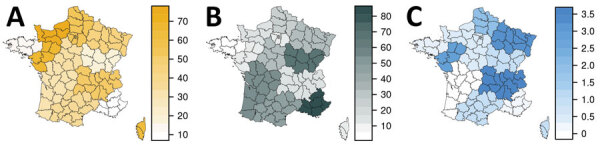
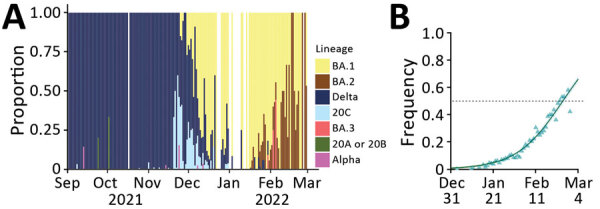
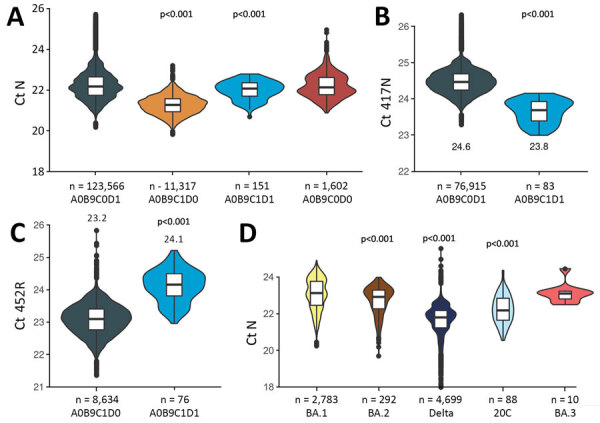
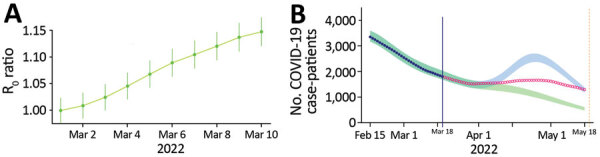
We analyzed 324,734 SARS-CoV-2 variant screening tests from France enriched with 16,973 whole-genome sequences sampled during September 1, 2021-February 28, 2022. Results showed the estimated growth advantage of the Omicron variant over the Delta variant to be 105% (95% CI 96%-114%) and that of the BA.2 lineage over the BA.1 lineage to be 49% (95% CI 44%-52%). Quantitative PCR cycle threshold values were consistent with an increased ability of Omicron to generate breakthrough infections. Epidemiologic modeling shows that, in spite of its decreased virulence, the Omicron variant can generate important critical COVID-19 activity in hospitals in France. The magnitude of the BA.2 wave in hospitals depends on the level of relaxing of control measures but remains lower than that of BA.1 in median scenarios.

Keywords: BA.1; BA.2; COVID-19; France; Omicron; PCR; SARS-CoV-2; coronavirus disease; epidemiology; genomics; mass screening; mutation; respiratory infections; severe acute respiratory syndrome coronavirus 2; vaccine-preventable diseases; variants; viruses; zoonoses.


Figures

Figure 8
Figure 8
Growth Advantage Calculation Equation
Figure 1
Figure 1
Epidemiologic modeling of the SARS-CoV-2 Omicron BA.2 wave dynamics, France. Simplified flowchart of the Covidsim framework. Persons can move between several compartments in the general population (in yellow or pink depending on the infection status), in CCUs in blue and removed from the system, either because of their immunity to BA.2 or of death (in gray). Part of the general population is vaccinated (green dashed line), which affects epidemiologic dynamics in 3 ways (illustrated with the shields), namely reduced infectivity, reduced virulence, and reduced risk for infection. CCU, critical care unit.
Figure 2
Figure 2
Monitoring and quantifying variant spread in using SARS-CoV-2 variant-specific screening tests (N = 103,757), France, October 1–December 18, 2021. A) Raw proportion of the test outcomes. B) Growth advantage of A0B0C0 tests over A0B0C1 in France. Points indicate the median growth advantage estimated on a 21-day sliding window; the gray shading indicates 95% CI. C) Estimated frequency and growth advantage of A0B0C0 relative to the sum of A0B0C0 and A0B0C1 tests in France, corresponding to the last point of panel A. Triangles show the fitted values from the model, the line the model output, and the gray shading the 95% CI. Raw occurrence data from panel A is stratified by region in Appendix 1 Figure 1. Test designations indicate the absence of a mutation by a 0 and its presence by 1; the mutations are S:484K (A), S:E484Q (B), and S:452R (C); A0B0C1 mostly corresponds to Delta variant, A0B0C0 to Alpha or Omicron variant or an ancestral lineage, A0B1C1 to Kappa or Kappa-like variants, A1B0C0 to Beta or the Gamma variant, and A1B0C1 to a Delta variant with an E484K mutation.
Figure 3
Figure 3
Monitoring and quantifying variant spread using ID Solutions Revolution tests (N = 193,256), France, December 6, 2021–February 28, 2022. A) Raw proportion of the test outcomes. B) Estimated frequency of A0B9C0D1 relative to the sum of A0B9C0D1 and A0B9C1D0 tests in France. Raw occurrence data from panel A is stratified by region in Appendix 1 Figure ). Test designations indicate the absence of a mutation by a 0 and its presence by 1 (9 means the mutation was not tested); mutations are the same as in Figure 2 and D is S:417N; A0B9C0D1 mostly corresponds to Omicron variant, A0B9C1D0 to Delta variant and A0B9C1D1 to Omicron-Delta coinfection.
Figure 4
Figure 4
Frequency of A0B9C0D1 (A), A0B9C1D0 (B), and A0B9C1D1 (C) SARS-CoV-2 variant test results in mainland regions of France during week 51 of 2021. The colors show the prevalences (in percentages), which are corrected for covariates (age and sampling context). Includes 7,166 tests of the tests shown in Figure 3 but performed December 20–26, 2021. Test designation is the same as in Figure 3.
Figure 5
Figure 5
Monitoring and quantifying SARS-CoV-2 variant spread using whole-genome sequencing, France. A) Raw proportion of SARS-CoV-2 lineages inferred from whole-genome sequences of 16,973 samples. B) Estimated proportion and growth advantage of the BA.2 variant with respect to the BA.1 variant. Raw occurrence data from panel A is stratified by region in Appendix 1 Figure).
Figure 6
Figure 6
Ct values from the SARS-CoV-2 variant-specific screening quantitative PCR tests (N = 136,636), France, December 6, 2021–February 28, 2022. Ct values refer to the control (nucleoprotein) gene (A and D), 417N mutation (B), and 452R mutation (C). Values are shown as a function of the test outcome (A, B, and C) or the virus lineage (D). P values derived from a t-test where the reference variable is either A0B9C0D1 or BA.1. Boxes within violin plots show the median (horizontal line within box), 50% (box tops and bottoms), and 95% CIs (error bars). Tests were the same as in Figure 3, but only screening tests with Ct <28 were included to ensure robust screening results. Ct, cycle threshold; N, nucleoprotein gene.
Figure 7
Figure 7
Analyzing and modeling the SARS-CoV-2 Omicron BA.2 epidemic wave in France. A) Ratio between the predicted and observed reproduction number (R0) based on BA.2 frequency and growth advantage. B) National critical care bed occupancy in 2 scenarios depending on baseline transmission increase. CIs are calculated from that of the frequency and growth advantage of BA.2 (Figure 5, panel B). The vertical blue line indicates the day the model was performed, the dark blue dots the data, and the shaded areas the 95% range of the model simulations. The 2 scenarios differ according to the capping of the increase of the baseline transmission rate, mimicking either a limited (green) or a strong (blue) easing preventive measures in March 2022 in France. Red open circles indicate data collected after the scenarios were modeled (i.e., not used in the inference or the modeling). The vertical yellow line indicated the last day the data were collected for the figure. Appendix 1 further details model.

Similar articles

Cited by

References

    1. Viana R, Moyo S, Amoako DG, Tegally H, Scheepers C, Althaus CL, et al. Rapid epidemic expansion of the SARS-CoV-2 Omicron variant in southern Africa. Nature. 2022;603:679–86. 10.1038/s41586-022-04411-y - DOI - PMC - PubMed
    1. Planas D, Saunders N, Maes P, Guivel-Benhassine F, Planchais C, Buchrieser J, et al. Considerable escape of SARS-CoV-2 Omicron to antibody neutralization. Nature. 2022;602:671–5. 10.1038/s41586-021-04389-z - DOI - PubMed
    1. Takashita E, Kinoshita N, Yamayoshi S, Sakai-Tagawa Y, Fujisaki S, Ito M, et al. Efficacy of antibodies and antiviral drugs against Covid-19 Omicron variant. N Engl J Med. 2022;386:995–8. 10.1056/NEJMc2119407 - DOI - PMC - PubMed
    1. WHO Collaborating Centre for Infectious Disease Modelling, MRC Centre for Global Infectious Disease Analysis, Jameel Institute, Imperial College London. Report 50: hospitalisation risk for Omicron cases in England. 2021. Dec 21 [cited 2022 May 6]. https://www.imperial.ac.uk/medicine/departments/school-public-health/inf...
    1. Maslo C, Friedland R, Toubkin M, Laubscher A, Akaloo T, Kama B. Characteristics and outcomes of hospitalized patients in South Africa during the COVID-19 Omicron wave compared with previous waves. JAMA. 2022;327:583–4. 10.1001/jama.2021.24868 - DOI - PMC - PubMed

Publication types

Supplementary concepts