

Malaria parasites release vesicle subpopulations with signatures of different destinations
- PMID: 35642585
- PMCID: PMC9253735
- DOI: 10.15252/embr.202254755
Malaria parasites release vesicle subpopulations with signatures of different destinations
Abstract
Malaria is the most serious mosquito-borne parasitic disease, caused mainly by the intracellular parasite Plasmodium falciparum. The parasite invades human red blood cells and releases extracellular vesicles (EVs) to alter its host responses. It becomes clear that EVs are generally composed of sub-populations. Seeking to identify EV subpopulations, we subject malaria-derived EVs to size-separation analysis, using asymmetric flow field-flow fractionation. Multi-technique analysis reveals surprising characteristics: we identify two distinct EV subpopulations differing in size and protein content. Small EVs are enriched in complement-system proteins and large EVs in proteasome subunits. We then measure the membrane fusion abilities of each subpopulation with three types of host cellular membranes: plasma, late and early endosome. Remarkably, small EVs fuse to early endosome liposomes at significantly greater levels than large EVs. Atomic force microscope imaging combined with machine-learning methods further emphasizes the difference in biophysical properties between the two subpopulations. These results shed light on the sophisticated mechanism by which malaria parasites utilize EV subpopulations as a communication tool to target different cellular destinations or host systems.
Keywords: AFM; asymmetric flow field-flow fractionation; extracellular vesicles; malaria; membrane fusion.
© 2022 The Authors. Published under the terms of the CC BY NC ND 4.0 license.
Figures
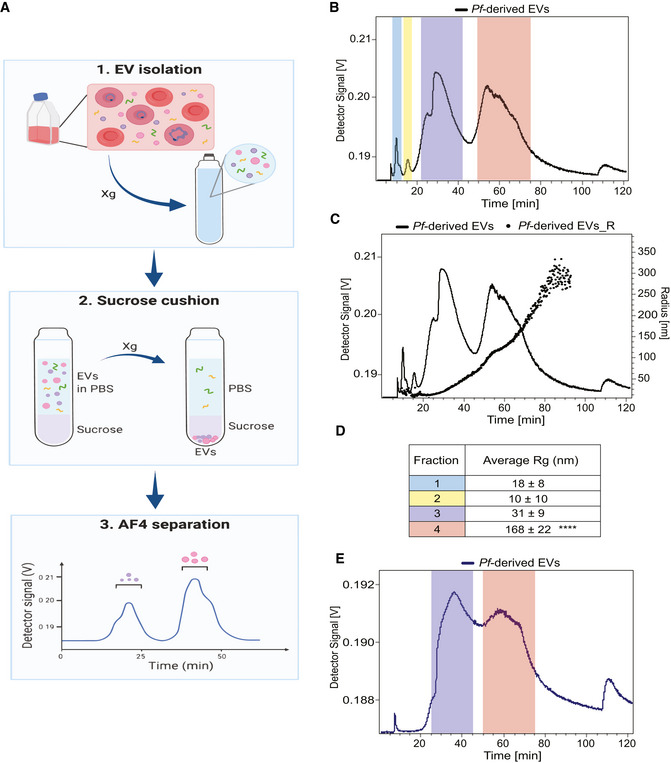
Illustration demonstrating the workflow of an AF4 separation. The xg refers to centrifugation at 150,000 g or 100,000 g.
Graph shows the four peaks collected from Pf‐derived EVs (continuous black line) post AF4 separation. Fractions 1 and 2 were collected from 9 to 12.5 and from 13 to 17.5 min respectively, fraction 3 from 25 to 45 and fraction 4 from 50 to 75 min.
Representative overlay profile from (B) with the radius of gyration (Rg) of the Pf‐derived EVs, latter displayed as dots.
Table summarizing the average size distribution and standard deviation of the four peaks based on their Rg for three separate biological replicates. The F4‐EV Rg is significantly larger than the others (2‐way ANOVA, accounting for batch effect followed by Tukey's post hoc test; p (4‐3) = 0.0000923, p (4‐2) = 0.0000405 and p (4‐1) = 0.0000558), ****P < 0.0001.
Continuous blue trace shows the two peaks collected from Pf‐derived EVs post sucrose cushion for further analysis. Color‐coding as in (B) and (D) above. These results are a representative sample taken from one of three independent biological repeats.
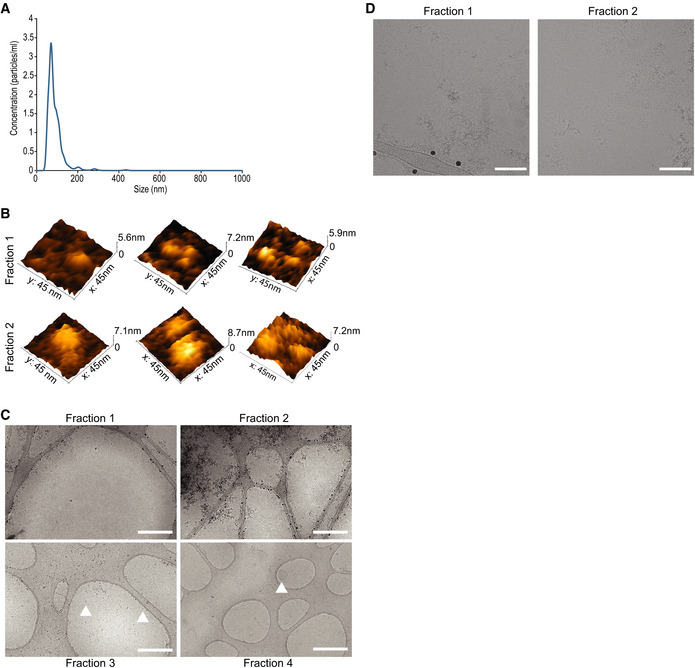
Nanotrack particle analysis (NTA) of the input Pf‐derived EVs. Assessment of total Pf‐derived EVs using NanoSight® particle analyzer detecting particles in a diameter mode of 70 nm. The concentration is approximately 1012 particles/ml. This experiment is representative of three biological replicates.
Representative 3D AFM images of particles from fractions 1 and 2.
Representative cryo‐TEM images at low magnification of fractions 1–4 to illustrate sample purity and isolation of extracellular proteins (fractions 1 and 2) from extracellular vesicles (fractions 3 and 4). Scale bar—500 nm. Arrowheads indicate EVs.
Cryo‐TEM images of fractions 1 and 2 highlighting bio‐molecular aggregates. Scale bar—100 nm.
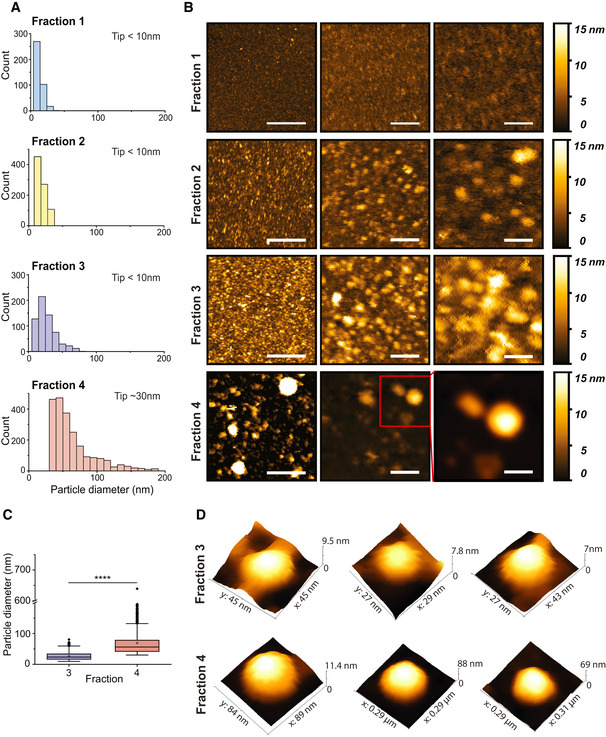
Distributions of EV sizes in fractions 1–4 measured from AFM images. Size distributions were quantified combining three separate biological replicates, for a total of fraction 1 n = 391, fraction 2 n = 853, fraction 3 n = 623 and fraction 4 n = 2251.
Representative AFM images for each fraction at different magnifications. Scale bars are (left to right)—400, 100 and 50 nm.
EV size analysis results for fractions 3 and 4 presented as box plots. The black dots represent outliers and the black horizontal line represents the median, the black diamonds represent outliers, boxes represent 25–75% of the data and the lines inside the boxes are the medians. Minimum and maximum values are indicated by the whiskers. F4‐EV values were larger than F3‐EVs (t‐test on log‐transformed values; t 978 = 42.3, P = 2.2e−16; effect size: Cohen's D = 1.94). ****P < 0.0001.
Representative AFM 3D images of single EVs for each fraction.
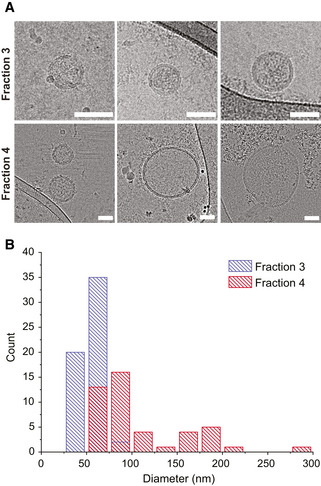
Representative cryo‐TEM micrographs for fraction 3 (top row) and fraction 4 (bottom row) for Pf‐derived EVs post AF4 fractionation. Both subpopulations display a clear vesicular structure with a visible 4 nm bilayer. Fraction 3 shows a typical smaller diameter in the 30–70 nm range, whereas fraction 4 displays a much broader size, ranging from 70 to 300 nm. Scale bar—50 nm.
Diameter distribution of both fractions measured from cryo‐TEM images of the two EV subpopulations. Fraction 3 (red bars), consistent with representative images, has a narrow distribution centered at 50 nm. Fraction 4 (blue bars), presents a broader size distribution with two putative peaks, centered at 70 and 170 nm, respectively. The two subpopulations display a size overlap in the 75 nm range. Size distributions were quantified from three separate biological replicates of the two subpopulations, for a total of n = 57 vesicles for fraction 3 and n = 45 vesicles for fraction 4, with at least 7 vesicles for each biological repeat. Data presented as count distributions with a 25 nm bin size.
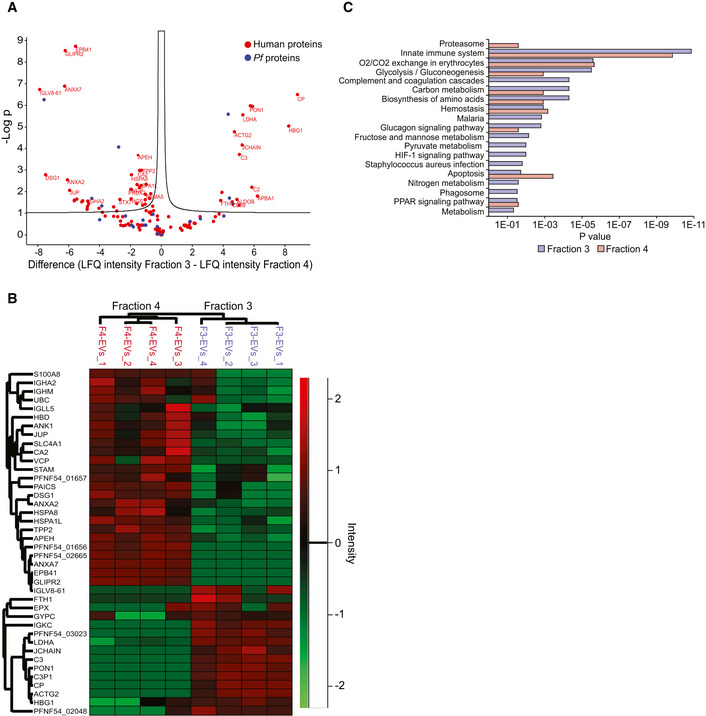
Volcano Plot of differentially expressed EV proteins between F3‐EVs and F4‐EVs. The Volcano Plot presents significant results of a t‐test with permutation‐based FDR calculation by Log2 fold change (difference) and significance (−Log P) using the Perseus software.
Euclidean heat map diagram presenting an unsupervised hierarchical clustering of the different EV groups. The clustering was based on the intensities of the identified proteins and was generated by the Perseus software—a zoom on the differential proteins is presented.
Pathway analysis of the two EV fractions based on STRING. Quantification and averaging of four independent biological replicates. Reference list: Homo sapiens or Plasmodium falciparum (all genes in the database).
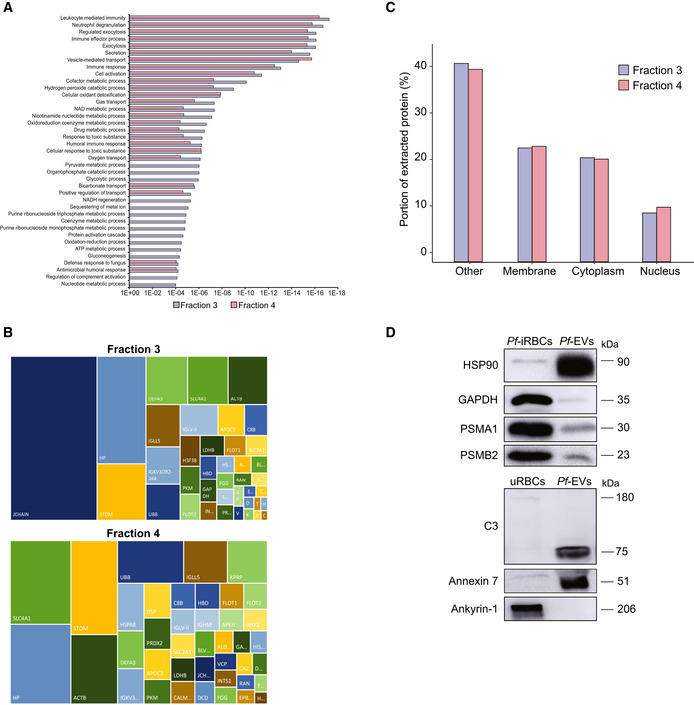
GO annotation analysis of the two EV fractions.
The figure presents the most intense proteins in the EV repertoire (not including the HBB and HBA dominant proteins). The rectangular areas are proportional to the median intensity of the protein in either F3 or F4 EVs.
Subcellular localization of identified proteins by GO annotation. Other—mitochondria, early and late endosome, lysosome, cytoskeleton, secreted, and so on. Quantification and averaging of four independent biological replicates. Reference list: Homo sapiens or Plasmodium falciparum (all genes in the database).
Western blot analysis of uRBCs or iRBCs and Pf‐derived EVs. Anti‐PSMA1, anti‐PSMB2 (proteasome subunits) and anti‐C3 (complement system protein) antibodies were used. As a positive control, antibodies against the EV markers HSP90 and Annexin 7 were used. C3b subunit is detected within Pf‐derived EVs. As a negative control, antibodies against the RBC membrane marker Ankyrin‐1 were used.
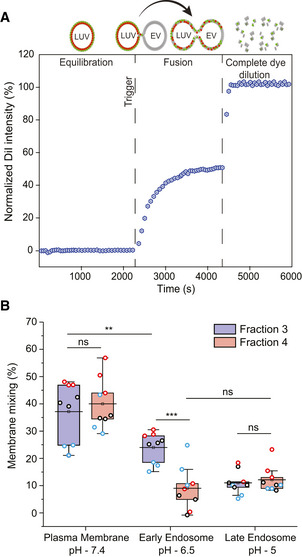
A schematic diagram illustrating the principle of the FRET‐based two‐color dye for detection of fusion between EVs and LUVs.
Box plot of membrane mixing assay between LUVs mimicking the plasma membrane, early endosome and late endosome lipid composition and between F3‐EVs and F4‐EVs. Three independent biological experiments were performed. Each dot represents one data point, with the whole dataset obtained from n = 3 biological repeats (colored symbols) with three technical repeats each. Box layouts represent 25–75% of the distribution, whiskers highlight outlier's data points, and horizontal black lines represent the mean of the distribution. For all three conditions, a two‐sample t‐test was employed, with a significance value of 0.05. Plasma membrane and late endosomal conditions show no difference between fractions 3 and 4 (P = 0.55 and P = 0.60, respectively). Plasma membrane and early endosome show a significant difference for F3‐EVs (P = 0.0049). Early endosomal conditions show fraction 3 to fuse significantly more than F4‐EVs (P = 0.00026). For F4‐EVs, early and late endosomes show no difference in fusion (P = 0.32). **P ≤ 0.01, ***P < 0.001.
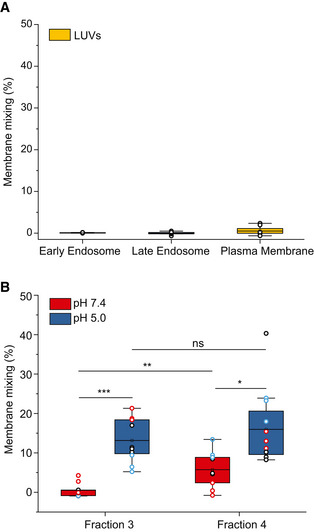
FRET‐based membrane mixing for LUVs–LUVs interaction (negative control) under the three tested conditions (plasma membrane, early endosome and late endosomes). No significant fusion is observed. Each dot represents one data point, with the whole dataset obtained from n = 3 biological repeats (colored symbols) with three technical repeats each. Box layouts represent 25–75% of the distribution, whiskers highlight outlier' data points, and horizontal black lines represent the mean of the distribution.
Comparison of membrane mixing between F3‐EVs and F4‐EVs at late endosomal conditions (pH 5.0, blue) and interaction with the same liposomes at neutral pH (red). Significant membrane mixing is observed post acidification for F3‐EVs (P = 0.0009) and F4‐EVs (P = 0.017). A significant difference in membrane mixing between the two fractions is observed at pH 7.4 (P = 0.006). No significant difference in membrane mixing between the two fractions is observed at pH 5 (P = 0.375). Three independent experiments were performed and a two‐sample t‐test was applied. Each dot represents one data point, with the whole dataset obtained from n = 3 biological repeats (colored symbols) with three technical repeats each. Box layouts represent 25–75 percentiles of the distribution, whiskers highlight outlier' data points and horizontal black lines represent the mean of the distribution. *P ≤ 0.05, *P ≤ 0.01, ***P < 0.001.
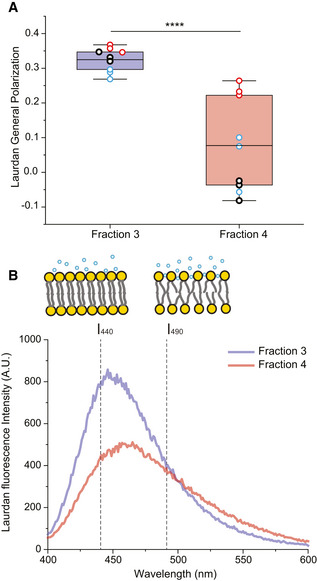
Laurdan general polarization (GP) values obtained for F3‐EVs and F4‐EVs at physiological temperature showing higher membrane order (higher GP values) for F3‐EVs than F4‐EVs (P = 0.00007). Each dot represents one data point, with the whole dataset obtained from n = 3 biological repeats (colored symbols) with three technical repeats each. Box layouts represent 25–75 percentiles of the distribution, whiskers highlight outlier's data points and horizontal black lines represent the mean of the distribution. ****P < 0.0001.
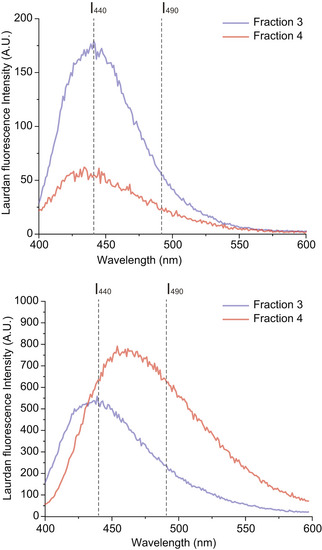
Characteristic Laurdan spectra for F3‐EVs and F4‐EVs, showing a predominant peak at 440 nm for F3‐EVs, indicating a high lipid packing, and a shift toward 490 nm emission for F4‐EVs. The illustration shows differences in membrane packing measured by Laurdan according to the two emission peaks.
- A, B
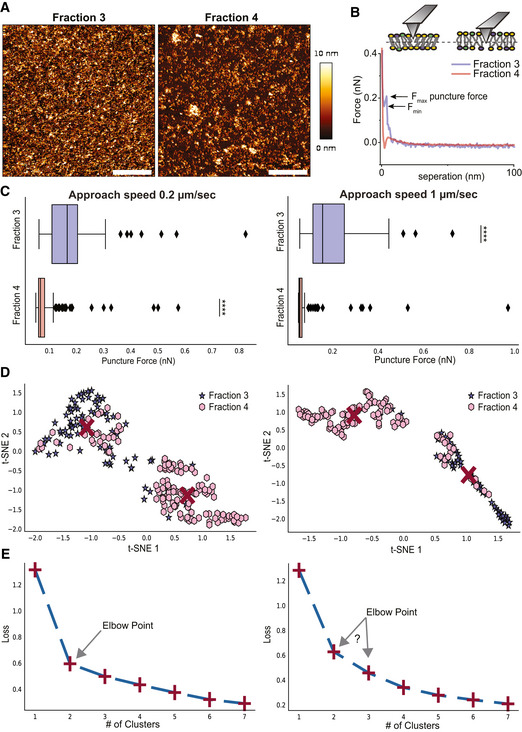
(A) Representative images (scale bar—1 µm) and (B) force‐separation curves for supported lipid bilayer of F3‐EVs and F4‐EVs. F max and F min are defined on the curve of F3‐EVs.
- C
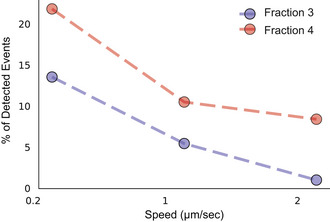
Statistics of puncture forces for the two fractions at two different approach speeds presented as box plots, and tested with Mann–Whitney statistical analysis (Mann & Whitney, 1947) accounting for skewed distribution, P‐values are < 10−19 for the 0.2 μm/s approach speed (n = 81 for F3‐EVs and 131 for F4‐EVs) and < 10−14 for 1 μm/s (n = 49 events for fraction 3 and 105 for fraction 4). The black diamonds represent outliers, boxes represent 25–75% of the data and the lines inside the boxes are the medians. Minimum and maximum values are indicated by the whiskers. ****P < 0.0001.
- D, E
Unsupervised machine learning grouping of features engineered from the puncture data features by t‐distributed stochastic neighbor embedding analysis (t‐SNE) and K‐means. (D) In the t‐SNE analysis, two clusters are found at each speed which is predominantly F3‐EVs (purple) or F4‐EVs (pink). Red crosses are the centers of the clusters determined by K‐means. (E) K‐means loss function for the analysis shown in (D), displaying loss function as a function of a number of clusters, shown as the red + symbols, with a dashed line added to guide the eye. The Elbow point indicates the most probable number of clusters that best represent the data. The results presented are a representative set taken from three independent biological repetitions. All independent repetitions gave similar results.
References
-
- Alexander RP, Chiou N‐T, Ansel KM (2016) Improved exosome isolation by sucrose gradient fractionation of ultracentrifuged crude exosome pellets. Protocol Exchange 1–4 10.1038/protex.2016.057 - DOI
-
- Avalos‐Padilla Y, Georgiev VN, Lantero E, Pujals S, Verhoef R, Borgheti‐Cardoso LN, Albertazzi L, Dimova R, Fernàndez‐Busquets X (2021) The ESCRT‐III machinery participates in the production of extracellular vesicles and protein export during Plasmodium falciparum infection. PLoS Pathog 17: 1–24 - PMC - PubMed
Publication types
MeSH terms
LinkOut - more resources
Full Text Sources
Medical
Miscellaneous
