. 2022 Oct 1;43(14):4475-4491.
doi: 10.1002/hbm.25967. Epub 2022 Jun 1.

Predicting time-resolved electrophysiological brain networks from structural eigenmodes

Affiliations

Predicting time-resolved electrophysiological brain networks from structural eigenmodes

Prejaas Tewarie et al. Hum Brain Mapp. .

Abstract

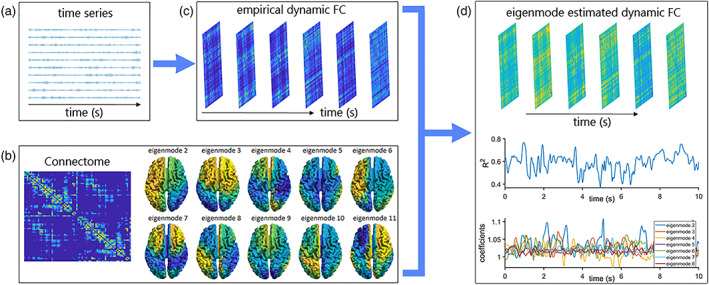
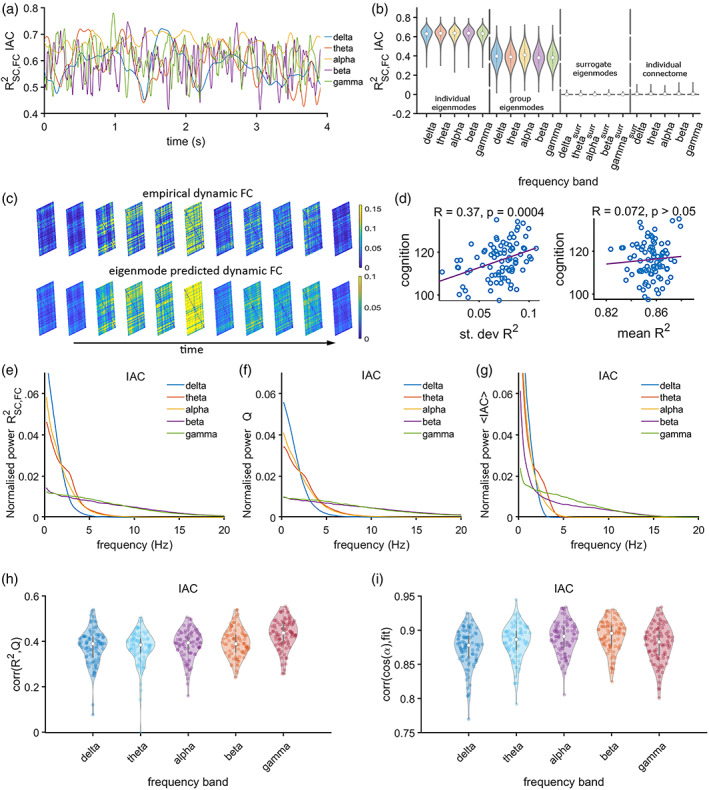
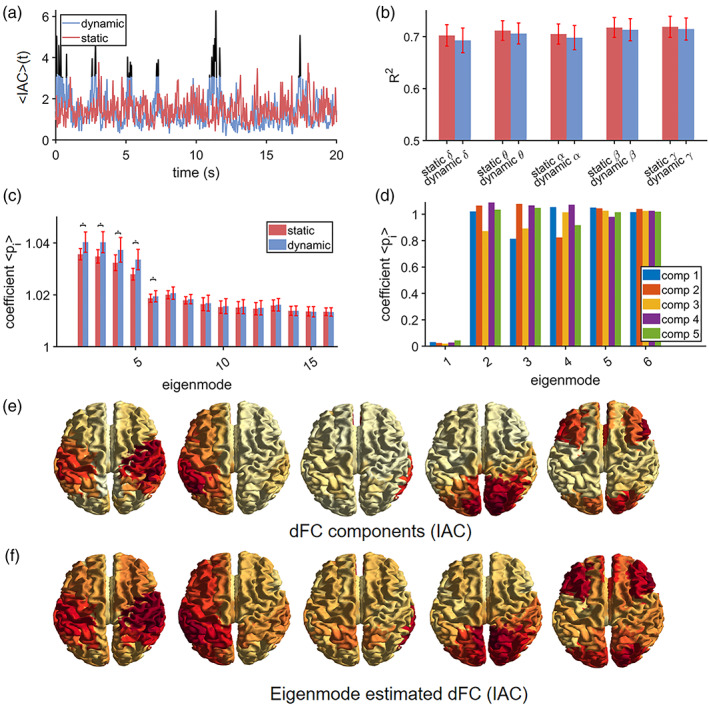
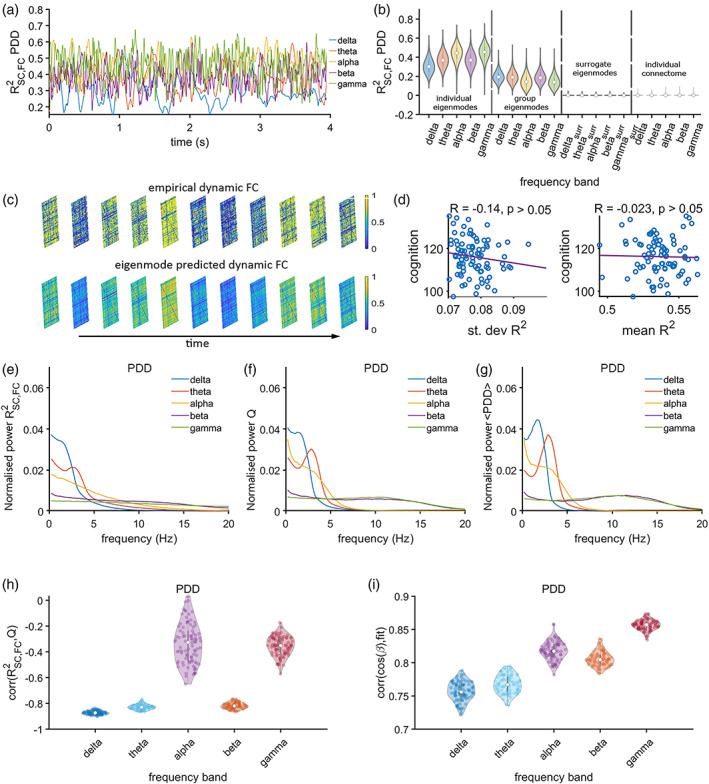
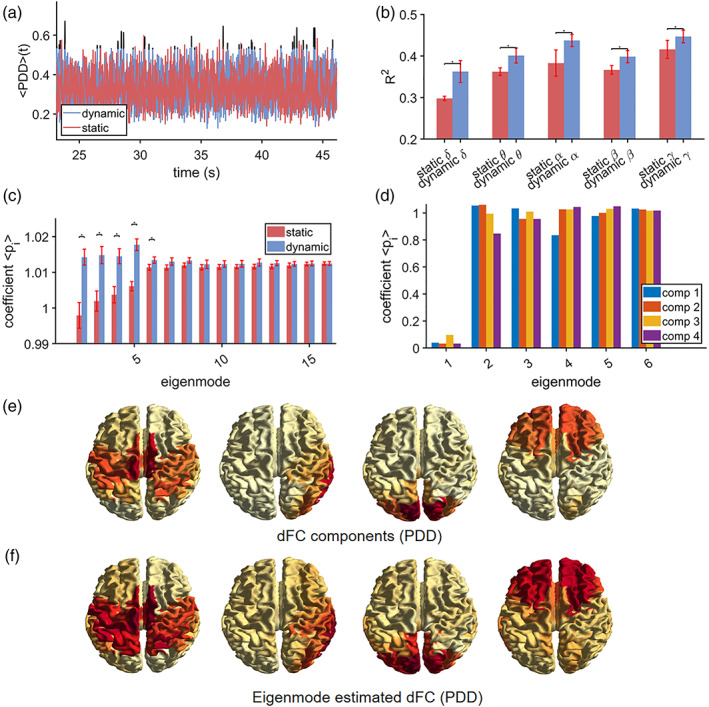
How temporal modulations in functional interactions are shaped by the underlying anatomical connections remains an open question. Here, we analyse the role of structural eigenmodes, in the formation and dissolution of temporally evolving functional brain networks using resting-state magnetoencephalography and diffusion magnetic resonance imaging data at the individual subject level. Our results show that even at short timescales, phase and amplitude connectivity can partly be expressed by structural eigenmodes, but hardly by direct structural connections. Albeit a stronger relationship was found between structural eigenmodes and time-resolved amplitude connectivity. Time-resolved connectivity for both phase and amplitude was mostly characterised by a stationary process, superimposed with very brief periods that showed deviations from this stationary process. For these brief periods, dynamic network states were extracted that showed different expressions of eigenmodes. Furthermore, the eigenmode expression was related to overall cognitive performance and co-occurred with fluctuations in community structure of functional networks. These results implicate that ongoing time-resolved resting-state networks, even at short timescales, can to some extent be understood in terms of activation and deactivation of structural eigenmodes and that these eigenmodes play a role in the dynamic integration and segregation of information across the cortex, subserving cognitive functions.

Keywords: dynamic functional connectivity; eigenmodes; magnetoencephalography.


Conflict of interest statement

There were no competing or conflicting interests for any of the authors.

Figures

FIGURE 1
FIGURE 1
Analysis pipeline. Panel (a) shows an example of bandpass‐filtered timeseries. Panel (b) shows the group‐averaged connectome and the structural eigenmodes obtained from the symmetric normalised Laplacian of this connectome. The Laplacian is defined as QA=KAA, where the KA refers to the diagonal node strength matrix and A to the structural connectivity matrix. Normalisation is computed by QAs=KA1/2QAKA1/2. There is an increase in spatial frequency for increasing eigenmode numbers. Panel (c) shows the empirical dynamic functional connectivity (FC). Panel (d) shows the eigenmode‐estimated dynamic FC, along with the goodness‐of‐fit fluctuations over time and the fluctuations of eigenmode expression (coefficients) over time for an arbitrarily selected number of eigenmodes
FIGURE 2
FIGURE 2
Expression of structural eigenmodes during time‐resolved amplitude coupling. Panel (a) shows a short segment of the fluctuation of the explained variance R 2 of time‐resolved functional connectivity by the linear combination of structural eigenmodes for the different frequency bands (colours as in b). Panel (b) shows violin plots for R 2 values across all participants for the entire recording, together with the R 2 values for surrogate data and R 2 values obtained from the prediction of time‐resolved functional connectivity based on direct structural connections (individual connectome). The eigenmode results are illustrated based on individual eigenmodes (first quadrant) and eigenmodes obtained from the group‐averaged connectome (second quadrant). Panel (c) shows examples of empirical and predicted time‐varying functional connectivity matrices. Panel (d) shows the correlation between mean and SD of the R 2 and cognitive performance. Panels (e, f, g) show the power spectral densities of the time‐series of the goodness‐of‐fit R 2 for experimental data, community structure Q and average functional connectivity, all averaged over subjects. Panel (h) shows a distribution of moderate correlations between the expression of the eigenmodes and fluctuations of community structure over time, across all frequency bands. Panel (i) shows subject‐wise correlations for the goodness‐of‐fit and the cosine of the angle between the degree vector and the amplitude envelope across all regions. A dot in panels (h, i) corresponds to a correlation for a single subject
FIGURE 3
FIGURE 3
Stationary (static) versus dynamic connectivity (IAC). Results are, apart from panel (b), shown for the beta band. Panel (a) shows a short segment from a single subject of whole brain connectivity fluctuation for genuine data (dynamic connectivity, depicted in blue) and surrogate data with preserved static connectivity (depicted in red). There are brief periods when dynamic connectivity exceeds stationary connectivity (depicted in black). Panel (b) shows the goodness‐of‐fit (R 2) of the eigenmode approach for the stationary connectivity (red) and for the genuine data at time‐points when dynamic connectivity exceeded stationary connectivity (blue). For all frequency bands there is no difference in goodness‐of‐fit between stationary and dynamic connectivity. Panel (c) shows the estimated mapping coefficients for the same conditions as in (b). An asterisk refers to a significant difference (p < 0.001). Dynamic network states for time‐points when dynamic connectivity exceeded stationary connectivity are shown in (e), which shows a sensorimotor network, a lateralised hemispheric network, a right temporal network, a visual network and an occipitoparietal (visual)/frontal network. Eigenmode predicted brain maps and mapping coefficients are depicted in (f) and (d), respectively. pi, average eigenmode coefficients; dFC, dynamic functional connectivity, comp., component, PDD, phase difference derivative, R 2, explained variance
FIGURE 4
FIGURE 4
Expression of structural eigenmodes during time‐resolved phase coupling. Panel (a) shows a short epoch of the fluctuating proportion of the explained variance R 2 of dynamic functional by the linear combination of structural eigenmodes for the different frequency bands (colours as in b). Panel (b) shows violin plots for R 2 values across all participants and recording, together with the R 2 values for surrogate data and R 2 values obtained from the prediction of dynamic functional connectivity based on direct structural connections (individual connectome). The eigenmode results are illustrated based on individual eigenmodes and group average obtained eigenmodes. Panel (c) shows some examples of empirical and predicted time‐varying functional connectivity matrices. Panel (d) shows the correlation between mean and SD of the R 2 and cognitive performance. Panels (e, f, g) show the power spectral densities of the time‐series of eigenmodes R 2 for genuine data, community structure Q and average functional connectivity, all averaged over subjects. Panel (h) shows a distribution of moderate correlations between the expression of the eigenmodes over time and fluctuations of community structure across all frequency bands. Panel (i) shows subject wise correlations for the goodness‐of‐fit and the cosine of the angle between the degree vector and the vector encompassing the exponential of the phase derivative across all regions. A dot in (h, i) corresponds to a correlation for a single subject.
FIGURE 5
FIGURE 5
Stationary versus dynamic connectivity (PDD). Results are, apart from (b), shown for the beta band. Panel (a) shows a short segment from a single subject of whole brain connectivity fluctuation for genuine data (called dynamic connectivity depicted in blue) and surrogate data with preserved stationary connectivity (depicted in red). There were brief periods when dynamic connectivity exceeds stationary connectivity (depicted in black). Panel (b) shows the goodness‐of‐fit (R 2) of the eigenmode approach for the stationary connectivity case (red) and for the case whenever dynamic connectivity exceeded stationary connectivity (blue). For all frequency bands predictions are better for dynamic connectivity. Panel (c) shows the estimated parameters for the same conditions as in (b). An asterisk refers to a significant difference (p < 0.001). Dynamic network for time‐points when dynamic connectivity exceeded stationary connectivity are shown in (e), which shows a sensorimotor network, a right temporal network, a visual and frontal network. Eigenmode predicted brain maps and mapping coefficients are depicted in (f) and (d), respectively. pi, average eigenmode coefficients; dFC, dynamic functional connectivity; comp., component, PDD, phase difference derivative, R 2, explained variance

Similar articles

Cited by

References

    1. Abdelnour, F. , Dayan, M. , Devinsky, O. , Thesen, T. , & Raj, A. (2018). Functional brain connectivity is predictable from anatomic network's Laplacian eigen‐structure. NeuroImage, 172, 728–739. - PMC - PubMed
    1. Andersson, C. A. , & Bro, R. (2000). The N‐way toolbox for MATLAB. Chemometrics and Intelligent Laboratory Systems, 52, 1–4.
    1. Andersson, J. L. R. , & Sotiropoulos, S. N. (2015). Non‐parametric representation and prediction of single‐and multi‐shell diffusion‐weighted MRI data using Gaussian processes. NeuroImage, 122, 166–176. - PMC - PubMed
    1. Andersson, J. L. R. , & Sotiropoulos, S. N. (2016). An integrated approach to correction for off‐resonance effects and subject movement in diffusion MR imaging. NeuroImage, 125, 1063–1078. - PMC - PubMed
    1. Aqil, M. , Atasoy, S. , Kringelbach, M. L. , & Hindriks, R. (2021). Graph neural fields: A framework for spatiotemporal dynamical models on the human connectome. PLoS Computational Biology, 17, e1008310. - PMC - PubMed

Publication types