. 2022 Jun 1;132(11):e139298.
doi: 10.1172/JCI139298.

Lymphocyte crosstalk is required for monocyte-intrinsic trained immunity to Plasmodium falciparum

Affiliations

Lymphocyte crosstalk is required for monocyte-intrinsic trained immunity to Plasmodium falciparum

Juliet N Crabtree et al. J Clin Invest. .

Abstract

Plasmodium falciparum (P. falciparum) induces trained innate immune responses in vitro, where initial stimulation of adherent PBMCs with P. falciparum-infected RBCs (iRBCs) results in hyperresponsiveness to subsequent ligation of TLR2. This response correlates with the presence of T and B lymphocytes in adherent PBMCs, suggesting that innate immune training is partially due to adaptive immunity. We found that T cell-depleted PBMCs and purified monocytes alone did not elicit hyperproduction of IL-6 and TNF-α under training conditions. Analysis of P. falciparum-trained PBMCs showed that DCs did not develop under control conditions, and IL-6 and TNF-α were primarily produced by monocytes and DCs. Transwell experiments isolating purified monocytes from either PBMCs or purified CD4+ T cells, but allowing diffusion of secreted proteins, enabled monocytes trained with iRBCs to hyperproduce IL-6 and TNF-α after TLR restimulation. Purified monocytes stimulated with IFN-γ hyperproduced IL-6 and TNF-α, whereas blockade of IFN-γ in P. falciparum-trained PBMCs inhibited trained responses. Assay for transposase-accessible chromatin with high-throughput sequencing (ATAC-Seq) on monocytes from patients with malaria showed persistently open chromatin at genes that appeared to be trained in vitro. Together, these findings indicate that the trained immune response of monocytes to P. falciparum is not completely cell intrinsic but depends on soluble signals from lymphocytes.

Keywords: Immunology; Infectious disease; Innate immunity; Malaria; T cells.


Figures
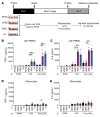
Figure 1
Figure 1. P. falciparum induces hyperinflammation in adherent PBMCs but not purified monocytes.
(A) Schematic of the in vitro experimental design. TNF-α (B) and IL-6 (C) ELISAs of adherent (Adh) PBMCs after primary stimulation with RPMI medium, 1 × 10⁶ uninfected erythrocytes (uRBCs), 1 × 10⁶ P. falciparum–infected erythrocytes (iRBCs), or 100 μM hemozoin (Hz); rested 3 days in medium; and restimulated with RPMI medium, 10 ng/mL LPS, or 10 μg/mL Pam3CSK4 for 24 hours. n = 9; data shown as t+he mean ± SEM. TNF-α (D) and IL-6 (E) ELISAs of supernatants from purified monocytes after primary stimulation with RPMI, 1 × 10⁶ uRBCs, 1 × 10⁶ iRBCs, or 50 μM Hz; rested 3 days in medium; and restimulated with RPMI medium, 10 ng/mL LPS, or 10 μg/mL Pam3CSK4 for 24 hours. n = 4; data shown as mean ± SEM. *P ≤ 0.05, **P ≤ 0.01, ***P ≤ 0.001, by Kruskal-Wallis nonparametric ANOVA with Dunn’s multiple-comparison test.
Figure 2
Figure 2. Recent exposure of PBMCs to P. falciparum leads to a sustained immune response that is further amplified by PAM3CSK4.
(A) RNA expression of PBMCs recently exposed to infected and uninfected RBCs and subsequently stimulated with PAM3CSK4 (after 0 hours). RNA expression units correspond to transcripts per million (TPM) mapped reads. Each hexagonal bin shows the number of genes with the corresponding expression level. n = 3. (B) Significantly enriched GO terms (biological processes) among the 100 genes with the greatest fold change between PBMCs recently exposed to infected RBCs and PBMCs exposed to uninfected RBCs at 0 hours prior to PAM3CSK4 stimulation. Five GO terms of interest (red, blue, green, purple, and orange) were further examined in C. (C) Expression levels (TPM) among the 50 genes with the greatest fold change between PBMCs recently exposed to infected RBCs and PBMCs exposed to uninfected RBCs at 0 hours prior to PAM3CSK4 stimulation. Expression levels at 4 and 12 hours after PAM3CSK4 stimulation are also shown. Genes belonging to the 5 GO terms of interest (red, blue, green, purple, and orange) are indicated above the heatmap. The blue arrows indicate genes that are described in the main text. The red gene labels indicate genes that are shown in a subsequent ATAC-Seq experiment.
Figure 3
Figure 3. Myeloid cells are the main proinflammatory cytokine producers of P. falciparum–trained PBMCs.
(A and B) Flow cytometry analysis indicating cell subset frequency of freshly isolated PBMCs and PBMCs that had adhered to tissue culture plates for 1 hour (A) or 3 hours (B) before 3 successive washes with PBS (n = 4). (C) Intracellular cytokine staining of TNF-α and IL-6 for PBMCs trained with the indicated primary stimulus, rested 3 days in medium, and restimulated with 10 ng/mL LPS or 10 μg/mL Pam3CSK4 for 5 hours (n = 4). (DF) tSNE plot of all combined samples in C. (D) Colored overlays indicate individual cell types depicted in the legend. Black arrows indicate populations of myeloid cells (monocytes and DCs). (E) Overlay of all TNF-α+ cells (dark green). (F) Overlay of all IL-6+ cells (crimson). mDC, myeloid DC; pDC, plasmacytoid DC.
Figure 4
Figure 4. Loss of T lymphocytes ablates the hyperinflammatory response in monocytes.
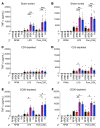
TNF-α and IL-6 ELISAs of cells trained for 24 hours with the indicated primary stimulus; rested 3 days in medium; and then restimulated with RPMI medium, 10 ng/mL LPS, or 10 μg/mL Pam3CSK4 for 24 hours. (A and B) Sham-sorted PBMCs; n = 8. (C and D) PBMCs depleted of CD3+ cells; n = 5. (E and F) PBMCs depleted of CD56+ cells; n = 5. Data shown as the mean ± SEM. *P ≤ 0.05, **P ≤ 0.01, ***P ≤ 0.001, by Kruskal-Wallis nonparametric ANOVA with Dunn’s multiple-comparison test.
Figure 5
Figure 5. Monocytes require T lymphocytes to induce hyperinflammatory responses.
(A) Schematic of the Transwell experiment. Purified monocytes (yellow) were plated in a well with the indicated primary stimulus. Lymphocytes were plated in a 0.4 μm pore Transwell above. TNF-α (B) and IL-6 (C) ELISAs of monocytes stimulated with indicated primary stimuli, with PBMCs depleted of CD14+ cells in a Transwell; rested 3 days in medium; and restimulated with RPMI medium, 10 ng/mL LPS, or 10 μg/mL Pam3CSK4. TNF-α (D) and IL-6 (E) ELISAs of monocytes stimulated with indicated primary stimuli, with purified CD4+ T cells in a Transwell; rested 3 days in medium; and restimulated with RPMI medium, 10 ng/mL LPS, or 10 μg/mL Pam3CSK4. (B and C), n = 6; (D and E), n = 4. Data shown as mean ± SEM. *P ≤ 0.05, **P ≤ 0.01, by Kruskal-Wallis nonparametric ANOVA with Dunn’s multiple-comparison test.
Figure 6
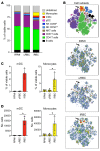
Figure 6. P. falciparum–trained PBMCs have increased levels of monocytes and DCs.
Flow cytometric enumeration of cell subsets in PBMCs stimulated for 24 hours with indicated primary stimuli and rested 3 days in medium. (A) Cell type frequency of viable cells. (B) tSNE plots showing cell subsets overlaid in color according to the legend in A and individual samples trained with RPMI, uRBCs, or iRBCs. Black arrows indicate populations of myeloid cells (monocytes and DCs). (C) Frequency of viable cells for mDCs and monocytes for indicated training stimuli. (D) Cell number of mDCs and monocytes for indicated training stimuli. n = 4; data shown as the mean ± SD. *P ≤ 0.05, by Kruskal-Wallis nonparametric ANOVA with Dunn’s multiple-comparison test.
Figure 7
Figure 7. IFN-γ enhances monocyte training.
(A) ELISA of IFN-γ from supernatants of trained PBMCs during primary stimulus or after a 3-day rest (n = 17). (B) IFN-γ–producing cells in PBMCs stimulated for 12 hours with the indicated primary stimulus (n = 5). TNF-α (C) and IL-6 (D) ELISAs performed on the supernatant of purified monocytes with or without 20 ng/mL IFN-γ during the training period and with the indicated secondary stimulus. n = 8. TNF-α (E and G) and IL-6 (F and H) ELISAs from supernatants of trained PBMCs treated with DMSO (E and F, n = 4) or 2 μM of tofacitinib (G and H, n = 4) during 24-hour training and 3-day rest period followed by indicated secondary stimulus. Data shown as mean ± SEM. *P ≤ 0.05, **P ≤ 0.01, ***P ≤ 0.001, ****P ≤ 0.0001, by Kruskal-Wallis nonparametric ANOVA with Dunn’s multiple-comparison test.
Figure 8
Figure 8. ATAC-Seq of monocytes from adults and children infected with malaria: increased chromatin accessibility in convalescent child patients.
ATAC-Seq of monocytes from adult (n = 3) and child (n = 3) patients with malaria during acute disease and convalescence (after antimalarial treatment). (A) Principal component analysis of ATAC-Seq regularized log-transformed counts for each patient. The purple circle indicates the clustering of pediatric patients. (B) Genomic location of significant (adjusted P < 0.05) differentially accessible peaks between convalescent adult patients with malaria (ACM) and convalescent child patients with malaria (CCM). (C) The number of significant differentially accessible promoter peaks from B. (D) Heatmap of log10 normalized counts for the 25 most significant differentially accessible promoter peaks from C. (E) Heatmap of log10 normalized counts for 7 significant differentially accessible promoter peaks located at genes highlighted in the preceding RNA-Seq experiment (with red labels) as well as IL-10.

Similar articles

Cited by

References

    1. World Health Organization. World Malaria Report 2021. World Health Organization; 2021.
    1. Clark IA, et al. Human malarial disease: a consequence of inflammatory cytokine release. Malar J. 2006;5:85. doi: 10.1186/1475-2875-5-85. - DOI - PMC - PubMed
    1. Franklin BS, et al. Malaria primes the innate immune response due to interferon-gamma induced enhancement of toll-like receptor expression and function. Proc Natl Acad Sci U S A. 2009;106(14):5789–5794. doi: 10.1073/pnas.0809742106. - DOI - PMC - PubMed
    1. Schofield L, Grau GE. Immunological processes in malaria pathogenesis. Nat Rev Immunol. 2005;5(9):722–735. doi: 10.1038/nri1686. - DOI - PubMed
    1. Gazzinelli RT, et al. Innate sensing of malaria parasites. Nat Rev Immunol. 2014;14(11):744–757. doi: 10.1038/nri3742. - DOI - PubMed

Publication types