. 2022 Jun 1;132(11):e146471.
doi: 10.1172/JCI146471.

SIK2 inhibition enhances PARP inhibitor activity synergistically in ovarian and triple-negative breast cancers

Affiliations

SIK2 inhibition enhances PARP inhibitor activity synergistically in ovarian and triple-negative breast cancers

Zhen Lu et al. J Clin Invest. .

Abstract

Poly(ADP-ribose) polymerase inhibitors (PARP inhibitors) have had an increasing role in the treatment of ovarian and breast cancers. PARP inhibitors are selectively active in cells with homologous recombination DNA repair deficiency caused by mutations in BRCA1/2 and other DNA repair pathway genes. Cancers with homologous recombination DNA repair proficiency respond poorly to PARP inhibitors. Cancers that initially respond to PARP inhibitors eventually develop drug resistance. We have identified salt-inducible kinase 2 (SIK2) inhibitors, ARN3236 and ARN3261, which decreased DNA double-strand break (DSB) repair functions and produced synthetic lethality with multiple PARP inhibitors in both homologous recombination DNA repair deficiency and proficiency cancer cells. SIK2 is required for centrosome splitting and PI3K activation and regulates cancer cell proliferation, metastasis, and sensitivity to chemotherapy. Here, we showed that SIK2 inhibitors sensitized ovarian and triple-negative breast cancer (TNBC) cells and xenografts to PARP inhibitors. SIK2 inhibitors decreased PARP enzyme activity and phosphorylation of class-IIa histone deacetylases (HDAC4/5/7). Furthermore, SIK2 inhibitors abolished class-IIa HDAC4/5/7-associated transcriptional activity of myocyte enhancer factor-2D (MEF2D), decreasing MEF2D binding to regulatory regions with high chromatin accessibility in FANCD2, EXO1, and XRCC4 genes, resulting in repression of their functions in the DNA DSB repair pathway. The combination of PARP inhibitors and SIK2 inhibitors provides a therapeutic strategy to enhance PARP inhibitor sensitivity for ovarian cancer and TNBC.

Keywords: Apoptosis; Cancer; Cell Biology; DNA repair; Therapeutics.


Conflict of interest statement

Conflict of interest: The authors have declared that no conflict of interest exists.

Figures

Figure 1
Figure 1. SIK2 inhibitors enhance olaparib sensitivity in ovarian cancer and breast cancer cells.
(A and B) Dose-response curves for ARN3236 or ARN3261 (blue), olaparib (green), or ARN3236 or ARN3261 combined with olaparib (red) for 96 hours in 12 cancer cell lines (A) and 3 nonmalignant cell lines (B). The IC50 of inhibitors and concentration ratio of SIK2 inhibitors to olaparib used in each cell line are listed in Supplemental Table 2. The statistical significance between olaparib alone and SIK2 inhibitor combined with olaparib was calculated with 2-way ANOVA and Tukey’s multiple-comparison test. NS, P > 0.05; ***P < 0.001; ****P < 0.0001 (red stars indicate SIK2 inhibitor + olaparib enhancing the effect of olaparib alone; blue stars indicate SIK2 inhibitor + olaparib inhibiting olaparib’s effect). A combination index (CI) at ED90 (determination of the 90% effective dose) was calculated using CalcuSyn software. Experiments were repeated 3 times. Representative data were from 1 independent experiment with 4 technical repeats.
Figure 2
Figure 2. SIK2 expression promotes tumor cell growth, and inhibition of SIK2 enhances olaparib sensitivity in ovarian cancer and breast cancer cells.
(AD) Dose-response curves of olaparib in paired cancer cell lines with or without KO of SIK2 (A and B) and with or without stable transfection of SIK2 (C and D). The IC50 for olaparib was calculated using GraphPad Prism 8. Representative data from 1 experiment with 4 replicates are presented. Experiments were repeated 3 times with similar results. Western blot analysis confirmed either SIK2 KO (B) or overexpression (D). (E and F) Representative images of clonogenic assays (E) and quantification of colonies (F) in 4 cancer cell lines are presented. SKOv3, OVCAR8, HCC5032, and MDA-MB-231 cells were treated with olaparib, ARN3236, ARN3261, or olaparib plus ARN3236 at concentrations indicated in Supplemental Figure 1B for 10–22 days. The columns indicate the mean of colonies and the bars indicate the SD. The statistical significance was calculated with 1-way ANOVA and Tukey’s multiple-comparison test (**P < 0.01; ***P < 0.001; ****P < 0.0001). The data were obtained from 1 independent experiment with 3 technical repeats, and experiments were repeated at least 3 times.
Figure 3
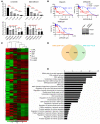
Figure 3. Combined effect of SIK2 inhibitor and olaparib on PARP-1 enzyme activity and DNA DSB repair pathways.
(A) Dose-response curves for olaparib and combined effect of SIK2 inhibitors with olaparib on PARP-1 enzyme activity. OVCAR8 and MDA-MB-231 cells were treated with SIK2 inhibitors, olaparib alone, or the combination for 26 hours. The concentrations of ARN3236, ARN3261, and olaparib were 6 μM, 4 μM, and 0.05 μM, respectively (also see Supplemental Figure 2C). The columns indicate the mean activity and the bars indicate the SD. The statistical significance was calculated with 1-way ANOVA and Tukey’s multiple-comparison test (*P < 0.05; **P < 0.01; ***P < 0.001; ****P < 0.0001). (B) Dose-response curves of ARN3236, ARN3261, and olaparib in DT40 PARP-1–/– cells with and without knockin of human PARP-1 (hPARP). The IC50 indicated on the curves was calculated using GraphPad Prism 8. The expression of exogenous hPARP in DT40 PARP-1–/– was measured by Western blotting. For both A and B, the representative data were from 1 experiment with 3 replicates. Experiments were repeated 3 times with similar results. (C) The heatmap presentation of unsupervised hierarchical clustering of gene expression. The heatmap includes 3587 transcripts (upregulated or downregulated by ≥2-fold) treated with ARN3236, ARN3261, olaparib, ARN3236 plus olaparib, and ARN3261 plus olaparib. The heatmap illustrates changes that are color coded with red corresponding to upregulation and green to downregulation. (D) The Venn representation. Venn diagram analysis represented the number of genes (upregulated or downregulated by ≥2-fold) that were overlapped by the treatment of ARN3236 plus olaparib (yellow) or ARN3261 plus olaparib (green). (E) GO analysis of 1380 differentially expressed genes shared by ARN3236 plus olaparib or ARN3261 plus olaparib treatments. The bar plot shows the log10 P value of the biological process GO terms obtained with differentially expressed genes at P < 0.01.
Figure 4
Figure 4. ARN3236 and ARN3261 enhance olaparib-induced DNA DSBs.
(A) The heatmap representation of unsupervised hierarchical clustering of differentially expressed genes associated with DNA repair. The heatmap illustrates changes that are color coded with red corresponding to upregulation and green to downregulation. (B) Analysis of DNA repair and apoptosis genes using RT-PCR. Cells were treated with a single agent or the combination for 72 hours. The concentrations of ARN3236, ARN3261, and olaparib were 4 μM (2 times), 4 μM (3 times), and 15 μM (2 times), respectively. Representative data are from 1 experiment with 3 technical repeats per treatment. Experiments were repeated 3 times. One-way ANOVA and Tukey’s multiple-comparison test were performed (*P < 0.05; **P < 0.01; ***P < 0.001; ****P < 0.0001).
Figure 5
Figure 5. ARN3236 and ARN3261 enhance olaparib-induced apoptosis.
(A and B) Quantification of DNA damage (γ-H2AX). The concentrations of ARN3236, ARN3261, and olaparib were 1 μM, 4 μM, and 2 μM, respectively. Red indicates γ-H2AX and blue (DAPI) indicates nuclear stain. Representative images are presented. Scale bar: 20 μm (A). γ-H2AX dots were quantified with Olympus CellSens Dimension software. The middle solid lines indicate the mean. Top and bottom solid lines indicate the SD (B). One-way ANOVA and Tukey’s multiple-comparison test were calculated (*P < 0.05; **P < 0.01; ***P < 0.001; ****P < 0.0001). Experiments were from 3 independent experiments with a total of 100–200 cells per treatment. (C and D) Detection of apoptosis using annexin V/propidium iodide (PI) staining. SKOv3 cells were treated with ARN3236 (8 μM), ARN3261 (5 μM), olaparib (25 μM) alone or combined for 6 days. HCC5032 cells were treated with ARN3236 (1 μM), ARN3236 (3 μM), or olaparib (3 μM) alone or combined for 5 days. OVCAR8 and MDA-MB231 were treated with ARN3236 (6 μM), ARN3236 (6 μM), or olaparib (5 μM) individually or combined for 5 days. Representative data are from 1 experiment with 3 replicates. Experiments were repeated twice with similar results. The columns indicate the mean and the bars indicate the SD. One-way ANOVA and Tukey’s multiple-comparison test were calculated (NS, P > 0.05; *P < 0.05; **P < 0.01; ***P < 0.001; ****P < 0.0001).
Figure 6
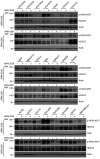
Figure 6. ARN3236 and ARN3261 decrease phosphorylation of HDAC4/5/7.
Phosphorylation level of HDAC4/5/7. Twenty ovarian cancer and 2 TNBC cell lines were treated with ARN3236 (4 μM) or ARN3261 (4 μM) for 24 hours. Representative image is from 1 independent experiment. Experiments were repeated twice with similar results.
Figure 7
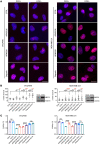
Figure 7. ARN3236 and ARN3261 decrease promoter activity of MEF2 transcription factors.
(A) Detection of HDAC5 localization with or without SIK2 inhibitors. After overnight incubation, cells were treated with ARN3236 (3 μM) or ARN3261 (5 μM) for 24 hours. Cells were stained with anti-HDAC5 and imaged with fluorescence microscopy for HDAC5 (green) and DAPI (blue). The fluorescence intensity was quantified using ImageJ (Supplemental Figure 4). Scale bar: 20 μm. (B) Quantification of MEF2 promoter activity. Cells were transfected with a mixture of a MEF2-responsive luciferase construct and Renilla luciferase construct for 24 hours and then treated with ARN3236 (4 μM) and ARN3261 (4 μM) for different intervals or with different doses of inhibitor for 24 hours as indicated. The columns indicate the mean of MEF2 luciferase activity, and the bars indicate the SD. One-way ANOVA and Tukey’s multiple-comparison test were performed (NS, P > 0.05; *P < 0.05; **P < 0.01; ***P < 0.001; ****P < 0.0001). Representative data were from 1 independent experiment with 3 technical repeats. Experiments were repeated 2 times. (C and D) Quantification of MEF2 promoter activity with and without knockdown of HDAC4 and HDAC5 (C). Cells were transfected with targeting or control siRNA for 24 hours prior to transfection of a mixture of a MEF2-responsive luciferase construct and Renilla luciferase construct. Cells were then treated with ARN3236 (4 μM) or ARN3261 (4 μM) for 24 hours. HDAC4 and HDAC5 siRNA knockdown efficiency was measured by Western blot analysis (D). Representative data are from 1 independent experiment with 3 replicates. Experiments were repeated twice with similar results. Two-way ANOVA and Dunnett’s multiple-comparison test were performed (NS, P > 0.05; *P < 0.05; **P < 0.01; ***P < 0.001; ****P < 0.0001).
Figure 8
Figure 8. SIK2 inhibition alters MEF2D transcription factor–mediated downstream signaling.
(A) Alterations affecting MEF2 family genes in ovarian and breast cancer by TCGA analysis. Alterations of MEF2D are found in 12% of ovarian cancer samples (TCGA, 316 samples, ref. 22) and 26% of breast cancer samples (Metabric, 2509 samples, refs. 53, 54) respectively, and the large majority of alterations were amplifications and mRNA upregulations. Data and plots were obtained using cBioPortal (22, 54, 55). (B) MEF2D consensus DNA motifs. The MEF2 motif is enriched in MEF2D-binding sites in SKOv3 cells. (C) ChIP sequence of anti-MEF2D at the FANCD2 locus in SKOv3 cells treated with and without ARN3236. The dotted line indicates the comparison of chromatin accessibility of the FANCD2 gene between control and ARN3236 treatment. (D) ChIP and RT-qPCR analysis of FANCD2, EXO1, and XRCC4 genes. OVCAR8 and MDA-MB-231 cells were treated with and without ARN3236 (6 μM) or ARN3261 (4 μM) for 48–50 hours and then harvested for ChIP analysis with normal IgG, MEF2D, Pol-II, H3K27Ac, or H3KMe1 antibody. ChIP pulldown samples were analyzed by RT-qPCR. The columns indicate the mean of relative fold-changes (fold-change = 2-ΔΔCt, ChIP signal relative to the IgG background signal) and the bars indicate the SD. Two-way ANOVA and Dunnett’s multiple-comparison test were performed (*P < 0.05; **P < 0.01; *****P < 0.0001). Representative data are from 1 experiment with 3 replicates. Experiments were repeated twice with similar results.
Figure 9
Figure 9. Overexpression of MEF2D is sufficient to block SIK2 inhibition–induced downregulation of FANCD2, EXO1, and XRCC4; DNA damage; and growth inhibition.
(A and B) Forced expression of MEFD2. OVCAR8 and MDA-MB-231 cells with DOX-inducible MEF2D expression were treated with ARN3236 (1 μM), ARN3261 (4 μM), and olaparib (2 μM) in the presence and absence of DOX (1 μg/mL) for 8 hours. DOX was added to culture medium 48 hours prior to inhibitor treatments. Red indicates γ-H2AX and blue (DAPI) indicates nuclear stains. Representative images are presented A. Scale bar: 20 μm. γ-H2AX dots were quantified with Olympus CellSens Dimension software. The middle solid lines indicate the mean of fluorescent dots. Top and bottom solid lines indicate the SD. The statistical significance between DOX and DOX+ was calculated with 1-way ANOVA and Tukey’s multiple-comparison test (NS, P > 0.05; **P < 0.01; ***P < 0.001; ****P < 0.0001) (B). Data were from 3 replicates with a total of 100–200 cells per treatment. Experiments were repeated twice. Determination of MEF2D expression by Western blot analysis (B). (C) Determination of cell viability in MEF2D DOX-inducible OVCAR8 and MDA-MB-231 cells. DOX-inducible MEF2D sublines of OVCAR8 and MDA-MB-231 were treated with DOX and without DOX for 24 hours, and then treated with ARN3236 (2 μM), ARN3261 (4 μM), and olaparib (4 μM) for 72 hours. The statistical significance between DOX and DOX+ was calculated with 1-way ANOVA and Tukey’s multiple-comparison test. NS, P > 0.05; ****P < 0.0001. Representative data were from 1 experiment with 4 replicates. Experiments were repeated twice with similar results.
Figure 10
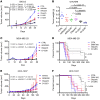
Figure 10. Coadministration of SIK2 inhibitor and olaparib synergistically inhibits xenograft growth.
(A and B) Tumor growth and tumor weight of ovarian cancer xenografts in female athymic nu/nu mice after treatment with a single agent or combination (n = 10). Tumor growth by tumor volume (A) or tumor weight (B) under different treatments plotted as mean ± SD. One-way ANOVA and Tukey’s multiple-comparison test were performed (*P < 0.05; **P < 0.01). Both experiments were performed once. (C and D) Tumor growth of MDA-MB-231 cells and survival of tumor-bearing mice. Tumor-bearing mice were randomized into 4 treatment groups (n = 10) after 7 days of tumor growth. Mice were treated with a single agent or combination for 6 weeks. Experiments were repeated 2 times. Tumor growth was evaluated from the start of treatment until tumors reached 1500 mm3. One-way ANOVA and Tukey’s multiple-comparison test were performed for tumor growth. Survival was evaluated with ethical endpoints. Survival curves were generated by GraphPad Prism 6. A log-rank test was performed for comparison of survival (NS, P > 0.05; *P < 0.05; **P < 0.01; ***P < 0.001). (E and F) Tumor growth of HCC-1937 TNBC cells and survival of tumor-bearing mice. Tumor-bearing mice were randomized into 4 treatment groups (n = 8) after 7 days of tumor growth. Mice were treated with a single agent or combination for 4 weeks. The experiment was performed once. Tumor growth was evaluated from the start of treatment until tumors reached 1500 mm3. One-way ANOVA and Tukey’s multiple-comparison test were performed for tumor growth. Survival curves were generated as above. A log-rank test was performed for comparison of survival (NS, P > 0.05; *P < 0.05; **P < 0.01; ***P < 0.001).
Figure 11
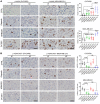
Figure 11. Coadministration of SIK2 inhibitor and olaparib increases γ-H2AX and decreases phosphorylation of HDAC4/5/7 in OVCAR8 and MDA-MB-231 tumor xenografts.
Representative images of IHC with indicated antibodies, γ-H2AX (A) and p-HDAC4/5/7 (B), from mouse tumor tissues. Scale bar: 50 μm. Positive cells per 100 cancer cells were counted and 1-way ANOVA with Tukey’s multiple-comparison test were performed (NS, P > 0.05; *P < 0.05; **P < 0.01; ***P < 0.001; ****P < 0.0001). #1 indicates mouse #1 and #2 indicates mouse #2 from 1 experiment.

References

    1. Gee ME, et al. DNA damage repair in ovarian cancer: unlocking the heterogeneity. J Ovarian Res. 2018;11(1):50. doi: 10.1186/s13048-018-0424-x. - DOI - PMC - PubMed
    1. Mirza-Aghazadeh-Attari M, et al. DNA damage response and repair in ovarian cancer: potential targets for therapeutic strategies. DNA Repair (Amst) 2019;80:59–84. doi: 10.1016/j.dnarep.2019.06.005. - DOI - PubMed
    1. Torgovnick A, Schumacher B. DNA repair mechanisms in cancer development and therapy. Front Genet. 2015;6:157. - PMC - PubMed
    1. Symington LS. Role of RAD52 epistasis group genes in homologous recombination and double-strand break repair. Microbiol Mol Biol Rev. 2002;66(4):630–670. doi: 10.1128/MMBR.66.4.630-670.2002. - DOI - PMC - PubMed
    1. Prakash R, et al. Homologous recombination and human health: the roles of BRCA1, BRCA2, and associated proteins. Cold Spring Harb Perspect Biol. 2015;7(4):a016600. doi: 10.1101/cshperspect.a016600. - DOI - PMC - PubMed

Publication types

MeSH terms

Substances