. 2022 Jun 1:11:e76380.
doi: 10.7554/eLife.76380.

A biophysical threshold for biofilm formation

Affiliations

A biophysical threshold for biofilm formation

Jenna A Moore-Ott et al. Elife. .

Abstract

Bacteria are ubiquitous in our daily lives, either as motile planktonic cells or as immobilized surface-attached biofilms. These different phenotypic states play key roles in agriculture, environment, industry, and medicine; hence, it is critically important to be able to predict the conditions under which bacteria transition from one state to the other. Unfortunately, these transitions depend on a dizzyingly complex array of factors that are determined by the intrinsic properties of the individual cells as well as those of their surrounding environments, and are thus challenging to describe. To address this issue, here, we develop a generally-applicable biophysical model of the interplay between motility-mediated dispersal and biofilm formation under positive quorum sensing control. Using this model, we establish a universal rule predicting how the onset and extent of biofilm formation depend collectively on cell concentration and motility, nutrient diffusion and consumption, chemotactic sensing, and autoinducer production. Our work thus provides a key step toward quantitatively predicting and controlling biofilm formation in diverse and complex settings.

Keywords: biofilm; chemotaxis; computational biology; dispersal; motility; none; physics of living systems; quorum sensing; systems biology.


Conflict of interest statement

JM, SC, DA, TB, SD No competing interests declared

Figures

Figure 1.
Figure 1.. Competition between motility-mediated dispersal and autoinducer-mediated biofilm formation.
(A) Schematic of chemotactic dispersal: planktonic bacteria (green) consume nutrient (purple) and establish a local gradient that they, in turn, direct their motion in response to. (B) Schematic of positive quorum sensing-controlled biofilm formation: accumulation of produced autoinducer (red) above a threshold concentration causes cells to transition to the biofilm state (blue). (C) Results of an example simulation of Equations 1–4 showing the dynamics of the nutrient, planktonic cells, autoinducer, and biofilm cells from top to bottom, quantified by the normalized concentrations c/c0, b1/b1,0, a/a*, b2/b1,0, respectively; c0, b1,0, and a* represent the initial nutrient concentration, initial bacterial concentration, and autoinducer threshold for biofilm formation, respectively. The position coordinate is represented by the normalized position x/x0, where x0 is the width of the initial cellular inoculum. Different shades indicate different time points as listed. The inoculum initially centered about the origin consumes nutrient (purple), establishing a gradient that drives outward dispersal by chemotaxis (outward moving green curves); the cells also produce autoinducer (red) concomitantly. At t13 h, sufficient autoinducer has been produced to trigger biofilm formation at the origin; at even longer times (t16 h), nutrient depletion limits autoinducer production at this position. However, accumulation of autoinducer by the dispersing planktonic cells triggers partial biofilm formation at x/x06 as well. This competition between dispersal and biofilm formation leads to a final biofilm fraction of f=21% at the final time of t=20 h. An animated form of this figure is shown in Video 1. The values of the simulation parameters are given in Supplementary file 2.
Figure 1—figure supplement 1.
Figure 1—figure supplement 1.. The exact nature of the temporal dynamics of the arrest in motility while transitioning to the biofilm state does not appreciably influence our model results.
Results of the same simulation as in Figure 1C, but with both motility parameters D1 and χ1 smoothly transitioning to zero in time for cells that are transitioning to the biofilm state—instead of these parameters transitioning step-wise to zero as in the simulations presented in the main text. To implement this change, we monitor the amount of time τ elapsed after planktonic cells are exposed to sufficient autoinducer to drive the transition to the biofilm state (i.e., after the moment when a=a*), and decrease the motility parameters linearly to reach zero after a total time τ has elapsed: the diffusivity and chemotactic coefficients are given by D1×(1-τ/τ) and χ1×(1-Δτ/τ), respectively. When,ττ both motility parameters are zero. The results, shown above, are visually identical to those in Figure 1C.
Figure 1—figure supplement 2.
Figure 1—figure supplement 2.. The details of the initial inoculum shape do not appreciably influence our model results.
Results of the same simulation as in Figure 1C, but with the shape of the initial inoculum changed from a Gaussian profile to a step function with the same maximum cellular concentration and width. The results, shown above, are visually nearly identical to those in Figure 1C.
Figure 2.
Figure 2.. Faster nutrient consumption limits autoinducer production, leading to complete dispersal.
Retion as in Figure 1C, but for planktonic cells with faster nutrient consumption (larger κ1). Panels and colors show the same quantities as in Figure 1C. The inoculum initially centered about the origin consumes nutrient (purple), establishing a gradient that drives outward dispersal by chemotaxis (outward moving green curves); the cells also produce autoinducer (red) concomitantly. However, nutrient is depleted at this position more rapidly, limiting autoinducer production; as a result, the population continues to disperse in the planktonic state and the final biofilm fraction is f=0%. An animated form of this figure is shown in Video 2. The values of the simulation parameters are given in Supplementary file 2.
Figure 2—figure supplement 1.
Figure 2—figure supplement 1.. Slower nutrient consumption allows greater autoinducer production, leading to more biofilm formation.
Results of the same simulation as in Figure 1C, but for planktonic cells with slower nutrient consumption (smaller κ1). Panels and colors show the same quantities as in Figure 1C. The inoculum initially centered about the origin slowly consumes nutrient (purple), establishing a slight gradient that allows partial planktonic dispersal (green curves moving outward); the cells also produce autoinducer (red) concomitantly. Because nutrient is consumed slowly, autoinducer production is not limited, resulting in partial biofilm formation (blue). Autoinducer has sufficiently accumulated above the threshold after t14 h, which causes a population of biofilm cells to form at the origin (x/x00). After 20 h, the biofilm population continues to grow, and additionally, autoinducer concentration exceeds the threshold concentration at x/x010. Thus, we see a second population of biofilm cells form, centered at.x/x010. The slower nutrient consumption results in a greater final biofilm fraction than in Figure 1C—here,.f=52%. An animated form of this figure is shown in Video 3. The values of the simulation parameters are given in Supplementary file 2.
Figure 3.
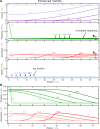
Figure 3.. Enhanced motility enables cells to disperse before sufficient autoinducer accumulates, leading to complete dispersal.
(A) Results of the same simulation as in Figure 1C, but for faster-moving planktonic cells (larger D1 and χ1). Panels and colors show the same quantities as in Figure 1C. The inoculum initially centered about the origin consumes nutrient (purple), establishing a gradient that drives outward dispersal by chemotaxis (outward moving green curves); the cells also produce autoinducer (red) concomitantly. More rapid dispersal enables the planktonic cells to ‘outrun’ the growing autoinducer plume, as shown by the extended and magnified view in (B). As a result, the population continues to disperse in the planktonic state and the final biofilm fraction is f=0%. An animated form of this figure is shown in Video 4. The values of the simulation parameters are given in Supplementary file 2.
Figure 3—figure supplement 1.
Figure 3—figure supplement 1.. Diminished motility enables autoinducer to accumulate, resulting in increased biofilm formation.
Results of the same simulation as in Figure 1C, but for slower-moving planktonic cells (smaller D1 and χ1). Panels and colors show the same quantities as in Figure 1C. The inoculum initially centered about the origin consumes nutrient (purple), establishing a slight gradient—however, because the motility parameters are diminished, the planktonic population (green) remains around the origin. The planktonic cells produce autoinducer (red) concomitantly, and after 1 h, the autoinducer concentration exceeds the threshold concentration. Thus, some of the planktonic cells transition to biofilm cells, centered at the origin. Both the biofilm cells and planktonic cells continue to grow, produce autoinducer, and consume nutrient; the planktonic cells do not disperse due to their diminished motility, resulting in a larger fraction of biofilm cells (f=82%) than in Figure 1C. An animated form of this figure is shown in Video 5. The values of the simulation parameters are given in .
Figure 4.
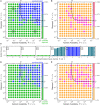
Figure 4.. The two states of complete dispersal by planktonic cells (green) and complete formation of a biofilm (blue) can be universally described by three dimensionless parameters.
(A) State diagram showing the fraction of biofilm formed, f, at the final time (t=20 h) for different values of the nutrient availability and cellular dispersal parameters, D~ and J~, respectively. The state diagram summarizes the results of 10,983 simulations of Equations 1–4 exploring the full range of parameter values describing different bacterial species/strains and different environmental conditions (Supplementary file 1). Each point represents the mean value of f obtained from multiple simulations with different parameter values, but with similar D~ and J~ (identical within each bin defined by the spacing between points). (B) represents the same data, but each point represents the standard deviation of the values of f obtained from the same simulations. Despite the vastly differing conditions explored in each simulation, they cluster into the two states of planktonic dispersal (green) and biofilm formation (blue) when parameterized by D~ and J~. The boundary between the two states can be described by the relation D~/D~+J~/J~1, as shown by the black line; this relation combines the transition between the two states that occurs at both D~1 and J~1. Away from this boundary, all simulations for the same D~ and J~ collapse to have the same biofilm fraction f, as shown by the points in (B) and examples (i)–(iii) and (v) in (C)—confirming the universality of our parameterization. Near the boundary, we observe some slight differences between simulations, as shown in (B) and examples (iv) and (vi) in (C). The values of the simulation parameters for the examples in (C) are given in Source Data file 1. The data in (AC) correspond to a fixed value of the third dimensionless parameter S~=50, which describes the case of biofilm cells that produce autoinducer rapidly; repeating these simulations for the opposite case of slow autoinducer production by biofilm cells (S~=1/50) yields the state diagram shown in (D), but for 14,351 simulation runs; again, (E) shows the standard deviation of the corresponding values of f. As shown by (DE), while the transition between the two states (black line) is unaffected by the change in S~, the transition to complete biofilm formation is more gradual. Together, the three parameters D~, J~, and S~ provide a full description of the onset and extent of biofilm formation across vastly different conditions.
Figure 4—figure supplement 1.
Figure 4—figure supplement 1.. In the case of ‘protected’ nutrient-independent autoinducer production, the transition from planktonic to biofilm states occurs at, J~1 independent of D~.
The model described in the main text considers autoinducer secretion to be nutrient-dependent; here, we consider the alternate case of ‘protected’ nutrient-independent production at the maximal rate k1 per cell. In this case, we do not expect the transition from the planktonic to biofilm state to depend on nutrient availability, as quantified by D~. Instead, the analysis presented in the main text suggests that the dispersal parameter, J~, alone should be sufficient to capture this transition. To test this expectation, we perform the same numerical simulations as presented in the main text, but without the Michaelis-Menten function g(c) multiplying the autoinducer production term in Equation 4. The resulting state diagrams showing the final (t=20 h) fraction of biofilm formed, f, and the standard deviation of the f values, as a function of D~ and J~ are shown in (A–B). These diagrams summarize 8709 separate simulations. The results confirm our expectation: in contrast to the results shown in Figure 4, the transition does not appreciably depend on D~, but instead occurs near J~1 (black line). Thus, the theoretical framework developed in this work is more general and can be applied to bacteria with nutrient-dependent or nutrient-independent autoinducer production.
Figure 4—figure supplement 2.
Figure 4—figure supplement 2.. Simulation results are not appreciably influenced by our choice of discretization.
To assess the sensitivity of our results to numerical discretization, we repeat two representative simulations with (A) (D~,J~)=(0.033,1.6), corresponding to, f=0% and (B) (D~,J~)=(1.00,4.86), corresponding to, f=93% with varying spatial and temporal step sizes, dx and, dt, respectively. The spatial step size is changed by a factor n and the corresponding temporal step size is changed by a factor, n2 accordingly, as indicated by the lower and upper horizontal axes, respectively. As shown in the figure, the final biofilm fraction f obtained from the simulations is not strongly sensitive to the choice of numerical discretization for spatial and temporal steps smaller than those used for the simulations presented in the main text (indicated by the red stars). Thus, our choice of discretization is sufficiently finely resolved such that the results in the numerical simulations are not appreciably influenced by discretization.

Comment in

  • doi: 10.7554/eLife.80891

References

    1. Abdel-Aziz S. Bacterial Biofilm: Dispersal and Inhibition Strategies. Scholarena Journal of Biotechnology. 2014;10:105. doi: 10.18875/2375-6713.1.105. - DOI
    1. Adadevoh JST, Triolo S, Ramsburg CA, Ford RM. Chemotaxis Increases the Residence Time of Bacteria in Granular Media Containing Distributed Contaminant Sources. Environmental Science & Technology. 2016;50:181–187. doi: 10.1021/acs.est.5b03956. - DOI - PubMed
    1. Adadevoh JST, Ramsburg CA, Ford RM. Chemotaxis Increases the Retention of Bacteria in Porous Media with Residual NAPL Entrapment. Environmental Science & Technology. 2018;52:7289–7295. doi: 10.1021/acs.est.8b01172. - DOI - PubMed
    1. Adler J. Chemotaxis in bacteria. Science. 1966a;153:708–716. doi: 10.1126/science.153.3737.708. - DOI - PubMed
    1. Adler J. Effect of amino acids and oxygen on chemotaxis in Escherichia coli. Journal of Bacteriology. 1966b;92:121–129. doi: 10.1128/jb.92.1.121-129.1966. - DOI - PMC - PubMed

Publication types