. 2022 Jul 20;110(14):2242-2257.e6.
doi: 10.1016/j.neuron.2022.05.003. Epub 2022 May 27.

Engineered AAVs for non-invasive gene delivery to rodent and non-human primate nervous systems

Affiliations

Engineered AAVs for non-invasive gene delivery to rodent and non-human primate nervous systems

Xinhong Chen et al. Neuron. .

Abstract

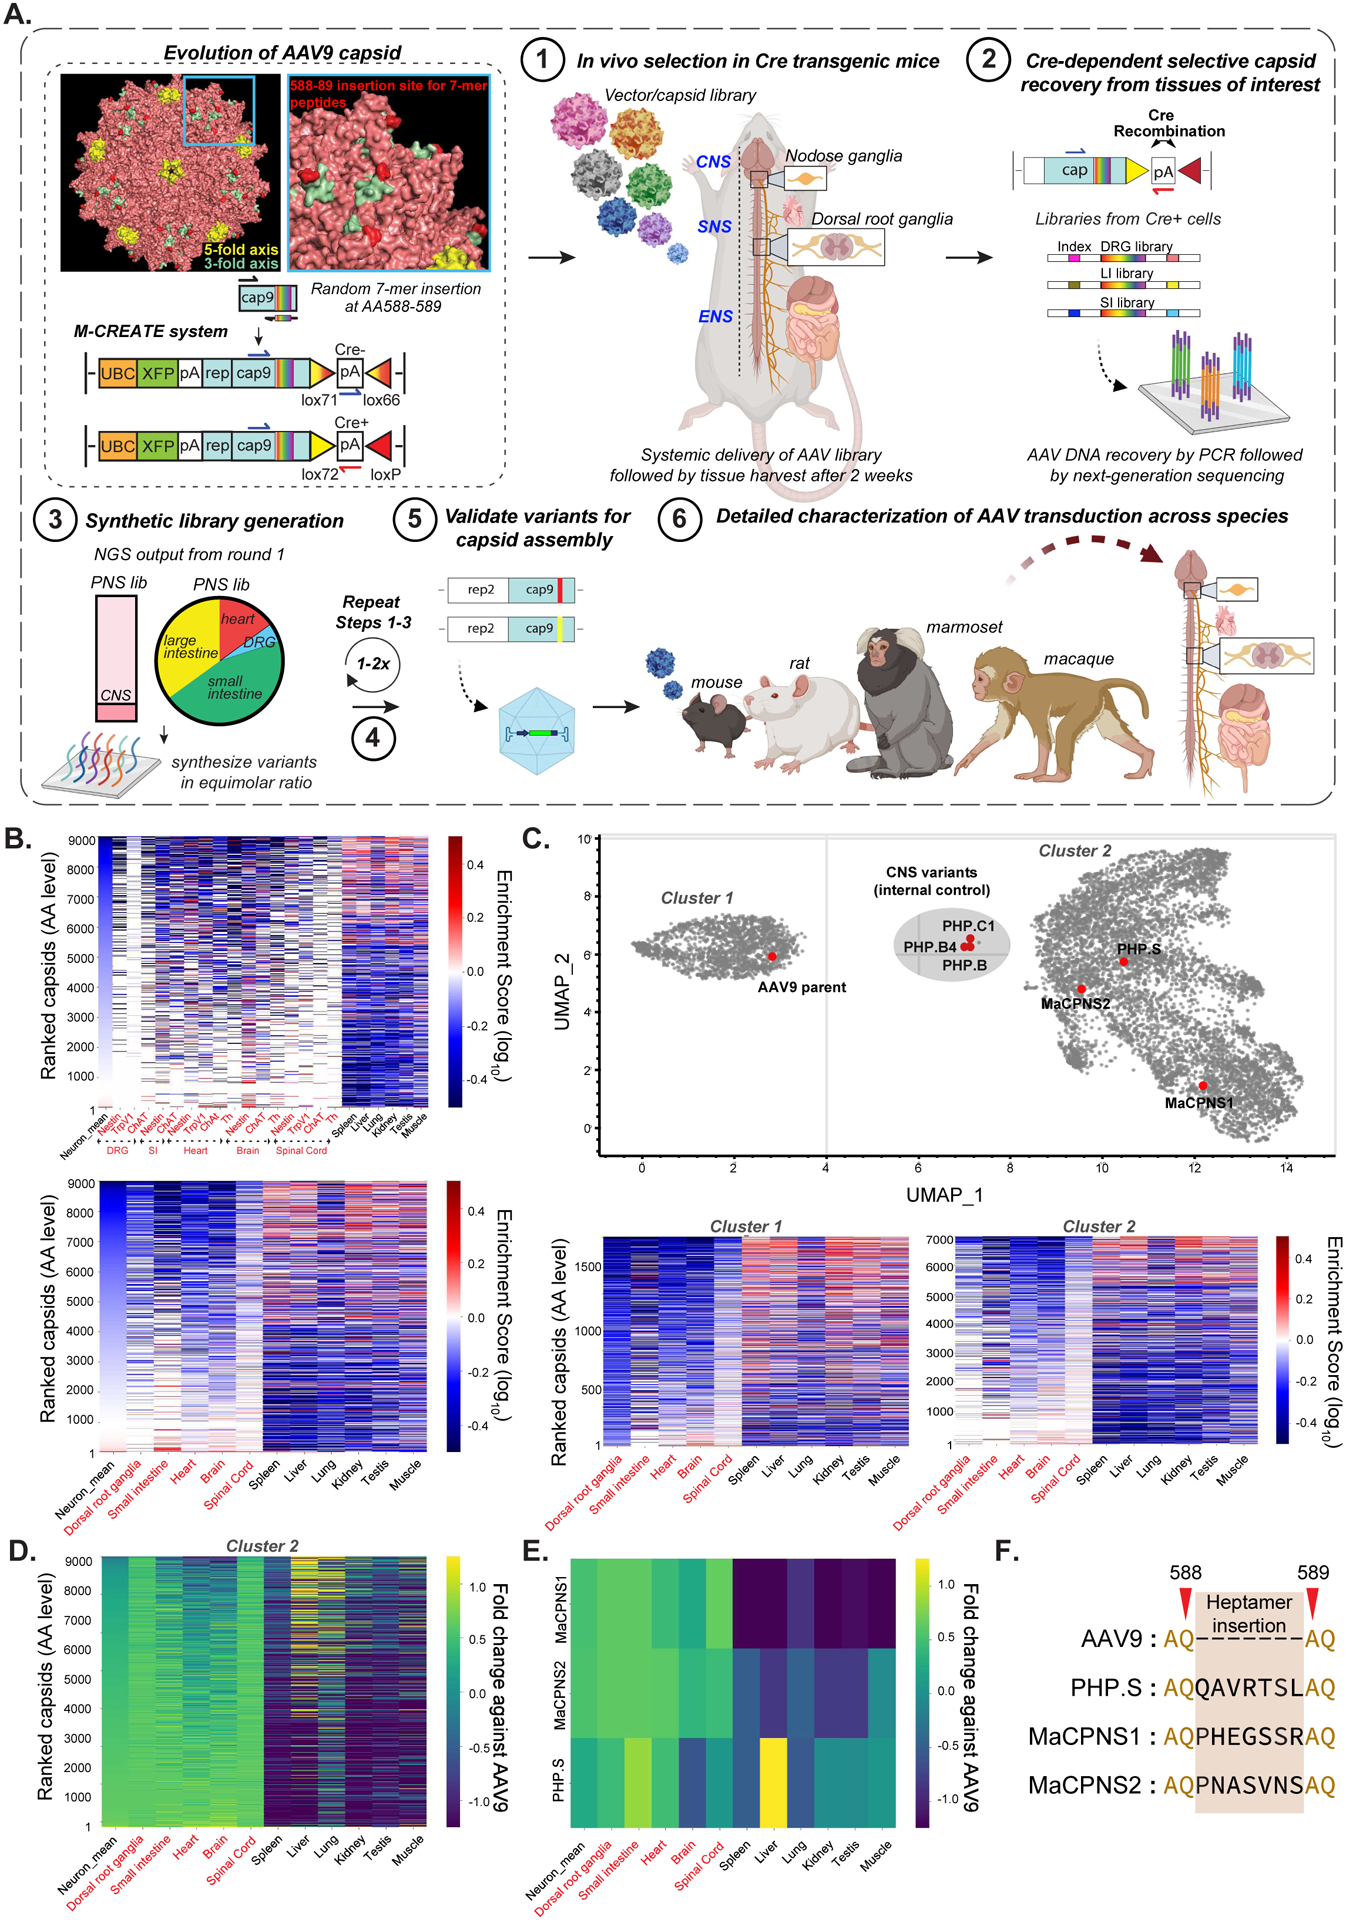
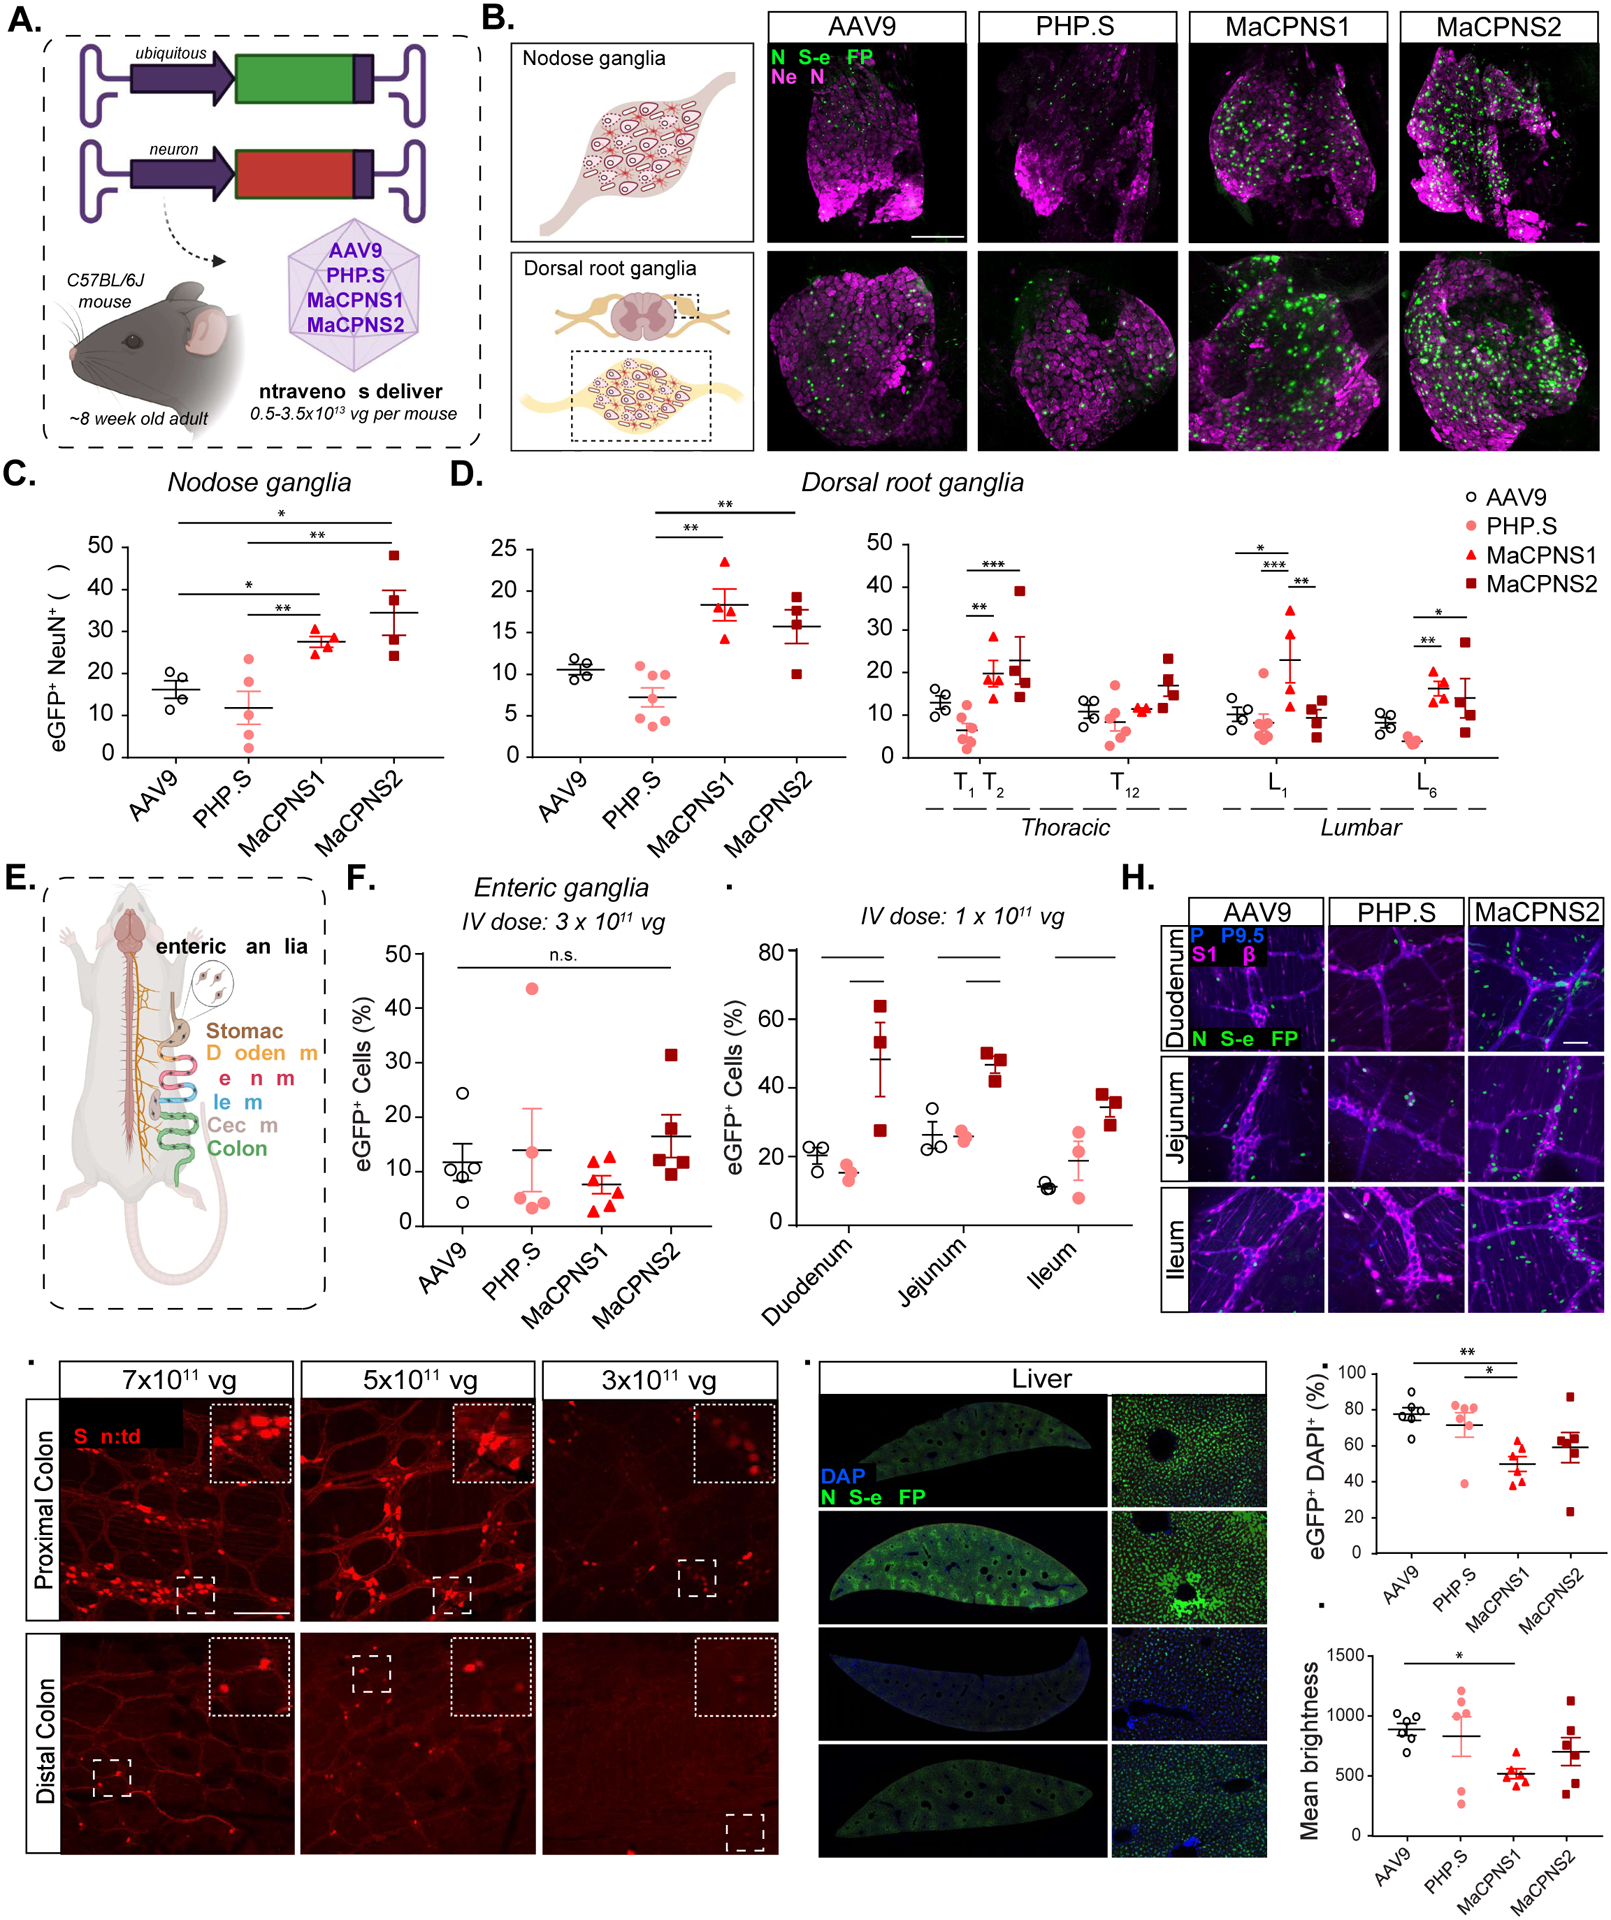
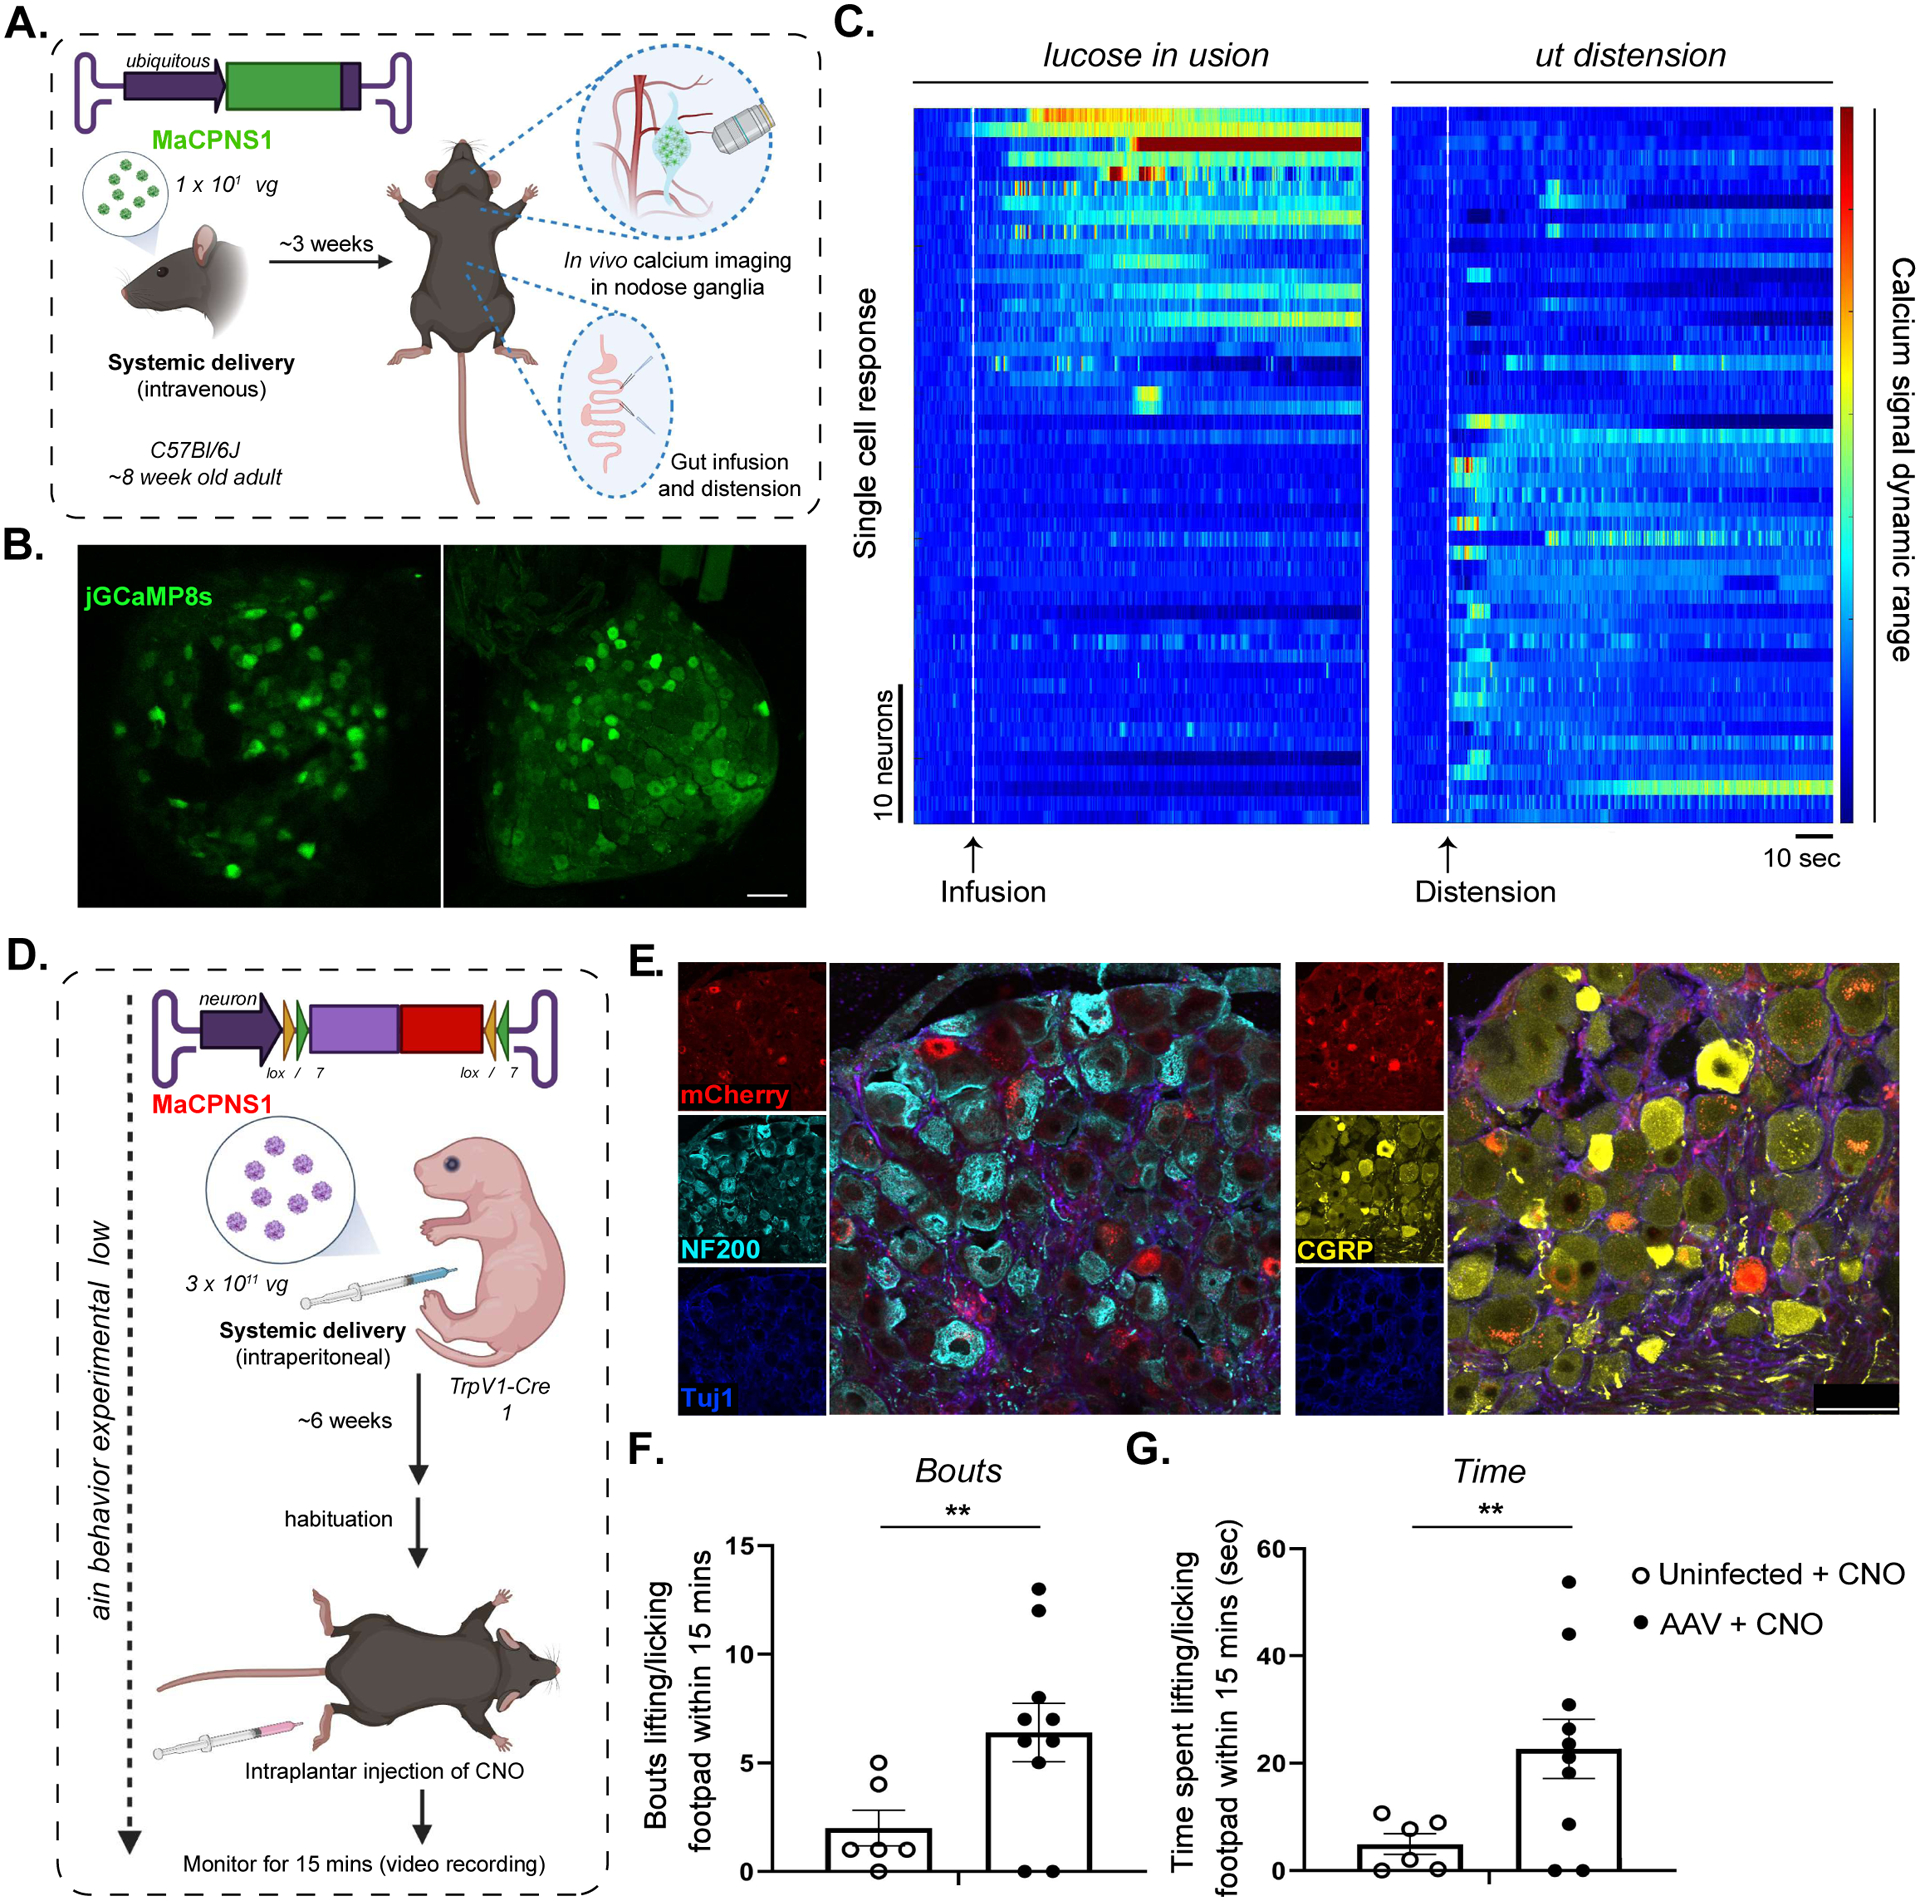
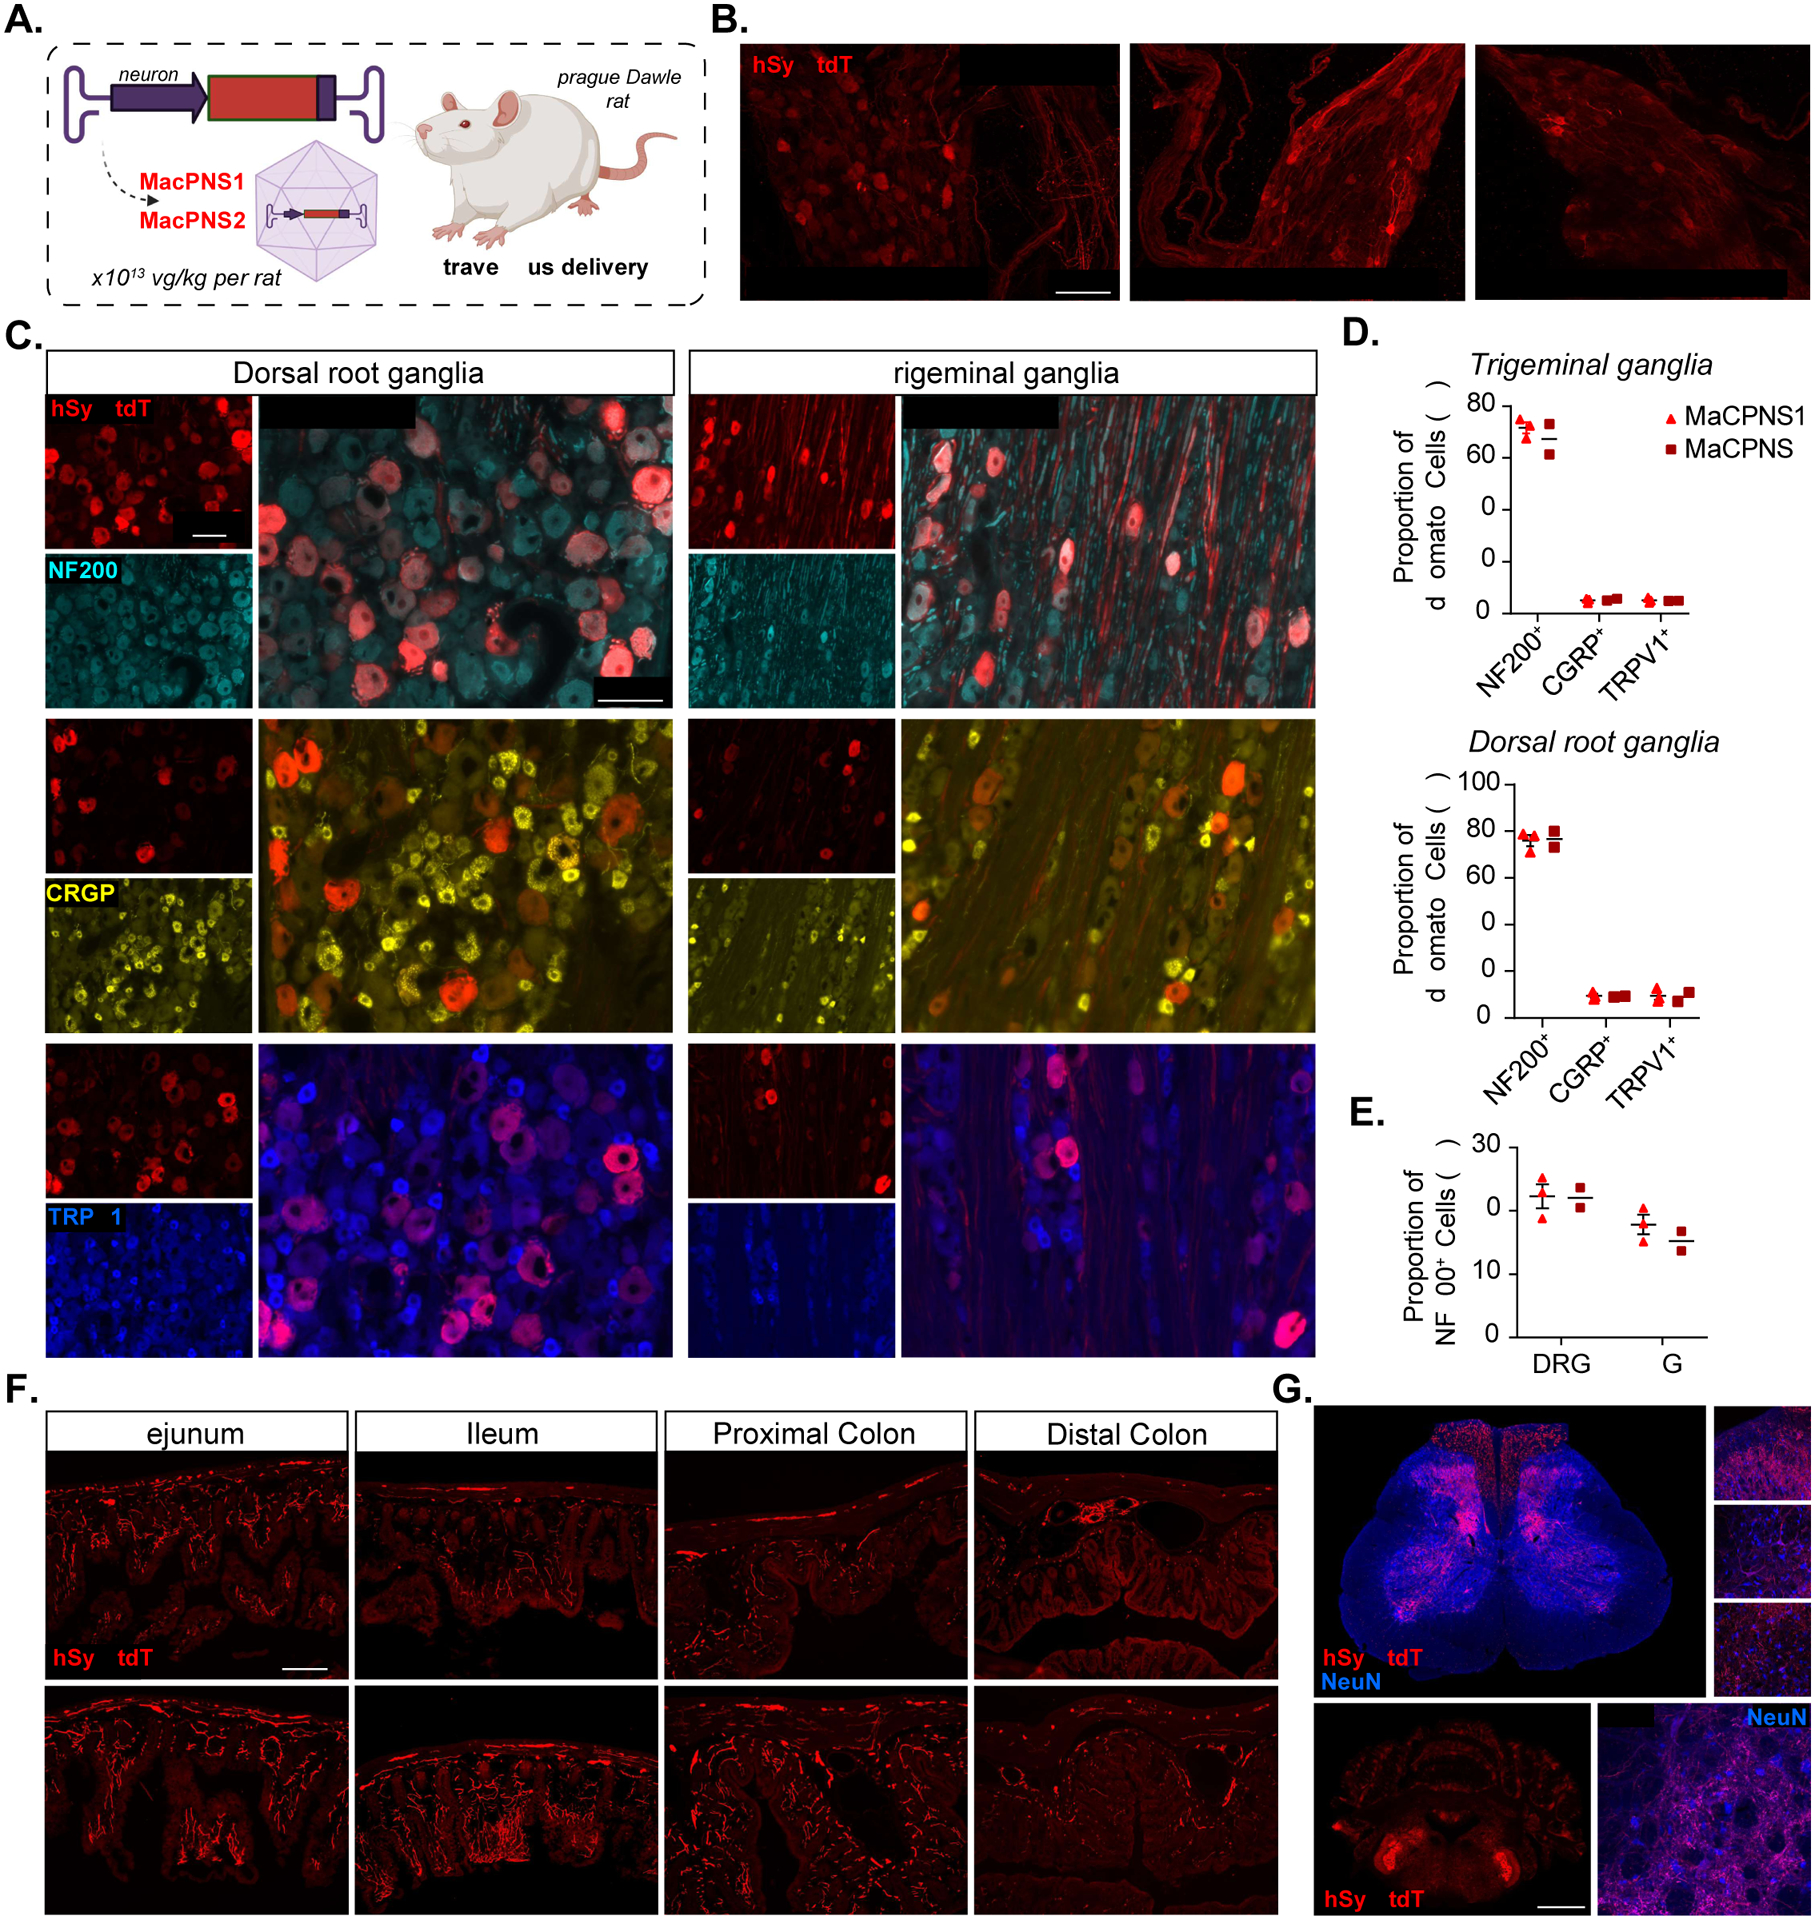
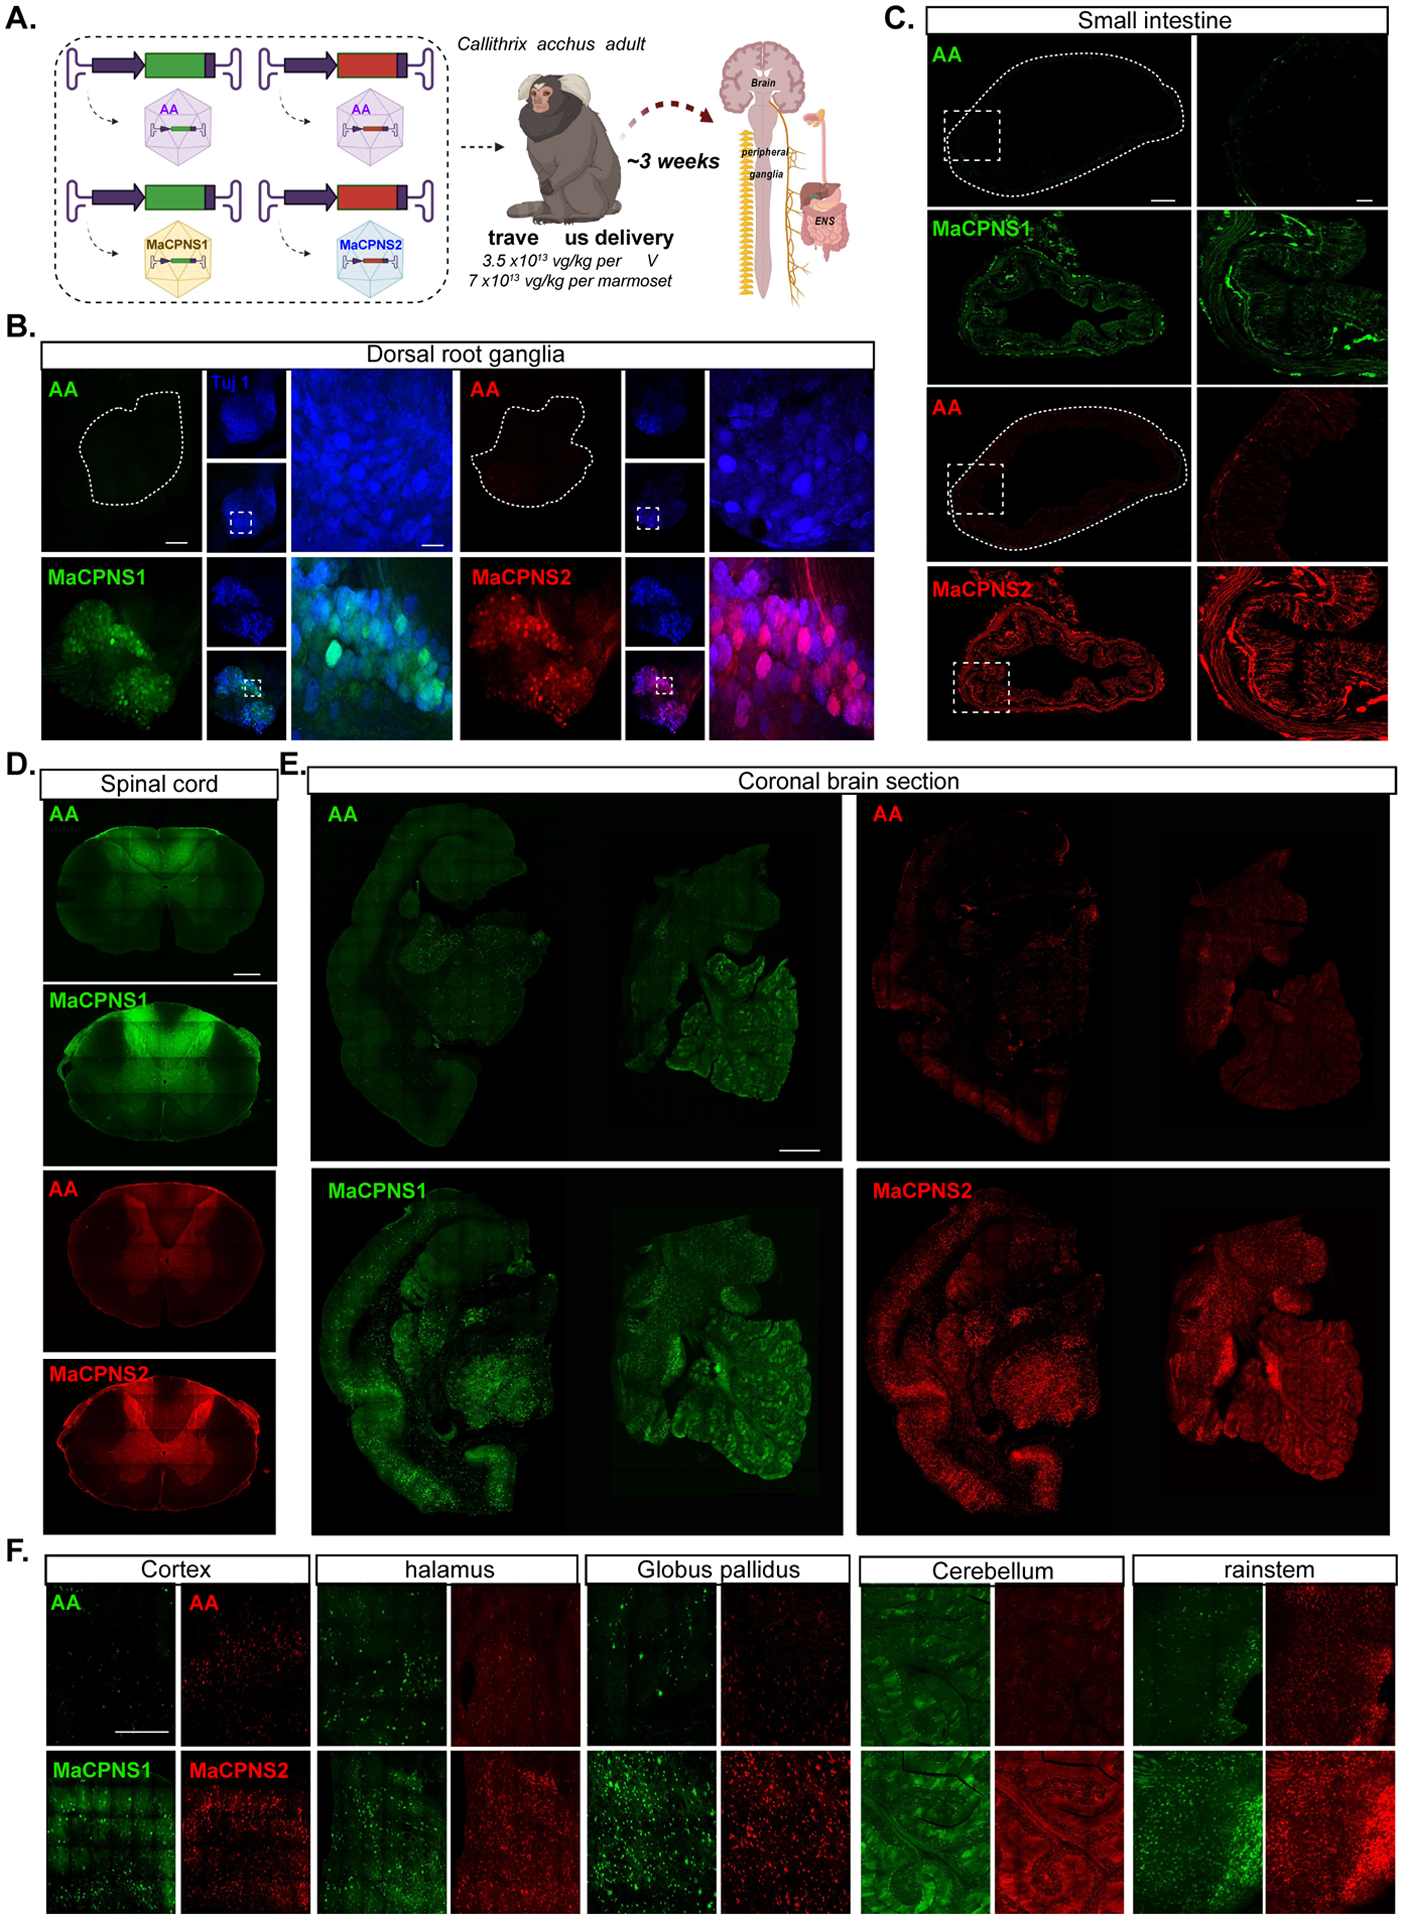
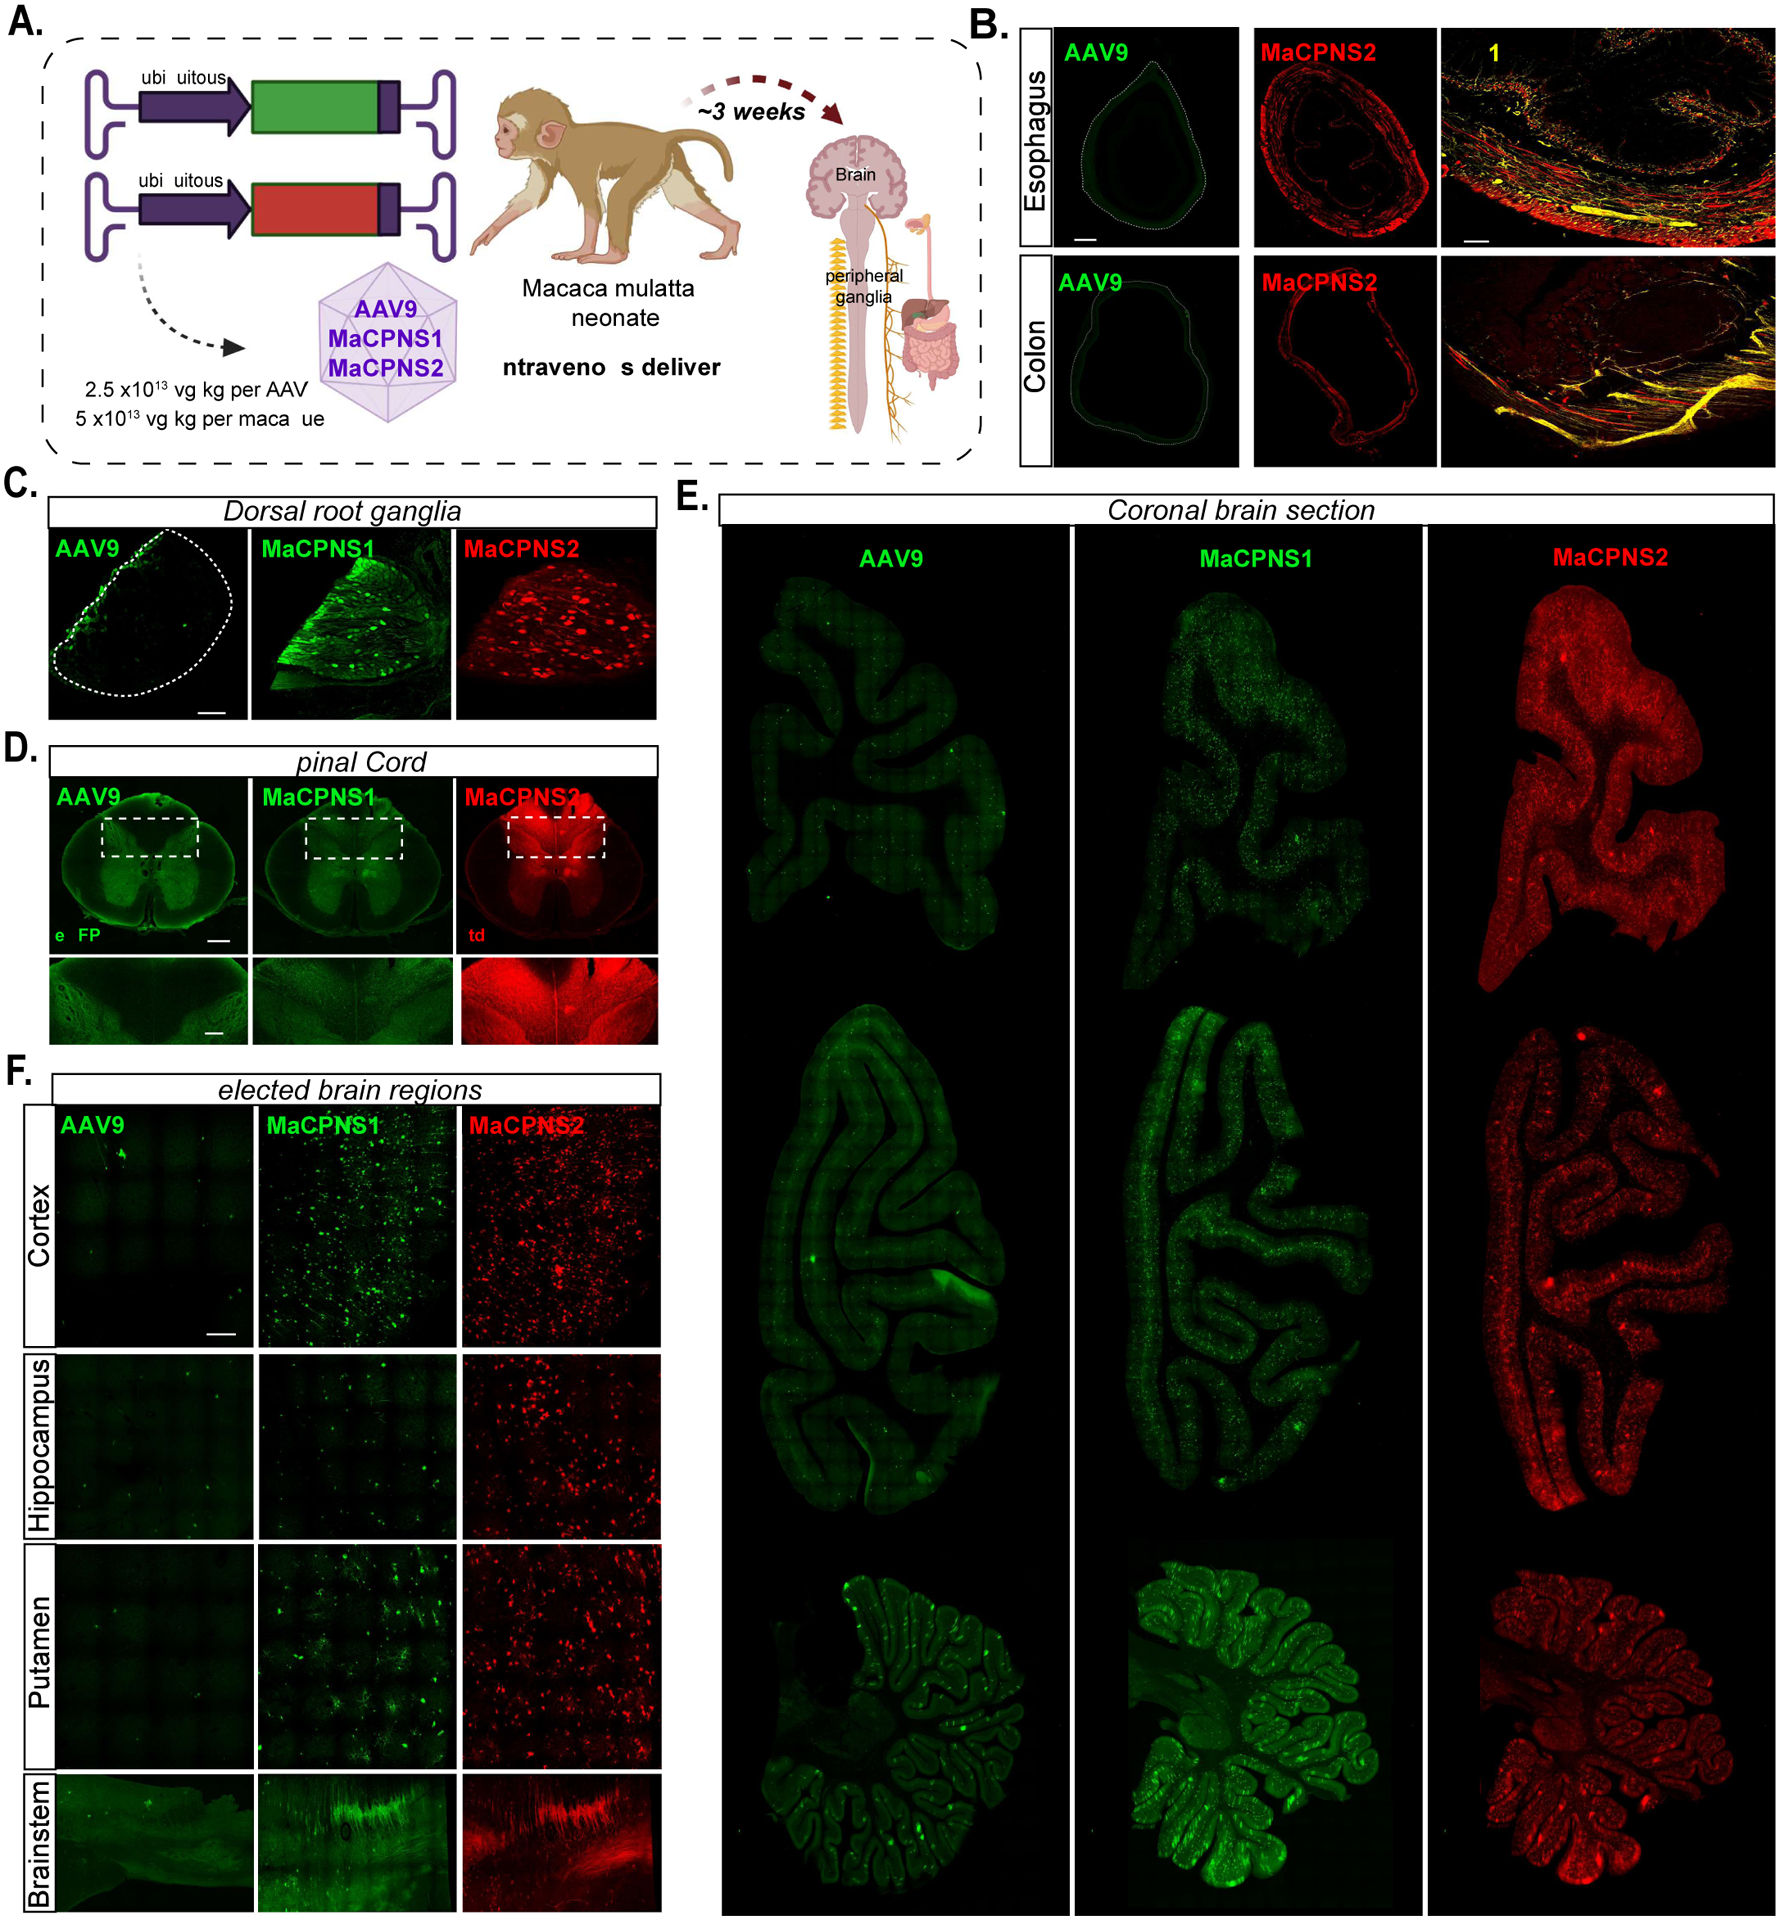
Gene therapy offers great promise in addressing neuropathologies associated with the central and peripheral nervous systems (CNS and PNS). However, genetic access remains difficult, reflecting the critical need for the development of effective and non-invasive gene delivery vectors across species. To that end, we evolved adeno-associated virus serotype 9 (AAV9) capsid in mice and validated two capsids, AAV-MaCPNS1 and AAV-MaCPNS2, across rodent species (mice and rats) and non-human primate (NHP) species (marmosets and rhesus macaques). Intravenous administration of either AAV efficiently transduced the PNS in rodents and both the PNS and CNS in NHPs. Furthermore, we used AAV-MaCPNS1 in mice to systemically deliver the following: (1) the neuronal sensor jGCaMP8s to record calcium signal dynamics in nodose ganglia and (2) the neuronal actuator DREADD to dorsal root ganglia to mediate pain. This conclusively demonstrates the translatability of these two systemic AAVs across four species and their functional utility through proof-of-concept studies in mice.

Keywords: AAV; CNS; PNS; cross-species; functional modulation; functional readout; gene therapy; non-human primate.


Conflict of interest statement

Declaration of interests The California Institute of Technology has filed and licensed patent applications for some of the work described in this manuscript, with X.C., S.R.K., and V.G. listed as inventors. V.G. is a member of the Neuron advisory board and a co-founder and board member of Capsida Biotherapeutics, a fully integrated AAV engineering and gene therapy company.

Figures

Figure 1:
Figure 1:. Multiplexed-CREATE selection for AAV capsids targeting the nervous system across species.
A. An overview of the capsid selection method, Multiplexed-CREATE, and characterization of selected capsids across species. Top left panel illustrates evolution of the AAV9 capsid (PDB 3UX1) with a zoom-in (blue) of a three-fold axis and the 7-mer-i library insertion site between residues 588–589 highlighted in red. The diagrams below demonstrate the arrangement of the acceptor vector in the absence (top) or presence (bottom) of Cre, with the corresponding orientations of the forward/reverse primers used for Cre+ selective recovery. The selection workflow involves four key steps: (1) generation of capsid library and intravenous (IV) delivery into transgenic mouse lines where Cre is restricted to cell types of interest (SNAP-Cre, GFAP-Cre, Tek-Cre, n=2 mice per Cre line). (2) Two weeks post-injection, viral DNA is recovered across cell-types/tissues using Cre-dependent PCR and Illumina next-generation sequencing (NGS), and (3) fed into synthetic pool library production. (4) This library then goes through a second round of in vivo selection. Following this selection process, identified variants are validated for (5) virus production and (6) in vivo transduction across species. B. Heatmaps of capsid variants’ mean enrichment by Cre-dependent recovery across tissues of interest (red text) and Cre-independent recovery across off-targets (black text) after two rounds of selection. Cre lines are plotted separately (top panel, n=3 mice per organ) or grouped by organs (bottom panel). The y-axis represents capsids unique at the amino acid (AA) level, ranked by ‘neuron mean’, which is the mean of the enrichment of all targets of interest. C. UMAP cluster representation of ~9,000 variants that were recovered after two rounds of selection (UMAP parameters: n_neighbors=15, min_dist=0.1, n_components=2, random_state=42, metric=‘correlation’, verbose=3). Three separable clusters are shown along with the positions of known capsids (AAV9, PHP.S, PHP.B, PHP.B4, PHP.C1) and new capsids (MaCPNS1 and MaCPNS2). Heatmaps (below) show enrichment of representative capsids from Clusters-1 and -2 across organs. D. Heatmap of enrichment fold changes against parental AAV9 across organs. E. Heatmap of enrichment fold changes against parental AAV9 of variants MaCPNS1 and MaCPNS2 and previously-engineered variant PHP.S across organs. F. Identity of hepta-AA peptides inserted between positions 588–589 of AAV9 for PHP.S, MaCPNS1 and MaCPNS2 capsids.
Figure 2:
Figure 2:. Engineered AAVs can efficiently target the peripheral nervous system in mice following systemic delivery.
A. Illustration demonstrating the IV administration of AAV capsids packaged with ssAAV:CAG-2xNLS-eGFP and ssAAV:hSyn-tdTomato genome in a mouse model (~8 week-old young C57BL/6J adults). B. (Top) An illustration of the nodose ganglia (NG) (left), and representative images of AAV9, PHP.S, MaCPNS1 and MaCPNS2 vector-mediated expression of nuclear-localized (NLS) eGFP (green) in NG (right). (Bottom) An illustration of the dorsal root ganglia (DRG) in the spinal cord (left) and (right) representative images of AAV vector-mediated expression of NLS-eGFP (green) in DRG across segment T2 (Thoracic) of the spinal cord (n≥4 per group, ~8 week-old C57BL/6J males, 3×10¹¹ vg IV dose per mouse, 3 weeks of expression). Magenta: αNeuN antibody staining for neurons. Images are matched in fluorescence intensity to the respective AAV9 control. Scale bar: 200 μm. C. Percentage of AAV-mediated eGFP expression overlapping with the αNeuN marker in NG. One-way ANOVA non-parametric Kruskal-Wallis test (exact P=0.0003), and follow-up multiple comparisons with uncorrected Dunn’s test are reported (P=0.0499 for AAV9 versus MaCPNS1, P=0.0251 for AAV9 versus MaCPNS2, P=0.0094 for PHP.S versus MaCPNS1, P=0.0038 for PHP.S versus MaCPNS2). *P ≤ 0.05, **P ≤ 0.01 are shown, P > 0.05 is not shown; n≥4 per group, same experimental parameters as B. Each data point represents 1–2 nodose ganglia per mouse comprising >700 cells, mean ± s.e.m is plotted. D. Percentage of eGFP expression overlapping with the αNeuN marker in DRG (left) where each data point shows the mean per mouse across select DRGs within thoracic and lumbar segments of the spinal cord. A one-way ANOVA, non-parametric Kruskal-Wallis test (exact P=0.0005), and follow-up multiple comparisons with uncorrected Dunn’s test are reported (P=0.0018 for PHP.S versus MaCPNS1, P=0.0087 for PHP.S versus MaCPNS2). *P ≤ 0.05, **P ≤ 0.01 are shown, P > 0.05 is not shown; n≥4 per group, same experimental parameters as B. Each data point shows mean ± s.e.m of DRGs across different areas of each mouse, comprising a mean of 1–2 DRGs per area with >200 αNeuN+ cells per DRG. (Right) Percentage of eGFP expression overlapping with the αNeuN marker in DRG across spinal cord areas in individual mice. A two-way ANOVA and Tukey’s multiple comparisons tests with adjusted P values are reported (*P ≤ 0.05, **P ≤ 0.01 and ***P ≤ 0.001 are shown, P > 0.05 is not shown). Each data point shows the mean ± s.e.m of 1–2 DRG per mouse comprising >200 αNeuN+ cells per DRG. E. Illustration of the adult mouse gastrointestinal (GI) tract, highlighting the enteric ganglia (zoom-in) that are spread across the different segments of the GI tract. F. Percentage of cells expressing NLS-eGFP delivered by AAV vectors in the myenteric plexus across the GI tract: stomach, duodenum, jejunum, ileum, proximal colon and cecum (ssAAV:CAG-2xNLS-eGFP genome, n≥5 per group, ~8 weeks old C57BL/6J males, 3×10¹¹ vg IV dose per mouse, 3 weeks of expression). A one-way ANOVA non-parametric Kruskal-Wallis test (approximate P=0.2985), and follow-up multiple comparisons using uncorrected Dunn’s test are reported (individual P > 0.05, n.s.). Each data point shows the mean ± s.e.m of >100 enteric ganglia per intestinal segment per mouse). G. Percentage of cells expressing NLS-eGFP (green in H) in the myenteric plexus of small intestinal segments: duodenum, jejunum and ileum delivered by AAV vectors: AAV9, PHP.S and MaCPNS2 (ssAAV:CAG-2xNLS-eGFP genome, n=3 per group, 1×10¹¹ vg IV dose per mouse, 3 weeks of expression). Two-way ANOVA, Tukey’s multiple comparisons tests with adjusted P values are reported (*P ≤ 0.05, **P ≤ 0.01 and ***P ≤ 0.001 are shown, P > 0.05 is not shown). Each data point shows the mean ± s.e.m of ≥ 2 images per mouse comprising >100 enteric ganglia. H. shows representative images of AAV-mediated eGFP expression across the individual intestinal segments analyzed in G. Scale bar: 50 μm. The tissues were co-stained with αS100β (magenta) antibody for glia and αPGP9.5 (blue) for neurons. The images are matched in fluorescence intensity to the respective AAV9 control. I. MaCPNS2 vector-mediated expression of tdTomato (red) from ssAAV:hSyn-tdTomato in the proximal and distal segments of the colon at three different IV doses per mouse: 7×10¹¹ vg, 5×10¹¹ vg, 3×10¹¹ vg (3 weeks of expression, n=3 per group, scale bar: 200 μm, dotted white box inset represents a zoomed-in view of the indicated area in each image). Images in the distal and proximal colon are matched in fluorescence intensity. J. Representative images of AAV vector-mediated expression of NLS-eGFP (green) from ssAAV:CAG-2xNLS-eGFP in the liver (n=6 per group, 3×10¹¹ vg IV dose/mouse, 3 weeks of expression, blue: DAPI staining of nuclei, scale bar: 1 mm (left, full cross-sectional image), and 50 μm (right, higher magnification view). The images are matched in fluorescence intensity to the respective AAV9 control. K. Percentage of eGFP+ cells overlapping with the DAPI marker in the liver. A non-parametric Kruskal-Wallis test (approximate P=0.0168), and follow-up multiple comparisons with uncorrected Dunn’s test (P=0.0035 for AAV9 versus MaCPNS1 and P=0.0189 for PHP.S versus MaCPNS1) are reported (*P ≤ 0.05, **P ≤ 0.01 are shown, P > 0.05 is not shown; same experimental parameters as J., each data point shows the mean ± s.e.m of 4 images per mouse comprising >780 DAPI+ cells per image). L. Mean brightness of the eGFP+ cells quantified in K. A non-parametric Kruskal-Wallis test (approximate P=0.1698), and follow-up multiple comparisons with uncorrected Dunn’s test (P=0.0433 for AAV9 versus MaCPNS1) is reported (*P ≤ 0.05 is shown, P > 0.05 is not shown; each data point shows the mean ± s.e.m of 4 images per mouse comprising >780 DAPI+ cells per image).
Figure 3:
Figure 3:. Systemic delivery of GCaMP sensor and excitatory DREADD actuator using AAV-MaCPNS1 enable functional characterization of DRG neurons in mouse models.
A. Illustration of IV administration of MaCPNS1 capsid packaged with ssAAV:CAG-jGCaMP8s genome in mice (~8 week-old young adults, C57BL/6J males, 1×10¹² vg IV dose/mouse, n=4). Three weeks post-expression, the mice were anesthetized and subjected to in vivo calcium imaging in nodose ganglia (NG, top zoom-in), and glucose infusion and distension in the gut (bottom zoom-in). B. Representative images of MaCPNS1 vector-mediated expression of jGCaMP8s (green) in NG in vivo (left), and in post-hoc fixed tissue (right) (scale bar: 100 μm). C. Single-cell activity response measured by calcium signal dynamics in the NG (data pooled from 4 experimental mice). Left panel: NG neuronal response to glucose infusion (white dotted line). Right panel: NG neuronal response to gut distension (white dotted line). D. Illustration of the pain induction experimental workflow. MaCPNS1 vector with ssAAV:hSyn-DIO-hM3D(Gq)-mCherry was intraperitoneally administered to a TrpV1-Cre mouse model (postnatal stage 1 (P1), males, 3×10¹¹ vg IV dose/mouse). After six weeks of expression, the mice (AAV injected or untreated) were habituated and subjected to intraplantar injection with the agonist CNO, after which the mice were monitored for nocifensive lifting/licking behaviors. E. Representative images of DRG sections showing MaCPNS1 vector-mediated mCherry (red) expression. The tissues were co-stained with αNF200 (cyan), αTuj1 (blue) and αCGRP (yellow) markers. F. Total bouts of, and G total time spent lifting or licking the footpad within 15 minutes of injection in uninfected (n=6) and MaCPNS1-infected (n=10) mice treated with CNO. **P ≤ 0.01 by unpaired t-test. Mean+/− sem are shown.
Figure 4:
Figure 4:. Engineered AAVs can efficiently target the peripheral nervous system in adult rats following systemic administration
A. Illustration of IV administration of AAV capsids MaCPNS1 and MaCPNS2 packaged with ssAAV:hSyn-tdTomato genome in a rat model (young adults, Sprague Dawley, male, 2×10¹³ vg/kg per rat). The rat tissues were stained with αDsRed (red) antibody against tdTomato B. Representative images of MaCPNS1 vector-mediated tdTomato (red) expression in major pelvic ganglia (left), sympathetic chain ganglia (middle) and inferior mesenteric ganglia (right) in adult rats 3 weeks post expression (n≥2 per group, scale bar: 100 μm). C. Representative images of MaCPNS1 vector-mediated tdTomato (red) expression in DRG (left) and TG (right). The tissues were co-stained with either αNF200 (cyan), αCGRP (yellow), or αTRPV1 (blue) markers (scale bars: 100 μm). D. Quantification of proportion of AAV-mediated tdTomato expressing cells that overlap with αNF200, αCGRP and αTRPV1 markers in TG (above) and DRG (below), and E. proportion of αNF200 marker+ cells that overlap with the AAV-mediated tdTomato expressing cells in DRG and TG (n≥2 per group, each data point represents the average of at least 3 images from each rat, mean ± s.e.m is plotted for n>2, mean is plotted for n=2). F. Representative images of MaCPNS1 and MaCPNS2 vector-mediated tdTomato expression across different segments of the GI tract: jejunum, ileum, proximal colon and distal colon (scale bar: 200 μm). G. Representative images of MaCPNS1 vector-mediated tdTomato expression in the spinal cord (above, scale bar: 500 μm) with zoomed-in views of selected areas (white boxes, right, scale bar: 100 μm), and hindbrain (below, scale bar: 2 mm) with zoomed-in view of Sp5O region (scale bar: 100 μm). The tissues were co-stained with αNeuN (blue) antibodies.
Figure 5:
Figure 5:. Engineered AAVs can efficiently transduce the central and peripheral nervous system in marmoset
A. Illustration of AAV vector delivery to adult marmoset to study transduction across the CNS and PNS after 3 weeks of expression. The capsids (AAV9/MaCPNS1/MaCPNS2) and their corresponding genomes (ssAAV:CAG-eGFP/tdTomato) are shown on the left. Two AAV vectors packaged with colored fluorescent reporters were mixed and intravenously delivered at a total dose of 7×10¹³ vg/kg per adult marmoset (16 month old Callithrix jacchus, i.e. 3.5×10¹³ vg/kg per AAV). Representative images of marmoset B., DRGs (scale bar: 200 μm, left and 500 μm, right), C., small intestine (scale bar: 500 μm, left and 100 μm, right), D., fibers in the dorsal column of the spinal cord (scale bar: 500 μm), E., coronal brain sections of midbrain (left) and hindbrain (right) (scale bar: 500 μm), and F., select brain areas: cortex, thalamus, globus pallidus, cerebellum and brainstem (scale bar: 400 μm), showing AAV9 vector-mediated expression of eGFP (green) or tdTomato (red), MaCPNS1-mediated expression of eGFP (green) and MaCPNS2-mediated expression of tdTomato (red). The images are matched in fluorescence intensity to the respective AAV9 control. Zoomed-in views of selected areas (dotted white boxes) are shown on the right in B. and C. In B. the zoomed-in view shows the overlap of MaCPNS1 and MaCPNS2-mediated expression with the neuronal marker Tuj1 (blue).
Figure 6:
Figure 6:. Engineered variants efficiently target the central and peripheral nervous system in macaque following systemic delivery
A. Illustration of AAV vector delivery to macaque to study transduction across the CNS and PNS after 4 weeks of expression. The capsids (AAV9/MaCPNS1/MaCPNS2) and their corresponding genomes (ssAAV:CAG-eGFP/tdTomato) are shown on the left. Two AAVs packaged with different fluorescent proteins were mixed and intravenously injected at a dose of 5×10¹³ vg/kg per macaque (Macaca mulatta, injected within 10 days of birth, female, i.e. 2.5×10¹³ vg/kg per AAV). Representative images of macaque B., GI regions of esophagus (top panel) and colon (bottom panel) (scale bar: 500 μm, left and 200 μm, right), C., DRGs (scale bar: 200 μm), D., spinal cord (scale bar: 500 μm, top and 200 μm, bottom), E., coronal sections of forebrain, hindbrain and cerebellum (scale bar: 2 mm), and F., selected brain areas: cortex, hippocampus, putamen, and brainstem (scale bar: 200 μm, top and 500 μm, bottom), showing AAV9 vector-mediated expression of eGFP (green), MaCPNS1-mediated expression of eGFP (green) and MaCPNS2-mediated expression of tdTomato (red). The eGFP images of MaCPNS1 are matched in fluorescence intensity to the AAV9 control. The zoomed-in views in B (right panels) show the overlap of MaCPNS2-mediated expression of tdTomato (red) with the neuronal marker Tuj1 (yellow). The zoomed-in views in D (bottom panels) show AAV-mediated expression of eGFP (green) and tdTomato (red) in the fibers in the dorsal column (white dashed boxes).

References

    1. Ali Hossamaldein Gaber, Ibrahim Khalid, Elsaid Mahmoud Fawzi, Mohamed Reem Babiker, Abeidah Mahmoud I. A., Al Rawwas Azhar Othman, Elshafey Khaled, et al. 2021. “Gene Therapy for Spinal Muscular Atrophy: The Qatari Experience.” Gene Therapy, July, 1–5. 10.1038/s41434-021-00273-7. - DOI - PMC - PubMed
    1. Asencor Andoni I., Dvoryanchikov Gennady, Tsoulfas Pantelis, and Chaudhari Nirupa. 2021. “AAV-PHP.S-Mediated Delivery of Reporters to Cranial Ganglion Sensory Neurons.” 10.1101/2021.09.14.460327. - DOI
    1. Batista Ana Rita, King Oliver D., Reardon Christopher P., Davis Crystal, Shankaracharya null, Philip Vivek, Gray-Edwards Heather, et al. 2020. “Ly6a Differential Expression in Blood-Brain Barrier Is Responsible for Strain Specific Central Nervous System Transduction Profile of AAV-PHP.B.” Human Gene Therapy 31 (1–2): 90–102. 10.1089/hum.2019.186. - DOI - PubMed
    1. Bedbrook Claire N., Deverman Benjamin E., and Gradinaru Viviana. 2018. “Viral Strategies for Targeting the Central and Peripheral Nervous Systems.” Annual Review of Neuroscience 41 (1): 323–48. 10.1146/annurev-neuro-080317-062048. - DOI - PubMed
    1. Bedbrook Claire N., Yang Kevin K., Robinson J. Elliott, Mackey Elisha D., Gradinaru Viviana, and Arnold Frances H.. 2019. “Machine Learning-Guided Channelrhodopsin Engineering Enables Minimally-Invasive Optogenetics.” Nature Methods 16 (11): 1176–84. 10.1038/s41592-019-0583-8. - DOI - PMC - PubMed

Publication types