. 2022 Jul;36(7):1887-1897.
doi: 10.1038/s41375-022-01597-y. Epub 2022 May 28.

Clonal evolution after treatment pressure in multiple myeloma: heterogenous genomic aberrations and transcriptomic convergence

Affiliations

Clonal evolution after treatment pressure in multiple myeloma: heterogenous genomic aberrations and transcriptomic convergence

Kristine Misund et al. Leukemia. 2022 Jul.

Abstract

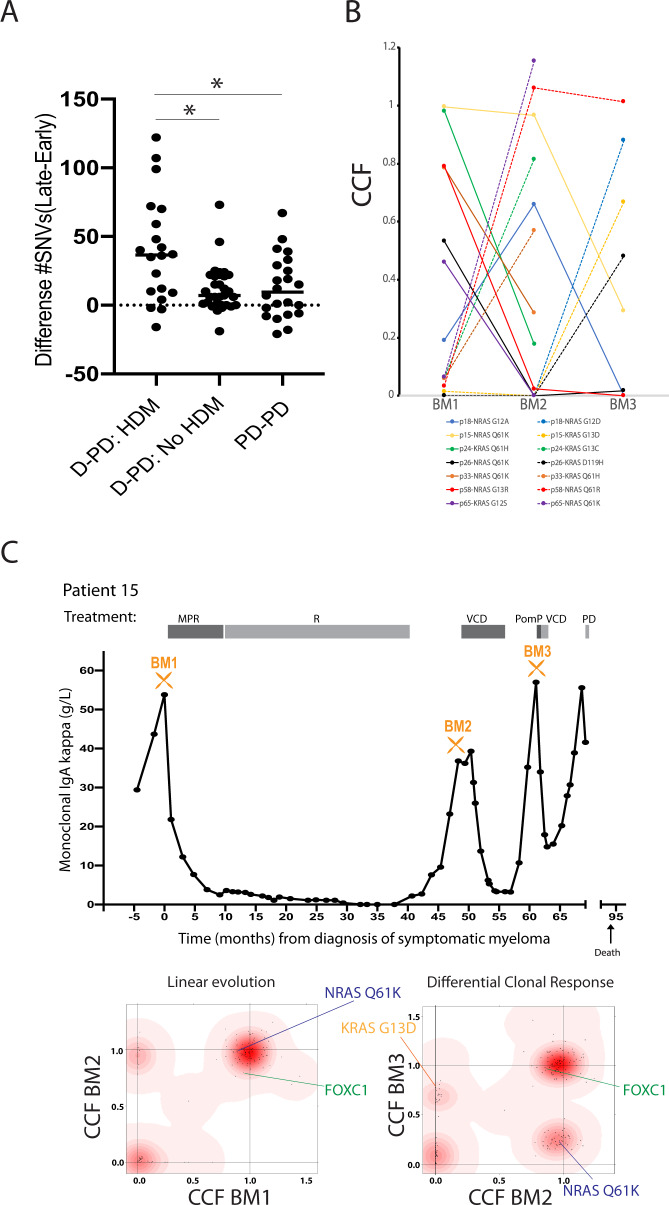
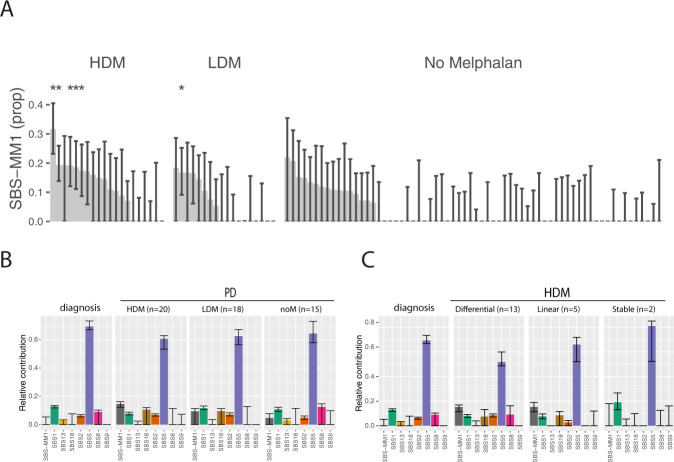
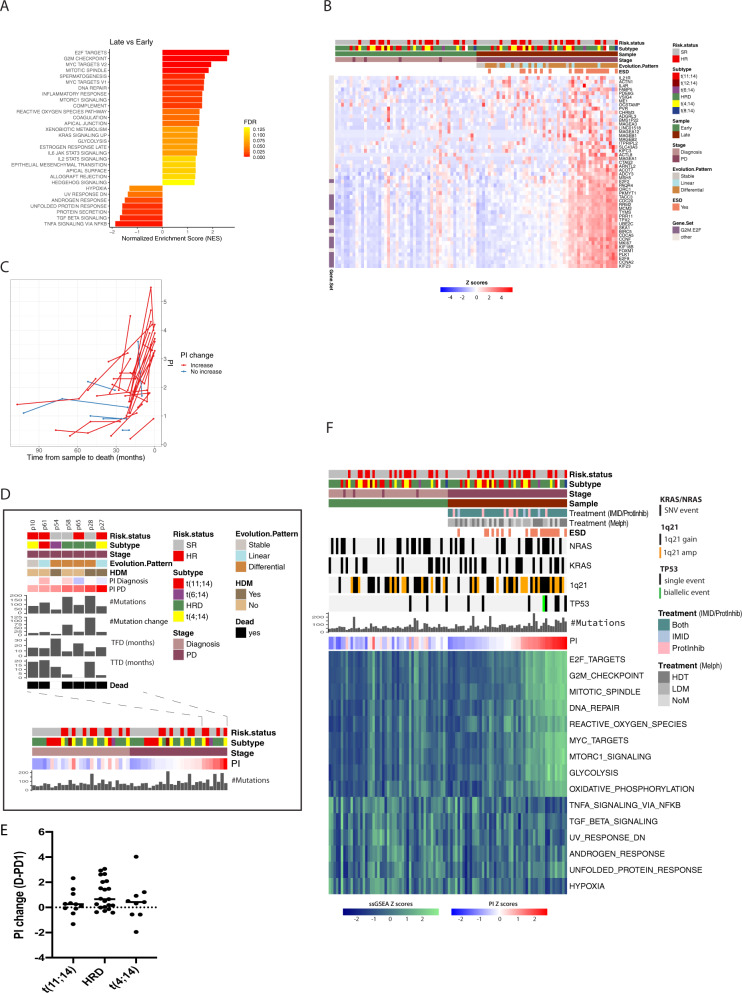
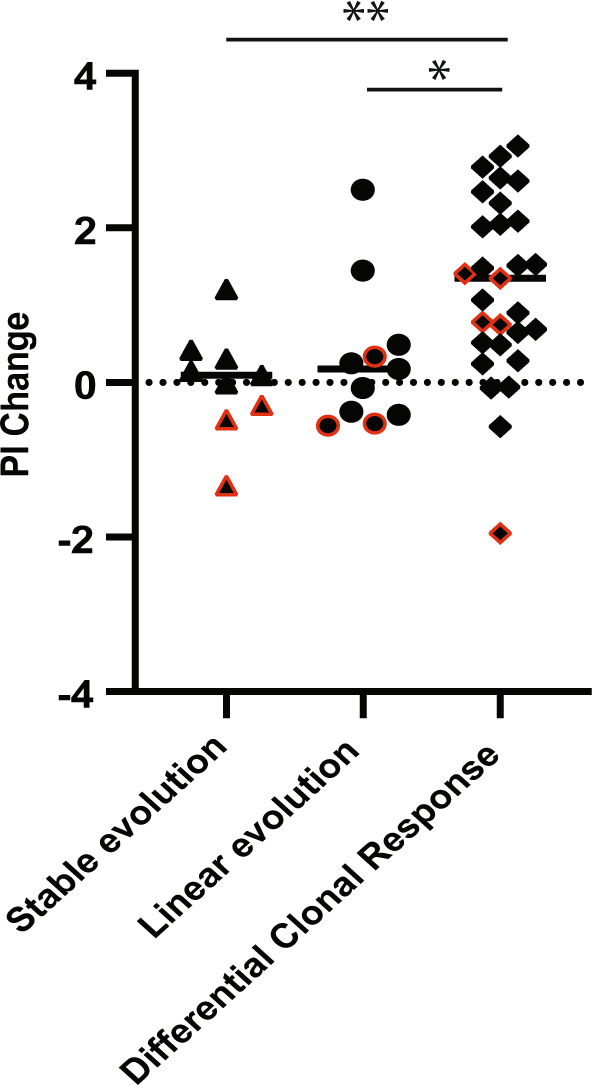
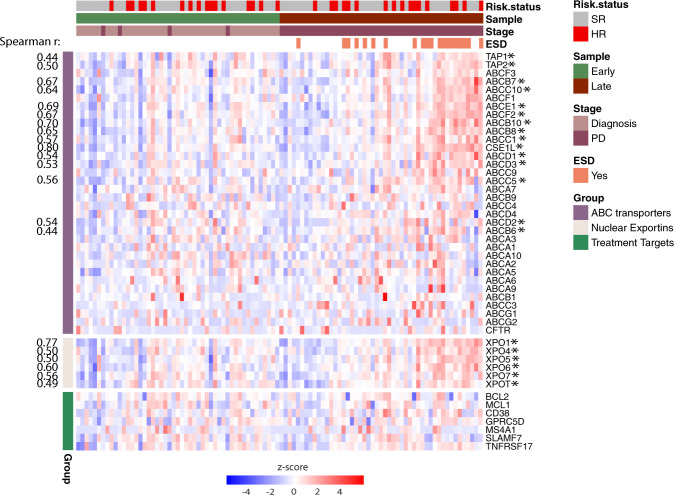
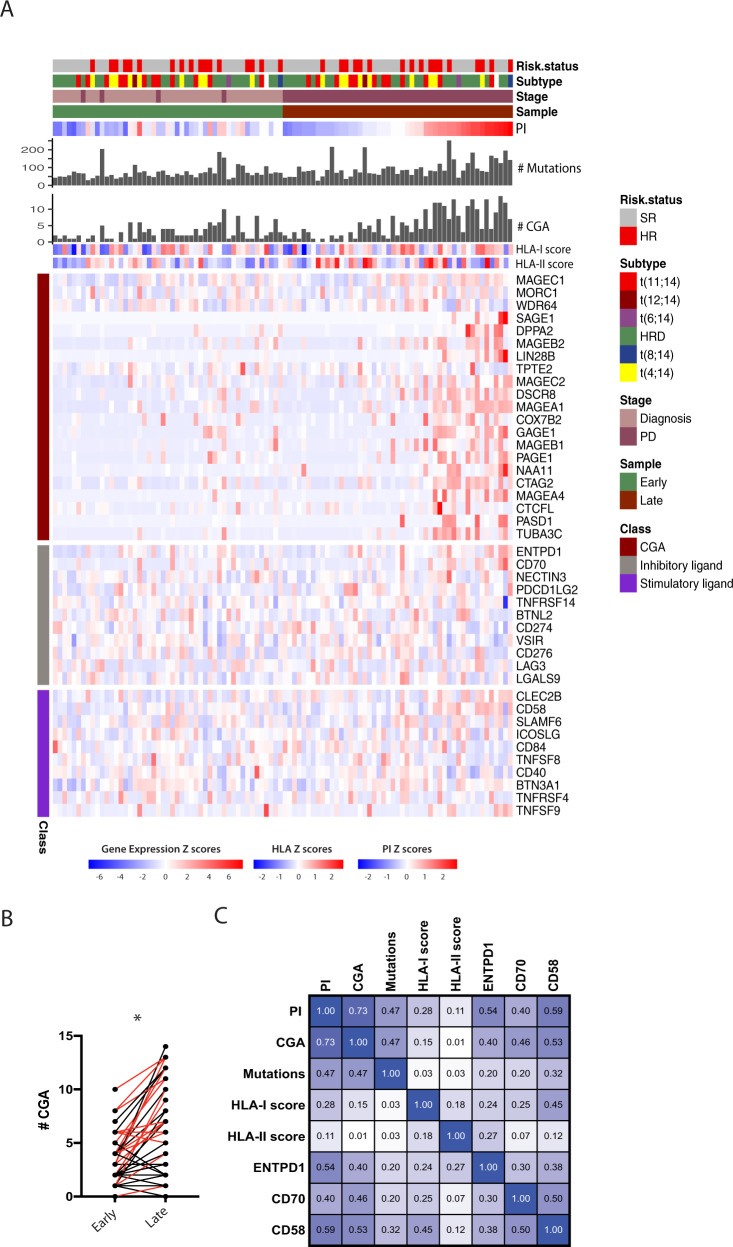
We investigated genomic and transcriptomic changes in paired tumor samples of 29 in-house multiple myeloma (MM) patients and 28 patients from the MMRF CoMMpass study before and after treatment. A change in clonal composition was found in 46/57 (82%) of patients, and single-nucleotide variants (SNVs) increased from median 67 to 86. The highest increase in prevalence of genetic aberrations was found in RAS genes (60% to 72%), amp1q21 (18% to 35%), and TP53 (9% to 18%). The SBS-MM1 mutation signature was detected both in patients receiving high and low dose melphalan. A total of 2589 genes were differentially expressed between early and late samples (FDR < 0.05). Gene set enrichment analysis (GSEA) showed increased expression of E2F, MYC, and glycolysis pathways and a decreased expression in TNF-NFkB and TGFbeta pathways in late compared to early stage. Single sample GSEA (ssGSEA) scores of differentially expressed pathways revealed that these changes were most evident in end-stage disease. Increased expression of several potentially targetable genes was found at late disease stages, including cancer-testis antigens, XPO1 and ABC transporters. Our study demonstrates a transcriptomic convergence of pathways supporting increased proliferation and metabolism during disease progression in MM.


Conflict of interest statement

The authors declare no competing interests.

Figures

Fig. 1
Fig. 1. Increased mutation load and clonal evolution during the myeloma disease course.
A Increase in number of mutations in samples taken at PD. There was a particular increase in patients that had received HDM (*p < 0.05, Kruskal–Wallis test). D diagnosis (start of treatment), PD: progressive disease, HDM: high-dose melphalan. For Diagnosis-PD pairs the first available PD sample was used in the analysis. B Alternating dominance in myeloma clones harboring RAS mutations. In all 7 patients with decreased clonal fraction of mutated KRAS/NRAS genes, another NRAS/KRAS mutation appeared. C Overview of treatment and M component in patient 15. Below is shown the estimated clonal composition from the DPclust analysis. The patient had a RAS shift. Also see Table S5 and Fig S3. CCF Cancer Cell Fraction, M Melphalan, R Revlimid, V Velcade, C Cyclophosphamide, Pom Pomalidomide, P Prednisolon, D Dexamethasone.
Fig. 2
Fig. 2. Mutational signatures after treatment with Melphalan.
A Estimated SBS-MM1 contribution with 95% CI for individual patients. Only patients exposed to melphalan showed evidence of significant SBS-MM1 contribution. *statistically significant transcriptional strand bias in the typical pattern for SBS-MM1: C > T mutations in the trinucleotide contexts CCA, GCA, GCC, GCG, and GCT. B Mutation signature patterns at diagnosis versus PD divided into HDM (high dose melphalan), LDM (low dose melphalan) or noM (no melphalan) groups. C Mutational signature analysis of diagnosis samples and samples receiving HDM based on their evolutional pattern.
Fig. 3
Fig. 3. Increased expression of genes involved in proliferative and metabolic pathways at progression.
A GSEA analysis using hallmark gene sets showed that 23 pathways were upregulated and 7 downregulated (FDR q-value<0.2, NES > 1.3) at late stage (latest available PD sample) versus early (1st sample). The top upregulated pathways were E2F targets and G2M checkpoint involved in cell division and cell cycle. FDR: False discovery rate. B Heatmap showing the top 50 upregulated genes and their expression levels (log2(TPM + 1), z scored) in early and late samples. C The figure shows the evolvement in proliferative index (PI) between early and late samples in deceased patients. There was significant increase in PI in end-stage disease. D The figure shows diagnosis-1st PD paired samples, and shows that patients with high PI at 1st PD have different cytogenetic backgrounds. Mutation load and increase from diagnosis, time from diagnosis (TFD), and time to death/last control (TTD) are shown for patients with high PI at 1st PD. E There was no significant difference in PI increase in diagnosis-first available PD sample between cytogenetic subgroups. This did not change when dividing the HRD group into cyclinD1 or cyclinD2 expressers (Fig. S6). CCND2, CCND3 and MAFs were not included due to few samples. F Heatmap for selected pathways showing ssGSEA for early-late pairs. Information on mutation load and presence of the most frequently enriched/acquired genomic aberrations at PD (KRAS, NRAS, amp1q21, and TP53) as well as intervening treatment received between the two BM sample timepoints are shown. In heatmaps patients are sorted horizontally by increasing PI of the late samples (right half) and the same patient order is used for the early samples (left half). SR standard risk according to ISS/R-ISS, HR High risk, ESD End-stage disease (<12 months from death). Cytogenetic subgroups; t(11;14)/CCND1, t(12;14)/ CCND2, t(6;14)/CCND3, t(4;14)/WHSC1(NSD2/MMSET), t(8;14)/MAFA are shown (Table S12). IMID Immunomodulatory drug, ProtInhib Proteasome inhibitor.
Fig. 4
Fig. 4. Changes in PI between late and early samples grouped by clonal evolutionary patterns.
The figure indicates that most samples that have a change in their PI also have a change in their clonal composition of the malignant cells (*p < 0.05, Kruskal–Wallis test). Each black dot represents a patient, red border indicates top 25% PI in the earliest sample.
Fig. 5
Fig. 5. Increased expression of ABC transporters and exportins in PD samples.
Heatmap showing expression levels (log2(TPM + 1), z scored) of ABC transporter genes, nuclear exportins, and other treatment relevant targets in early and late samples. Genes with Spearman correlation >0.4 are marked with a * and correlation value shown to the left, all having p < 1x10e−5. Patients are sorted horizontally by increasing PI of the late samples (right half) and the same patient order is used for the early samples (left half). SR standard risk according to ISS/R-ISS, HR High risk, ESD End-stage disease (<12 months from death).
Fig. 6
Fig. 6. Cancer Germline Antigens and a few immune regulators increased during disease progression.
A Heatmap showing the number and expression levels of CGAs in early and late samples, HLA scores, and selected inhibitory and stimulatory ligands/receptors. CGAs with expression >10 TPM in >1 sample were included in the heatmap. Patients are sorted horizontally by increasing PI of the late samples (right half) and the same patient order is used for the early samples (left half). B Number of expressed CGAs (TPM > 2) in paired early-late (latest available PD) samples increases significantly in the late samples (p < 0.0001, Wilcoxon rank test). Red color: paired samples including end-stage disease sample. See also Fig S10. C Correlation plot of PI, CGA, mutation load, and HLA scores. Inhibitory and stimulatory receptors from A, with correlation above 0.45 (Spearman r) to either PI or CGA, are included. All correlations >0.45 have p-value <1x10e−5. SR: standard risk according to ISS/R-ISS, HR: High risk.

References

    1. Bolli N, Avet-Loiseau H, Wedge DC, Van Loo P, Alexandrov LB, Martincorena I, et al. Heterogeneity of genomic evolution and mutational profiles in multiple myeloma. Nat Commun. 2014;5:2997. doi: 10.1038/ncomms3997. - DOI - PMC - PubMed
    1. Chapman MA, Lawrence MS, Keats JJ, Cibulskis K, Sougnez C, Schinzel AC, et al. Initial genome sequencing and analysis of multiple myeloma. Nature. 2011;471:467–72. doi: 10.1038/nature09837. - DOI - PMC - PubMed
    1. Lohr JG, Stojanov P, Carter SL, Cruz-Gordillo P, Lawrence MS, Auclair D, et al. Widespread genetic heterogeneity in multiple myeloma: implications for targeted therapy. Cancer Cell. 2014;25:91–101. doi: 10.1016/j.ccr.2013.12.015. - DOI - PMC - PubMed
    1. Maura F, Bolli N, Angelopoulos N, Dawson KJ, Leongamornlert D, Martincorena I, et al. Genomic landscape and chronological reconstruction of driver events in multiple myeloma. Nat Commun. 2019;10:3835. doi: 10.1038/s41467-019-11680-1. - DOI - PMC - PubMed
    1. Walker BA, Mavrommatis K, Wardell CP, Ashby TC, Bauer M, Davies FE, et al. Identification of novel mutational drivers reveals oncogene dependencies in multiple myeloma. Blood. 2018;132:587–97. doi: 10.1182/blood-2018-03-840132. - DOI - PMC - PubMed

Publication types