. 2022 Jul:506:113290.
doi: 10.1016/j.jim.2022.113290. Epub 2022 May 27.

Combined analysis of T cell activation and T cell-mediated cytotoxicity by imaging cytometry

Affiliations

Combined analysis of T cell activation and T cell-mediated cytotoxicity by imaging cytometry

Monica K Chanda et al. J Immunol Methods. 2022 Jul.

Abstract

Immunotherapies for the treatment of cancer have spurred the development of new drugs that seek to harness the ability of T cells to recognize and kill malignant cells. There is a substantial need to evaluate how these experimental drugs influence T cell functional outputs in co-culture systems that contain cancerous cells. We describe an imaging cytometry-based platform that can simultaneously quantify activated T cells and the capacity of these T cells to kill cancer cells. Our platform was developed using the Nur77-GFP reporter system because GFP expression provides a direct readout of T cell activation that is induced by T cell antigen receptor (TCR) signaling. We combined the Nur77-GFP reporter system with a cancer cell line that displays a TCR-specific antigen and evaluated the relationship between T cell activation and cancer cell death. We demonstrate that imaging cytometry can be used to quantify the number of activated cytotoxic CD8+ T cells (CTLs) and the capacity of these CTLs to recognize and kill adherent MC38 cancer cells. We tested whether this platform could evaluate heterogenous lymphocyte populations by quantifying the proportion of antigen-specific activated T cells in co-cultures that contain unresponsive lymphocytes. The effects of a SRC family kinase inhibitor on CTL activation and MC38 cell death were also determined. Our findings demonstrate that the Nur77-GFP reporter system can be used to evaluate the effects of diverse treatment conditions on T cell-cancer co-cultures in a microtiter plate-based format by imaging cytometry. We anticipate the combined analysis of T cell activation with T cell-mediated cancer cell death can be used to rapidly assess immuno-oncology drug candidates and T cell-based therapeutics.

Keywords: Cancer; Imaging cytometry; Immuno-oncology; Nur77-GFP; T cell activation; T cell-mediated cytotoxicity.


Conflict of interest statement

Declaration of Competing Interest

The authors declare no competing interests.

Figures

Fig. 1.
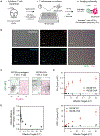
Fig. 1.
Quantification of T cell activation by imaging cytometry. (A) Schematic illustrating workflow for the quantification of activated T cells using the Nur77-GFP reporter. (B) Representative microscopy images of T cells treated with anti-CD3ε agonist and analysis of GFP+ and GFP− populations. Scale bars represent 50 μm. (C) Contour plots depicting GFP+ cells identified by imaging cytometry. (B–C) Data are representative of 4 independent replicates. (D) Quantification of GFP+ activated T cells over a range of anti-CD3ε concentrations in the presence or absence of an anti-CD28 co-stimulatory antibody. Four technical replicates were performed for each treatment condition. Error bars represent the standard deviation of three independent experiments (biological replicates, n = 3). Samples were compared by two-way ANOVA analysis (interaction, p < 0.005; sample and concentration, p < 0.0001).
Fig. 2.
Fig. 2.
Quantification of CTL activation and T cell-mediated cytotoxicity by imaging cytometry. (A) Schematic illustrating the workflow for analysis of OT-I CTLs and MC38-OVA co-cultures using the Nur77-GFP reporter. (B) Representative images of OT-I CTLs co-cultured with antigen-bearing MC38-OVA cells, and analysis of GFP+ and PI+ populations. Scale bars represent 100 μm. (C) Contour plots depicting GFP+ and PI+ cells identified by imaging cytometry (E:T ratio of 1.25:1). (B–C) Data are representative of 4 independent replicates. (D) Quantification of activated T cells (GFP+) and dead cells (PI+) at several effector-to-target ratios (E:T). (E) The extent of MC38 cell death was plotted as a function of the number of CTLs in the co-culture. The E:T ratios tested were 5:1, 2.5:1, 1.25:1, 0.625:1, 0.313:1, 0.156, 0.078:1. Four technical replicates were performed for each treatment condition. Error bars represent the standard deviation from three independent experiments (biological replicates, n = 3).
Fig. 3.
Fig. 3.
Quantification of activated CTLs in mixed lymphocyte-cancer co-cultures. (A) Schematic illustrating workflow for analysis of OT-I CTLs and MC38-OVA co-cultures using the Nur77-GFP reporter. Decoy splenocytes were incorporated into co-cultures to assess the proportion of activated CTLs. (B) Quantification of the number of activated T cells (GFP+) and the number of activated (GFP+) T cells to total cells. (C) Quantification of the number of dead cells (PI+) and the dead cells (PI+) to total cells. Three technical replicates were performed for each treatment condition. Error bars represent the standard deviation from three independent experiments (biological replicates, n = 3).
Fig. 4.
Fig. 4.
Analysis of TCR signaling inhibitor PP2. (A) Pilot experiment depicting PP2 dose-response. Error bars represent standard deviation of three technical replicates. (B) Dose-response of activated CTLs (GFP+) and proportion of dead cells (PI+) following treatment with PP2. Three technical replicates were performed for each treatment condition. Error bars represent the standard error of measurement from three independent experiments (biological replicates, n = 3).

References

    1. Alizadeh D, Wong RA, Yang X, Wang D, Pecoraro JR, Kuo CF, Aguilar B, Qi Y, Ann DK, Starr R, et al., 2019. IL15 enhances CAR-T cell antitumor activity by reducing mTORC1 activity and preserving their stem cell memory phenotype. Cancer Immunol. Res 7, 759–772. 10.1158/2326-6066.CIR-18-0466. - DOI - PMC - PubMed
    1. Ashouri JF, Weiss A, 2017. Endogenous Nur77 is a specific Indicator of antigen receptor signaling in human T and B cells. J. Immunol 198, 657–668. 10.4049/jimmunol.1601301. - DOI - PMC - PubMed
    1. Au-Yeung BB, Zikherman J, Mueller JL, Ashouri JF, Matloubian M, Cheng DA, Chen Y, Shokat KM, Weiss A, 2014. A sharp T-cell antigen receptor signaling threshold for T-cell proliferation. Proc. Natl. Acad. Sci. U. S. A 111, E3679–E3688. 10.1073/pnas.1413726111. - DOI - PMC - PubMed
    1. Au-Yeung BB, Smith GA, Mueller JL, Heyn CS, Jaszczak RG, Weiss A, Zikherman J, 2017. IL-2 modulates the TCR signaling threshold for CD8 but not CD4 T cell proliferation on a single-cell level. J. Immunol 198, 2445–2456. 10.4049/jimmunol.1601453. - DOI - PMC - PubMed
    1. Caruso A, Licenziati S, Corulli M, Canaris AD, De Francesco MA, Fiorentini S, Peroni L, Fallacara F, Dima F, Balsari A, Turano A, 1997. Flow cytometric analysis of activation markers on stimulated T cells and their correlation with cell proliferation. Cytometry 27, 71–76. 10.1002/(sici)1097-0320(19970101)27:1<71::aid-cyto9>3.0.co;2-o. - DOI - PubMed

Publication types

Substances