. 2022 May 11:16:848737.
doi: 10.3389/fnins.2022.848737. eCollection 2022.

EEG Microstate-Specific Functional Connectivity and Stroke-Related Alterations in Brain Dynamics

Affiliations

EEG Microstate-Specific Functional Connectivity and Stroke-Related Alterations in Brain Dynamics

Zexuan Hao et al. Front Neurosci. .

Abstract

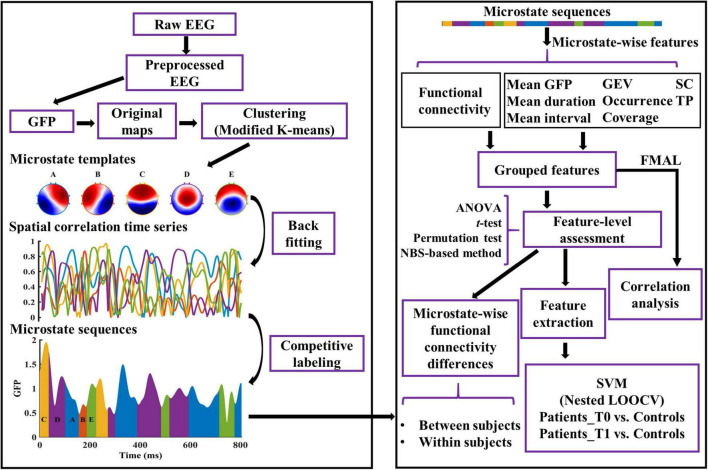
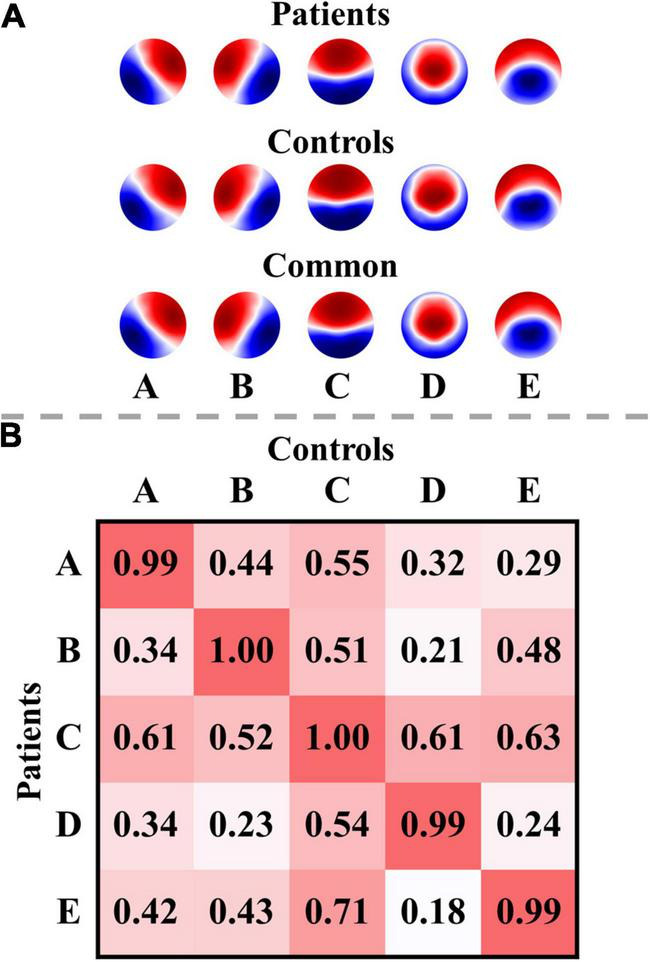
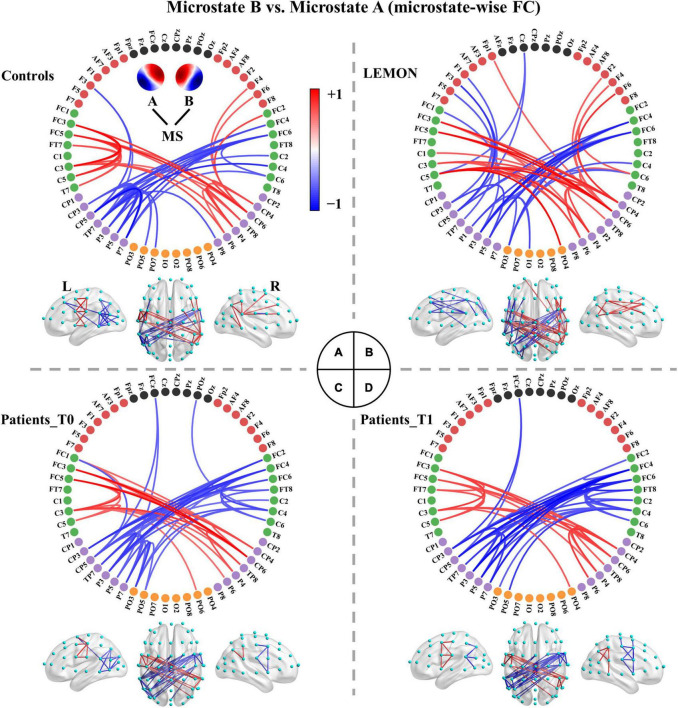
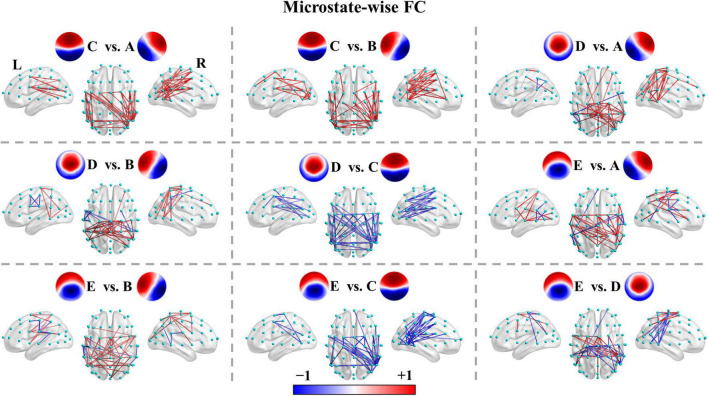
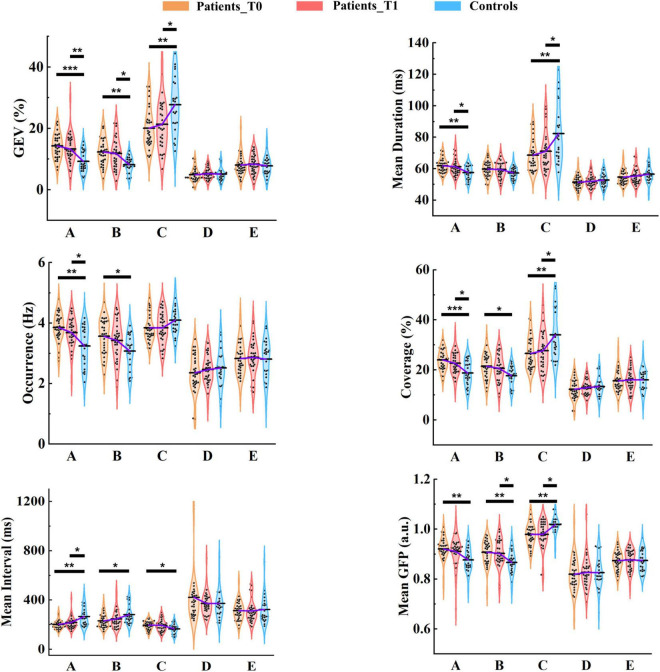
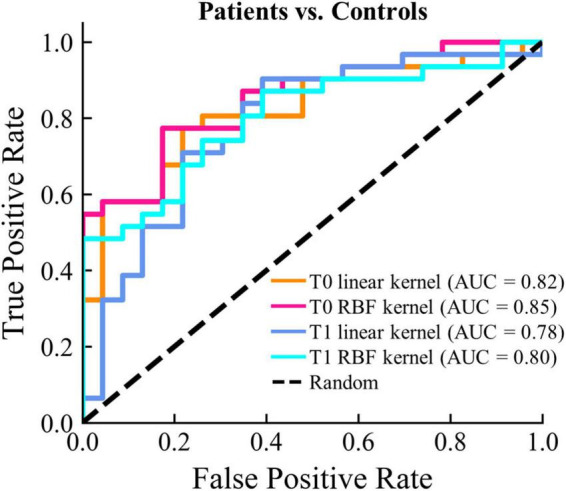
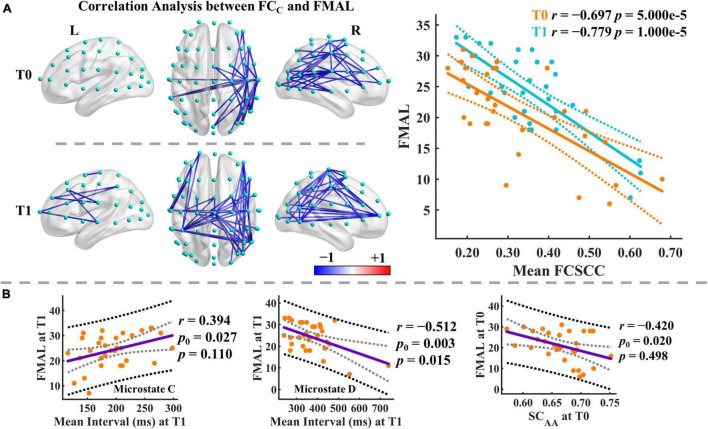
The brain, as a complex dynamically distributed information processing system, involves the coordination of large-scale brain networks such as neural synchronization and fast brain state transitions, even at rest. However, the neural mechanisms underlying brain states and the impact of dysfunction following brain injury on brain dynamics remain poorly understood. To this end, we proposed a microstate-based method to explore the functional connectivity pattern associated with each microstate class. We capitalized on microstate features from eyes-closed resting-state EEG data to investigate whether microstate dynamics differ between subacute stroke patients (N = 31) and healthy populations (N = 23) and further examined the correlations between microstate features and behaviors. An important finding in this study was that each microstate class was associated with a distinct functional connectivity pattern, and it was highly consistent across different groups (including an independent dataset). Although the connectivity patterns were diminished in stroke patients, the skeleton of the patterns was retained to some extent. Nevertheless, stroke patients showed significant differences in most parameters of microstates A, B, and C compared to healthy controls. Notably, microstate C exhibited an opposite pattern of differences to microstates A and B. On the other hand, there were no significant differences in all microstate parameters for patients with left-sided vs. right-sided stroke, as well as patients before vs. after lower limb training. Moreover, support vector machine (SVM) models were developed using only microstate features and achieved moderate discrimination between patients and controls. Furthermore, significant negative correlations were observed between the microstate-wise functional connectivity and lower limb motor scores. Overall, these results suggest that the changes in microstate dynamics for stroke patients appear to be state-selective, compensatory, and related to brain dysfunction after stroke and subsequent functional reconfiguration. These findings offer new insights into understanding the neural mechanisms of microstates, uncovering stroke-related alterations in brain dynamics, and exploring new treatments for stroke patients.

Keywords: EEG; brain dynamics; functional connectivity; lower extremity motor function; machine learning; microstates; stroke.


Conflict of interest statement

The authors declare that the research was conducted in the absence of any commercial or financial relationships that could be construed as a potential conflict of interest.

Figures

FIGURE 1
FIGURE 1
Graphical representation of the analysis method in the study. The microstate templates used in this study are common templates of patients and healthy controls. See “Materials and Methods” section for details. GFP, Global Field Power; GEV, Global Explained Variance; SC, Spatial Correlation metric; TP, Transition Probability; FMAL, Lower-extremity part of Fugl-Meyer Assessment; SVM, Support Vector Machine; LOOCV, Leave-One-Out Cross-Validation.
FIGURE 2
FIGURE 2
Microstate templates and spatial correlations. (A) Microstate templates. (B) Spatial correlations between the microstate templates of patients and controls. Polarity was ignored when computing the correlations. The templates of the patients were calculated from all their EEG data at T0 and T1.
FIGURE 3
FIGURE 3
Comparisons between functional connectivity of microstates A and B for the four groups. (A) Healthy controls. (B) LEMON. (C) Patients at T0. (D) Patients at T1. For visual clarity, only the top 50 connections (according to absolute t-values) in the connected components with significant differences (p < 0.05, NBS-based method corrected) are displayed in the figure. The red color indicates greater connectivity for microstate B vs. microstate A, while the blue color indicates greater connectivity for microstate A vs. microstate B. Color depth represents the size of the connection difference (t-value). The complete connected components are provided in the first column of Supplementary Figure 3.
FIGURE 4
FIGURE 4
Microstate-wise functional connectivity comparisons in healthy controls. For X vs. Y, the red color indicates greater connectivity for microstate X vs. microstate Y, while the blue color indicates greater connectivity for microstate Y vs. microstate X. Color depth represents the size of the connection difference (t-value). For visual clarity, only the top 50 connections (according to absolute t-values) of the connected components with significant differences (p < 0.05, NBS-based method corrected) are displayed in the figure. The complete significant connected components of the four groups are shown in the first column of Supplementary Figures 4–12.
FIGURE 5
FIGURE 5
Results of microstate parameter analysis for patients and controls. Post hoc pairwise comparisons (patients at T0 vs. controls; patients at T1 vs. controls) were performed for GEV, mean duration, occurrence, coverage, mean interval, and mean GFP. The means of the three groups for each microstate class are linked by the solid purple line. *p < 0.05; **p < 0.01; ***p < 0.001.
FIGURE 6
FIGURE 6
Classifications results between patients and controls. The ROC curve and the corresponding AUC for each classification model are displayed.
FIGURE 7
FIGURE 7
Results of correlation analysis. (A) Correlation analysis between the functional connectivity of microstate C and FMAL score. Only the significant connected components are displayed. Mean FCSCC refers to the mean of the functional connectivity strength within the significant connected component. The blue color indicates negative correlations between the connectivity of microstate C and the FMAL score. Color depth represents the size of the correlation coefficient. Dashed lines imply the 95% confidence intervals for the regression estimates. Pearson correlation coefficient (r) and the corresponding permutation-based p-value are given. (B) Correlation analysis between microstate parameters and FMAL score. The black and gray dashed lines indicate the 95% prediction and 95% confidence intervals, respectively. Pearson correlation coefficient (r) and the corresponding permutation-based p-value are given. p0 is the uncorrected p-value.

References

    1. Allen E. A., Damaraju E., Plis S. M., Erhardt E. B., Eichele T., Calhoun V. D. (2014). Tracking whole-brain connectivity dynamics in the resting state. Cereb. Cortex 24 663–676. 10.1093/cercor/bhs352 - DOI - PMC - PubMed
    1. Babayan A., Erbey M., Kumral D., Reinelt J. D., Reiter A. M. F., Robbig J., et al. (2019). A mind-brain-body dataset of MRI, EEG, cognition, emotion, and peripheral physiology in young and old adults. Sci. Data 6:180308. 10.1038/sdata.2018.308 - DOI - PMC - PubMed
    1. Bai Y., He J., Xia X., Wang Y., Yang Y., Di H., et al. (2021a). Spontaneous transient brain states in EEG source space in disorders of consciousness. NeuroImage 240:118407. 10.1016/j.neuroimage.2021.118407 - DOI - PubMed
    1. Bai Y., Lin Y., Ziemann U. (2021b). Managing disorders of consciousness: the role of electroencephalography. J. Neurol. 268 4033–4065. 10.1007/s00415-020-10095-z - DOI - PMC - PubMed
    1. Bian L., Cui T., Thomas Yeo B. T., Fornito A., Razi A., Keith J. (2021). Identification of community structure-based brain states and transitions using functional MRI. NeuroImage 244:118635. 10.1016/j.neuroimage.2021.118635 - DOI - PMC - PubMed

LinkOut - more resources