. 2022 May 4:13:816475.
doi: 10.3389/fpls.2022.816475. eCollection 2022.

Genetic Diversity in Nitrogen Fertiliser Responses and N Gas Emission in Modern Wheat

Affiliations

Genetic Diversity in Nitrogen Fertiliser Responses and N Gas Emission in Modern Wheat

Maria Oszvald et al. Front Plant Sci. .

Abstract

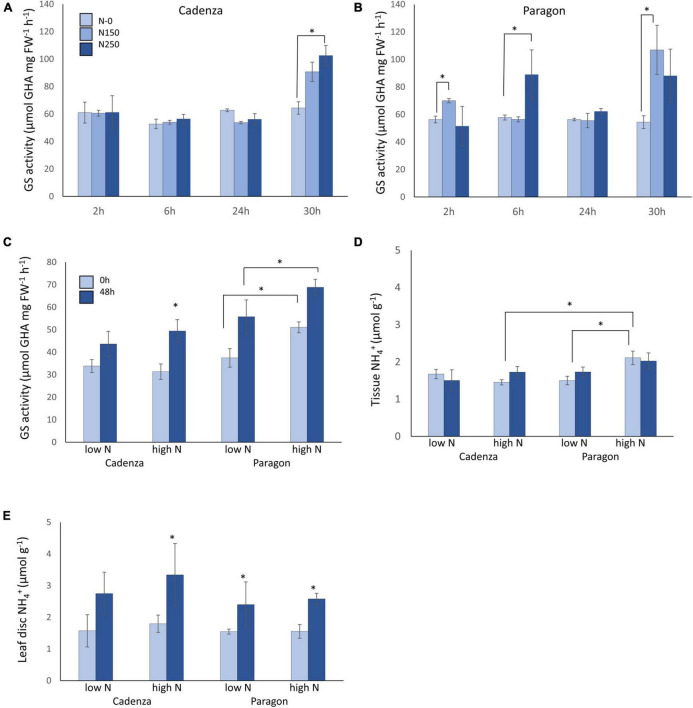
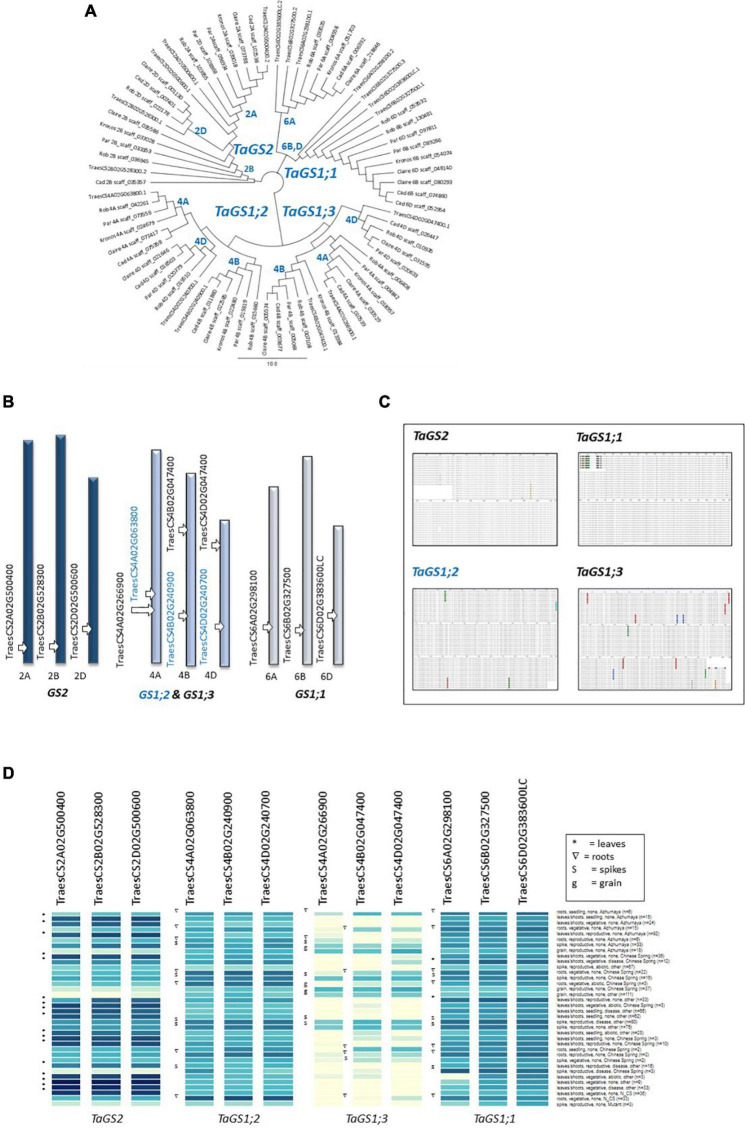
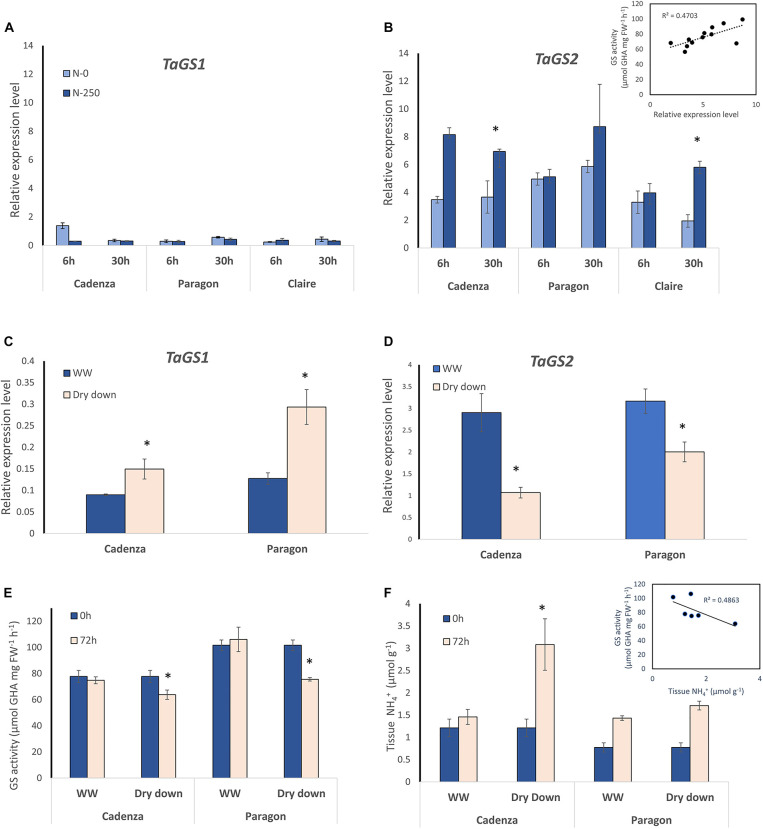
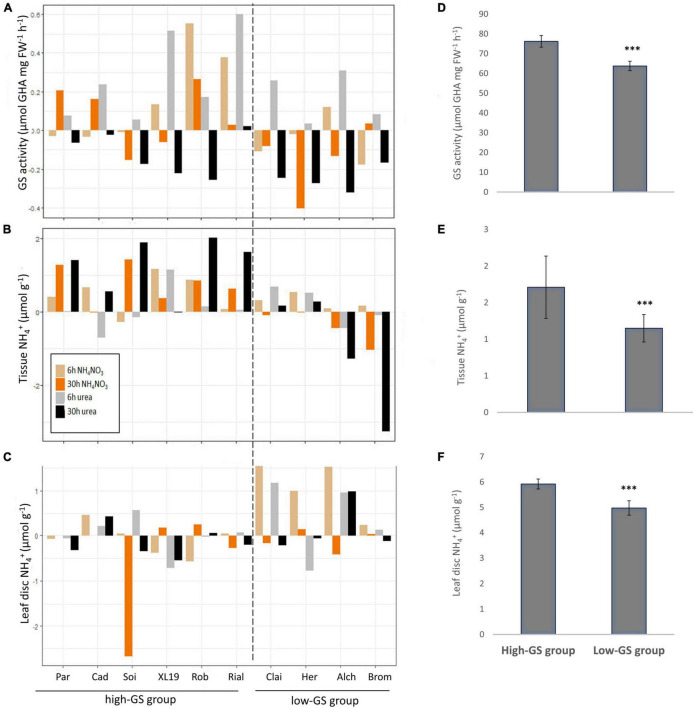
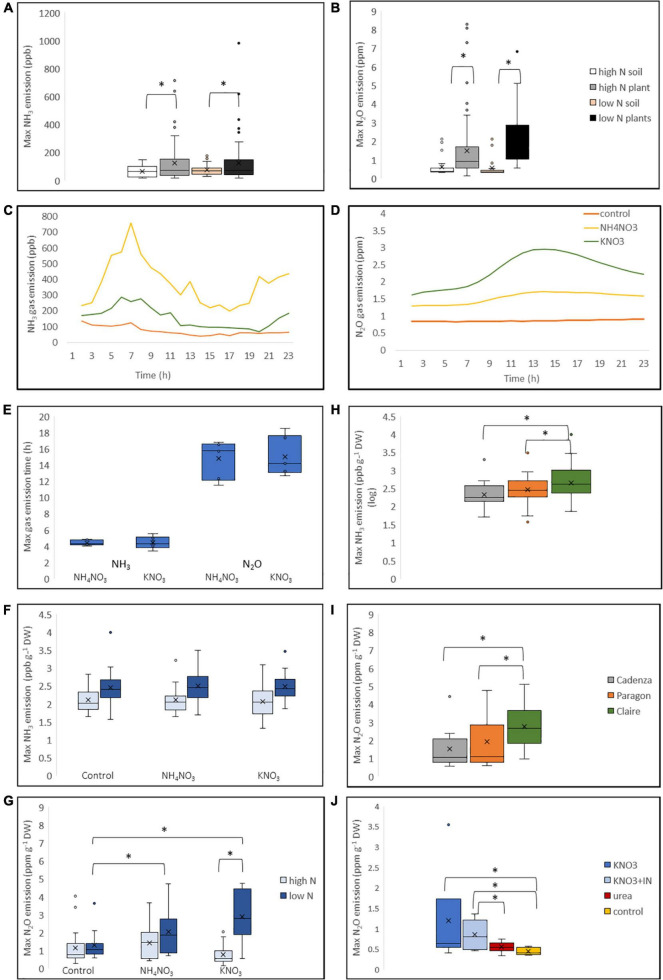
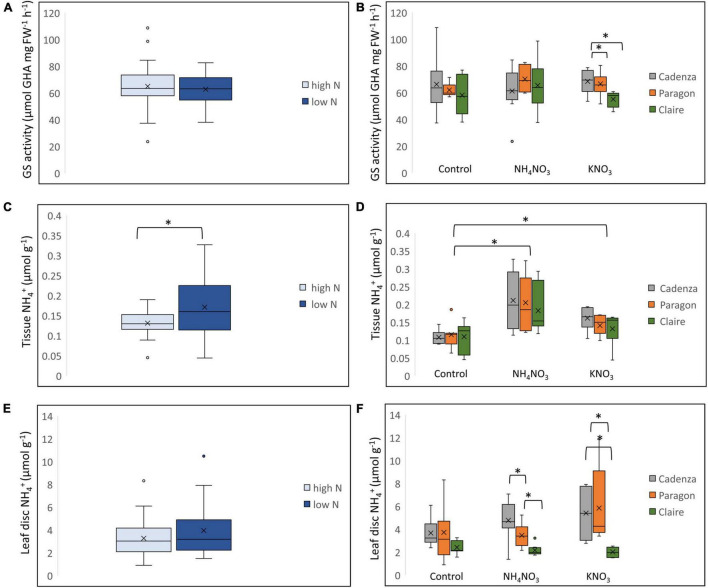
Crops assimilate nitrogen (N) as ammonium via the glutamine synthetase/glutamate synthase (GS/GOGAT) pathway which is of central importance for N uptake and potentially represents a bottle neck for N fertiliser-use efficiency. The aim of this study was to assess whether genetic diversity for N-assimilation capacity exists in wheat and could be exploited for breeding. Wheat plants rapidly, within 6 h, responded to N application with an increase in GS activity. This was not accompanied by an increase in GS gene transcript abundance and a comparison of GS1 and GS2 protein models revealed a high degree of sequence conservation. N responsiveness amongst ten wheat varieties was assessed by measuring GS enzyme activity, leaf tissue ammonium, and by a leaf-disc assay as a proxy for apoplastic ammonia. Based on these data, a high-GS group showing an overall positive response to N could be distinguished from an inefficient, low-GS group. Subsequent gas emission measurements confirmed plant ammonia emission in response to N application and also revealed emission of N2O when N was provided as nitrate, which is in agreement with our current understanding that N2O is a by-product of nitrate reduction. Taken together, the data suggest that there is scope for improving N assimilation capacity in wheat and that further investigations into the regulation and role of GS-GOGAT in NH3 emission is justified. Likewise, emission of the climate gas N2O needs to be reduced, and future research should focus on assessing the nitrate reductase pathway in wheat and explore fertiliser management options.

Keywords: N2O greenhouse gas; Triticum aestivum L; drought; genetic diversity; glutamine synthetase; nitrogen fertiliser.


Conflict of interest statement

The authors declare that the research was conducted in the absence of any commercial or financial relationships that could be construed as a potential conflict of interest.

Figures

FIGURE 1
FIGURE 1
Temporal response of wheat glutamine synthetase to N fertiliser under controlled and field conditions. The response of glutamine synthetase (GS) enzyme activity was measured in two bread wheat genotypes grown in fully fertilised (Osmocote slow-release fertiliser) potting mix. GS activity in leaf samples of Cadenza (A) and Paragon (B) was measured at four timepoints after application of NH4NO3, equivalent to 150 kg N ha–1 (N150) and 250 kg ha–1 (N250), respectively. Water was applied to control plants (N-0) and measured in parallel. Each value represents the mean ± SE of four biological replicates. The same genotypes were sampled from a long-term field experiment with plots adjusted to low (100 kg N ha–1) and high (350 kg N ha–1) total seasonal N application (see text for details). GS activity (C), tissue ammonium (D) and leaf-disc assay ammonium (E) were measured in leaf samples collected before (0 h) and at 48 h after the second split application of NH4SO4 fertiliser equivalent to 50 kg N ha–1 (low N plot) and 250 kg N ha–1 (high-N plot), respectively. Each value represents the mean ± SE of six biological replicates. Asterisks indicate significant differences between means (p < 0.05).
FIGURE 2
FIGURE 2
Comparison of glutamine synthetase genes in six wheat varieties. Sequences of the wheat GS1 and GS2 genes of the reference Chinese Spring reference genome were extracted from Ensembl Plants (https://plants.ensembl.org/Triticum_aestivum) and used as a query and template to extract genomic sequences from publicly available scaffolds and to predict GS1 and GS2 protein models in four bread wheat varieties (Cadenza, Paragon, Claire, and Robigus) and one durum wheat (Kronos) (see text for details; Supplementary Table 1). A comparison of the protein models is shown in the tree generated in Geneious (A). The gene IDs and chromosomal positions of the genes in the Chinese Spring reference genome are shown in (B). The high degree of conservation of the genes across the six analysed varieties is shown in the alignment in (C) (see Supplementary Figures 1–3 for details). Available gene expression data (http://www.wheatexpression.com) show a preferential expression of GS2 in leaves, and the additional expression of GS1 genes in roots, spikes and grain (D). Note that the GS1;3 genes show a distinct expression pattern and had the highest number of amino acid changes (C) (http://www.wheatexpression.com; Ramírez-González and Borrill, 2018).
FIGURE 3
FIGURE 3
GS1 and GS2 gene expression analysis in response to N and water deficit. For gene expression analyses, specific primers were designed that specifically amplify the GS1 genes and GS2 genes, respectively (see Figure 2). Expression of the three GS1 genes and their corresponding homeologs (A) and the GS2 gene with its three homeologs (B) was quantified in leaf samples from the four indicated wheat genotypes at 6 h and 30 after NH4NO3 application equivalent of 250 kg N ha–1 (N250) and in water-treated control plants (N-0). Each value represents the mean ± SE of four biological replicates. The inlay in (B) shows the correlation of GS gene expression and GS enzyme activity (corresponding GS activity data are shown in Supplementary Figure 4). The response of GS1 (C) and GS2 (D) gene expression to a dry-down treatment was analysed at 72 h after withholding water. Well-watered (WW) plants were sampled in parallel. Each value represents the mean ± SE of four biological replicates. In the dry-down experiment, GS enzyme activity (E) and leaf tissue ammonium content (F) were measured in parallel at 0 h and at 72 h after withholding water. The inlay shows a negative correlation of tissue ammonium and GS activity. Each value represents the mean ± SE of six biological replicates. Asterisks indicate significant differences between means (p < 0.05) of each treatment.
FIGURE 4
FIGURE 4
Differential response of ten wheat genotypes to N fertilisers. Ten elite United Kingdom wheat genotypes were treated with the equivalent of 250 kg N ha–1 applied either as NH4NO3 or urea and the response of GS activity (A), leaf tissue ammonium (B) and leaf-disc ammonium (C) were measured at 6 and 30 h after N application. The data shown represent log2 transformed relative changes compared to water-treated control plants (average values of six replicates). Data were calculated as LFold_Change = log2(treatment/control_mean). Average values of the actual data for the high-GS and the low-GS group, respectively, are given in (D–F). Error bars represent standard errors. Differences between groups were significant at p < 0.001. Cad, Cadenza; Par, Paragon; Soi, Soissons; Bro, Brompton; Alc, Alchemy; Her, Hereward; Cl, Claire; XL-19, XL-19; Rob, Robigus; Ria, Rialto. Differences between groups were significant at ***p < 0.001.
FIGURE 5
FIGURE 5
Ammonia and N2O gas emission in response to N application in wheat. Three wheat varieties representative of the high-GS group (Cadenza, Paragon) and low GS-group (Claire) were grown under low and high N conditions, respectively, and treated with the equivalent of 250 kg N ha–1 applied either as NH4NO3 or KNO3 immediately before gas measurements. Water was applied to control plants measured in parallel. For the soil control, above-ground plant tissue was cut off, but roots were retained (see text for details). Gas emission was measured using a gas analyser (Picarro G2508; United States) over a 24 h period. Maximum NH3 (A) and N2O (B) emission from plants was significantly higher than the background emission from soil. Representative processed Picarro data for NH3 (C) and N2O (D) emission are shown, with maximum NH3 emission occurring earlier than maximum N2O emission (E). The effect of the growth conditions and N treatment on maximum NH3 and N2O emission was calculated using the combined data of the three genotypes showing higher emission from N-starved plants (F,G). Genotypic differences between plants grown under low-N conditions are shown in (H,I). Cadenza plants grown under low-N conditions were treated with urea and KNO3, with and with nitrate reductase inhibitor (NI), showing highest N2O emission in the KNO3 treatment (J). Data are derived from six replicates for each genotype and treatment. Asterisks indicate significant differences between means (p < 0.05) of each treatment.
FIGURE 6
FIGURE 6
Differential N response in plants grown under high and low N conditions. Selected genotypes, Cadenza, Paragon and Claire, were grown under low-N and high-N conditions until the 3–4 tiller stage and then treated with the equivalent of 250 kg N ha–1 as NH4NO3 and KNO3, respectively. Water was used for control plants. GS activity (A), leaf tissue NH4+ (C) and leaf-disc NH4+ (E) were measured and compared between low-N and high-N plants. The effect of different treatments on GS enzyme activity (B), leaf tissue NH4+ (D) and leaf-disc NH4+ (F) was compared between the three genotypes. Asterisks indicate significant differences between means (p < 0.05) of each treatment.

Similar articles

Cited by

References

    1. Astier J., Gross I., Durner J. (2018). Nitric oxide production in plants: an update. J. Exp. Bot. 69:420. 10.1093/jxb/erx420 - DOI - PubMed
    1. Balotf S., Kavoosi G., Kholdebarin B. (2016). Nitrate reductase, nitrite reductase, glutamine synthetase, and glutamate synthase expression and activity in response to different nitrogen sources in nitrogen-starved wheat seedlings. Biotechnol. Appl. Biochem. 63:1362. 10.1002/bab.1362 - DOI - PubMed
    1. Baruah K. K., Gogoi B., Borah L., Gogoi M., Boruah R. (2012). Plant morphophysiological and anatomical factors associated with nitrous oxide flux from wheat (Triticum aestivum). J. Plant Res. 125 507–516. 10.1007/s10265-011-0464-4 - DOI - PubMed
    1. Baruah K. K., Gogoi B., Gogoi P. (2010). Plant physiological and soil characteristics associated with methane and nitrous oxide emission from rice paddy. Physiol. Mol. Biol. Plants 16 79–91. 10.1007/s12298-010-0010-1 - DOI - PMC - PubMed
    1. Bernard S. M., Habash D. Z. (2009). The importance of cytosolic glutamine synthetase in nitrogen assimilation and recycling. New Phytol. 182:2823. 10.1111/j.1469-8137.2009.02823.x - DOI - PubMed

LinkOut - more resources