. 2022 May;12(5):2391-2405.
doi: 10.1016/j.apsb.2021.09.031. Epub 2021 Oct 16.

PXR activation impairs hepatic glucose metabolism partly via inhibiting the HNF4 α-GLUT2 pathway

Affiliations

PXR activation impairs hepatic glucose metabolism partly via inhibiting the HNF4 α-GLUT2 pathway

Peihua Liu et al. Acta Pharm Sin B. 2022 May.

Abstract

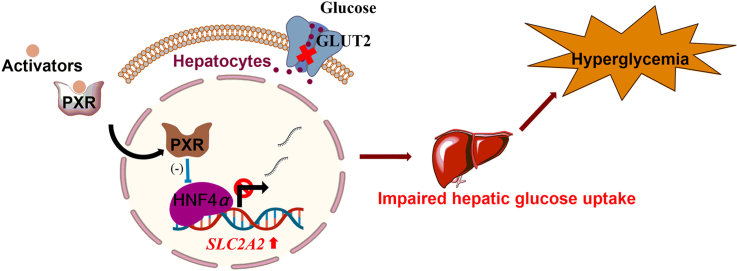
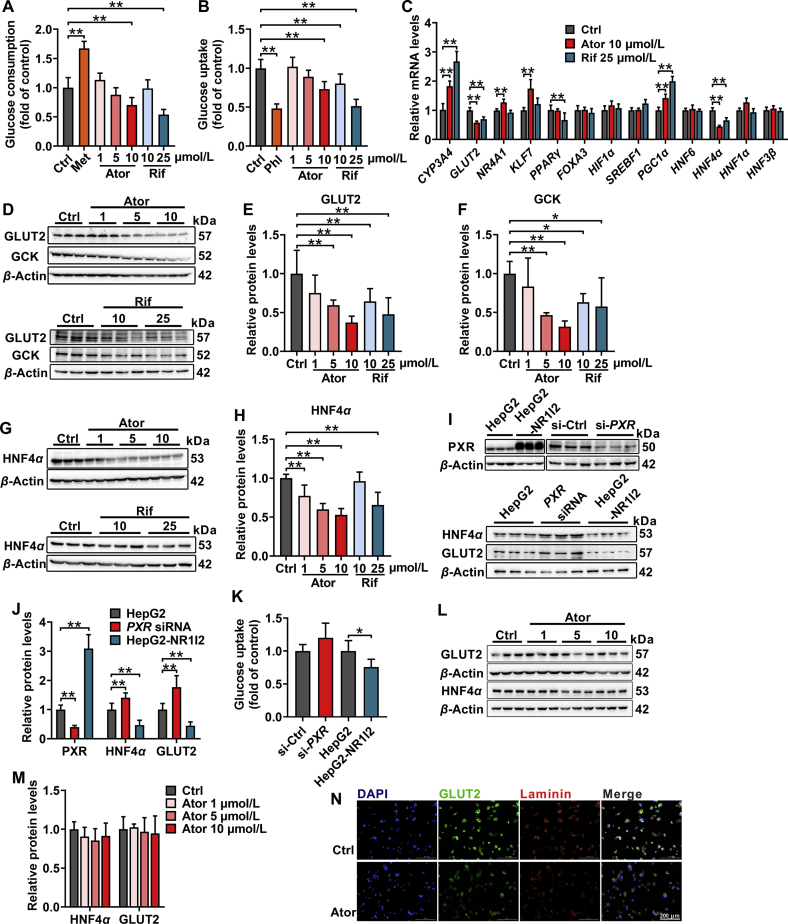
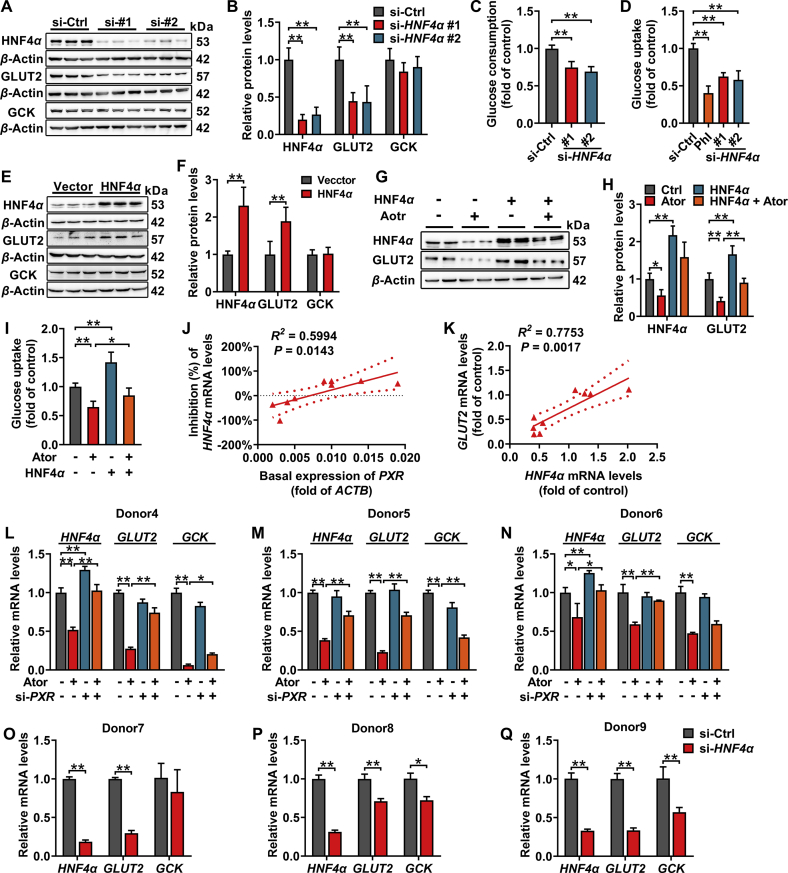
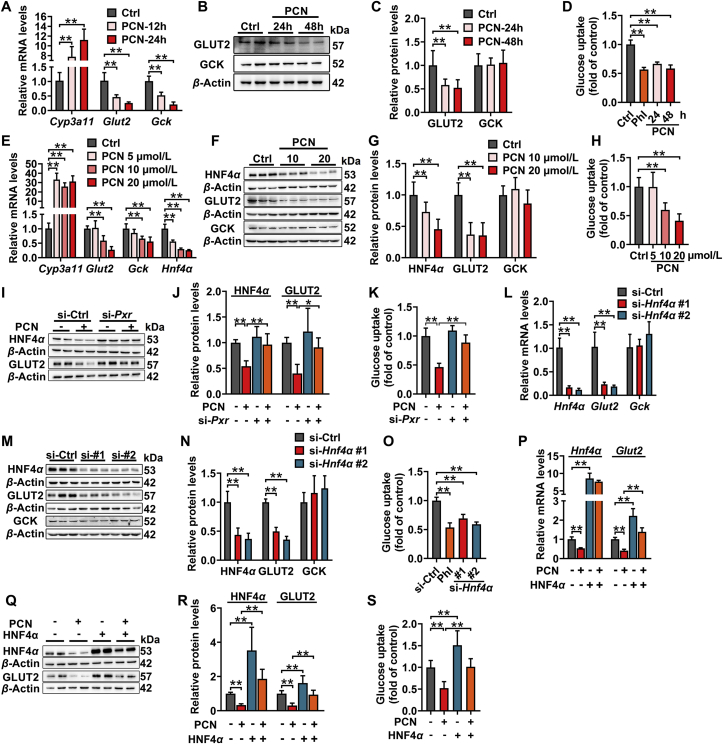
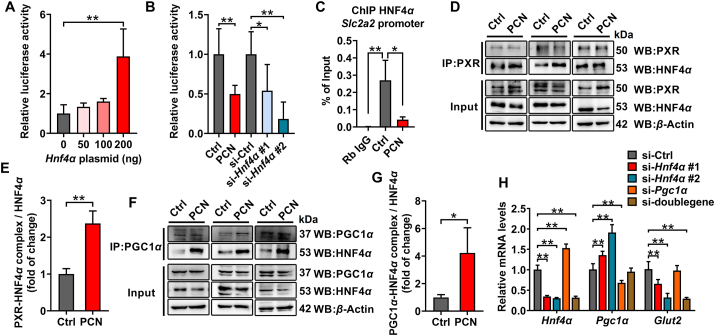
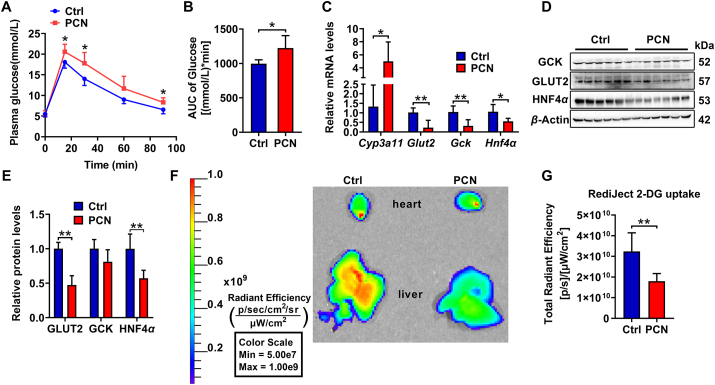
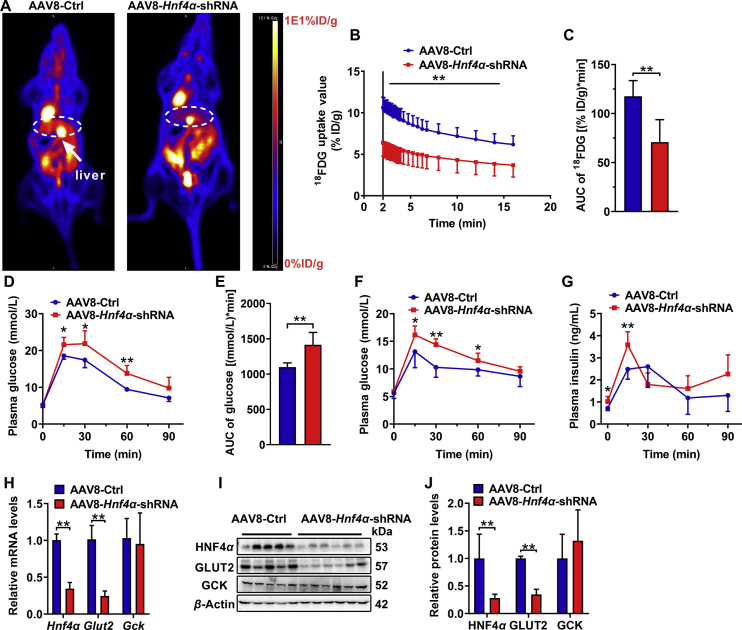
Drug-induced hyperglycemia/diabetes is a global issue. Some drugs induce hyperglycemia by activating the pregnane X receptor (PXR), but the mechanism is unclear. Here, we report that PXR activation induces hyperglycemia by impairing hepatic glucose metabolism due to inhibition of the hepatocyte nuclear factor 4-alpha (HNF4α)‒glucose transporter 2 (GLUT2) pathway. The PXR agonists atorvastatin and rifampicin significantly downregulated GLUT2 and HNF4α expression, and impaired glucose uptake and utilization in HepG2 cells. Overexpression of PXR downregulated GLUT2 and HNF4α expression, while silencing PXR upregulated HNF4α and GLUT2 expression. Silencing HNF4α decreased GLUT2 expression, while overexpressing HNF4α increased GLUT2 expression and glucose uptake. Silencing PXR or overexpressing HNF4α reversed the atorvastatin-induced decrease in GLUT2 expression and glucose uptake. In human primary hepatocytes, atorvastatin downregulated GLUT2 and HNF4α mRNA expression, which could be attenuated by silencing PXR. Silencing HNF4α downregulated GLUT2 mRNA expression. These findings were reproduced with mouse primary hepatocytes. Hnf4α plasmid increased Slc2a2 promoter activity. Hnf4α silencing or pregnenolone-16α-carbonitrile (PCN) suppressed the Slc2a2 promoter activity by decreasing HNF4α recruitment to the Slc2a2 promoter. Liver-specific Hnf4α deletion and PCN impaired glucose tolerance and hepatic glucose uptake, and decreased the expression of hepatic HNF4α and GLUT2. In conclusion, PXR activation impaired hepatic glucose metabolism partly by inhibiting the HNF4α‒GLUT2 pathway. These results highlight the molecular mechanisms by which PXR activators induce hyperglycemia/diabetes.

Keywords: Diabetes; Drug-induced hyperglycemia; Glucose transporter 2; Hepatic glucose uptake; Hepatocyte nuclear factor 4-alpha; Pregnane X receptor.


Conflict of interest statement

The authors declare no conflicts of interest.

Figures

Image 1
Graphical abstract
Figure 1
Figure 1
Effects of PXR activation on glucose metabolism and expression of HNF4α, GLUT2, and GCK in HepG2 cells. (A)‒(C) Effects of atorvastatin and rifampicin on glucose consumption (A) and glucose uptake (B) as well as mRNA (C) expression of CYP3A4, GLUT2, NR4A1, KLF7, PPARγ, FOXA3, HIF1α, SREBF1, PGC1α, HNF6, HNF4α, HNF1α, and HNF3β in HepG2 cells. (D)‒(F) Effects of atorvastatin and rifampicin on protein expression of GLUT2 and GCK in HepG2 cells. (G) and (H) Effects of atorvastatin and rifampicin on protein expression of HNF4α in HepG2 cells. (I) and (J) Expression of PXR, HNF4α, and GLUT2 in PXR-silenced and PXR-overexpressing HepG2 cells. (K) Glucose uptake in PXR-silenced and PXR-overexpressing HepG2 cells. (L) and (M) Effects of atorvastatin on protein expression of GLUT2 and HNF4α in PXR-silenced HepG2 cells. (N) Effects of atorvastatin on expression of membrane GLUT2 in HepG2 cells using immunofluorescence imaging. Data are represented as mean ± SD (n = 6). ∗P < 0.05, ∗∗P < 0.01. Ator, atorvastatin; Rif, rifampicin; Met, metformin; Phl, phloretin.
Figure 2
Figure 2
HNF4α promotes the expression of GLUT2 and glucose uptake in HepG2 cells and PXR activation downregulates expression of HNF4α and GLUT2 in human primary hepatocytes. (A)–(D) Protein expression of HNF4α, GLUT2, and GCK (A, B), and glucose consumption (C) and glucose uptake (D) in HNF4α-silenced HepG2 cells (n = 6). (E) and (F) Protein expression of HNF4α, GLUT2, and GCK in HNF4α-overexpressing HepG2 cells (n = 6). (G)–(I) Protein expression of GLUT2 and HNF4α (G, H) and glucose uptake (I) in atorvastatin-treated HepG2 cells or HNF4α-overexpressing HepG2 cells (n = 6). (J) Correlation between basal mRNA levels of PXR and percent inhibition of HNF4α mRNA expression in atorvastatin-treated human primary hepatocytes from nine different donors (n = 9). Basal PXR expression is given as the ratio of PXR mRNA to ACTB mRNA in the control group. (K) Positive relationship between altered mRNA expression of HNF4α and GLUT2 in atorvastatin-treated human primary hepatocytes from nine different donors (n = 9). (L)‒(N) Effects of silencing PXR on mRNA levels of HNF4α, GLUT2, and GCK in atorvastatin-treated human primary hepatocytes (n = 3). (O)–(Q) Effects of silencing HNF4α on mRNA levels of GLUT2 and GCK in human primary hepatocytes (n = 3). Data are represented as mean ± SD. ∗P < 0.05, ∗∗P < 0.01.
Figure 3
Figure 3
Activation of PXR impairs glucose uptake by inhibiting the HNF4α–GLUT2 pathway in mouse primary hepatocytes. Effects of 12 and 24 h PCN (10 μmol/L) treatment on the mRNA (A) and protein (B and C) expression of GLUT2 and GCK as well as glucose uptake (D) in mouse primary hepatocytes. Effects of different concentrations of PCN on the mRNA (E) and protein (F and G) expression of HNF4α, GLUT2, and GCK as well as glucose uptake (H) in mouse primary hepatocytes. Effects of Pxr silencing on impaired protein (I and J) expression of HNF4α and GLUT2 as well as glucose uptake (K) by PCN in mouse primary hepatocytes. Effects of Hnf4α silencing on the mRNA (L) and protein (M and N) expression of GLUT2 and GCK as well as glucose uptake (O) in mouse primary hepatocytes. Effects of HNF4α overexpression on impaired mRNA (P) and protein (Q and R) expression of GLUT2 as well as glucose uptake (S) by PCN. Data are represented as mean ± SD (n = 6). ∗P < 0.05, ∗∗P < 0.01.
Figure 4
Figure 4
Association of HNF4α with transcriptional activation of GLUT2 and effects of PXR activation by PCN on the formation of the PXR–HNF4α complex and the HNF4α–PGC1α complex. (A) HNF4α dose-dependently activated the Slc2a2 promoter in NIH/3T3 cells (n = 6). (B) Relative Slc2a2 promoter luciferase reporter activity in mouse primary hepatocytes treated with PCN (10 μmol/L) or silenced Hnf4α for 48 h. The luciferase activity generated was normalized by a co-transfected internal pRL-TK control plasmid expressing Renilla luciferase (n = 6). (C) ChIP analysis for HNF4α binding on the Slc2a2 promoter followed by qRT-PCR in mouse primary hepatocytes treated with PCN (10 μmol/L) for 48 h (n = 3). (D)‒(G) PXR activation by PCN increased the formation of the PXR‒HNF4α complex and the HNF4α‒PGC1α complex in mouse primary hepatocytes. Western blot analysis with the indicated antibodies in total cell lysates and precipitates after immunoprecipitation with anti-PXR antibody (D) or anti-PGC1α antibody (F). The quantitative data were indexed as the ratio of HNF4α complex to total HNF4α (E and G; n = 3). (H) Effects of both silencing Hnf4α and Pgc1α on the expression of Glut2 in mouse primary hepatocytes (n = 6). Data are represented as mean ± SD. ∗P < 0.05, ∗∗P < 0.01.
Figure 5
Figure 5
5-Day PCN treatment impairs glucose tolerance and hepatic glucose uptake in C57BL/6J mice. Effects of 5-day PCN treatment on glucose levels after intraperitoneal injection of 2 g/kg glucose (A). Quantitation of glucose area under the curve is shown in (B). Effects of 5-day PCN treatment on the mRNA (C) and protein (D and E) expression of CYP3A11, GLUT2, GCK, and HNF4α in mouse liver. (F and G) Effects of 5-day PCN treatment on uptake of RediJect-2DG in liver. Data are represented as mean ± SD (n = 6). ∗P < 0.05, ∗∗P < 0.01 versus control mice.
Figure 6
Figure 6
Absence of liver HNF4α expression impairs glucose tolerance and hepatic glucose uptake in C57BL/6J mice. PET/CT imaging (A) and kinetics (B) of 18F-FDG uptake by the livers of control mice and liver-specific Hnf4α knockdown mice. Quantitation of 18F-FDG area under the curve shown in (C) (n = 6). (D) Effects of liver-specific Hnf4α silencing on glucose levels after intraperitoneal injection of 2 g/kg glucose. Quantitation of glucose area under the curve is shown in (E) (n = 5–6). Effects of liver-specific Hnf4α silencing on plasma glucose (F) and insulin (G) levels during an oral glucose tolerance test (n = 6). Effects of liver-specific Hnf4α silencing on mRNA (H) and protein levels (I and J) of HNF4α, GLUT2, and GCK in mouse liver (n = 5–6). Data are represented as mean ± SD. ∗P < 0.05, ∗∗P < 0.01 versus control mice.

Similar articles

Cited by

References

    1. Liu M.Z., He H.Y., Luo J.Q., He F.Z., Chen Z.R., Liu Y.P., et al. Drug-induced hyperglycaemia and diabetes: pharmacogenomics perspectives. Arch Pharm Res. 2018;41:725–736. - PubMed
    1. Fathallah N., Slim R., Larif S., Hmouda H., Ben Salem C. Drug-induced hyperglycaemia and diabetes. Drug Saf. 2015;38:1153–1168. - PubMed
    1. Jain V., Patel R.K., Kapadia Z., Galiveeti S., Banerji M., Hope L. Drugs and hyperglycemia: a practical guide. Maturitas. 2017;104:80–83. - PubMed
    1. Jiao T., Yao X., Zhao Y., Zhou Y., Gao Y., Fan S., et al. Dexamethasone-induced liver enlargement is related to PXR/YAP activation and lipid accumulation but not hepatocyte proliferation. Drug Metab Dispos. 2020;48:830–839. - PMC - PubMed
    1. Luo G., Cunningham M., Kim S., Burn T., Lin J., Sinz M., et al. CYP3A4 induction by drugs: correlation between a pregnane X receptor reporter gene assay and CYP3A4 expression in human hepatocytes. Drug Metab Dispos. 2002;30:795–804. - PubMed

LinkOut - more resources