

Stimuli-responsive nano vehicle enhances cancer immunotherapy by coordinating mitochondria-targeted immunogenic cell death and PD-L1 blockade
- PMID: 35646521
- PMCID: PMC9136536
- DOI: 10.1016/j.apsb.2021.11.005
Stimuli-responsive nano vehicle enhances cancer immunotherapy by coordinating mitochondria-targeted immunogenic cell death and PD-L1 blockade
Abstract
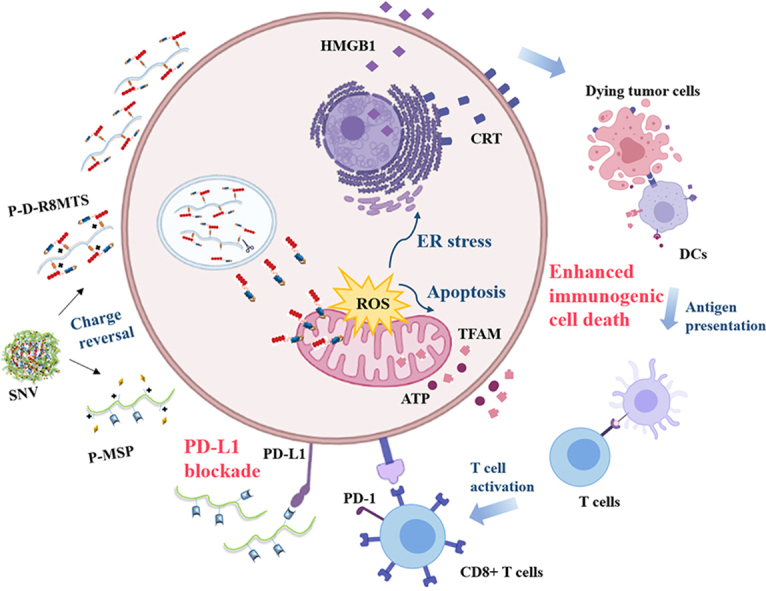
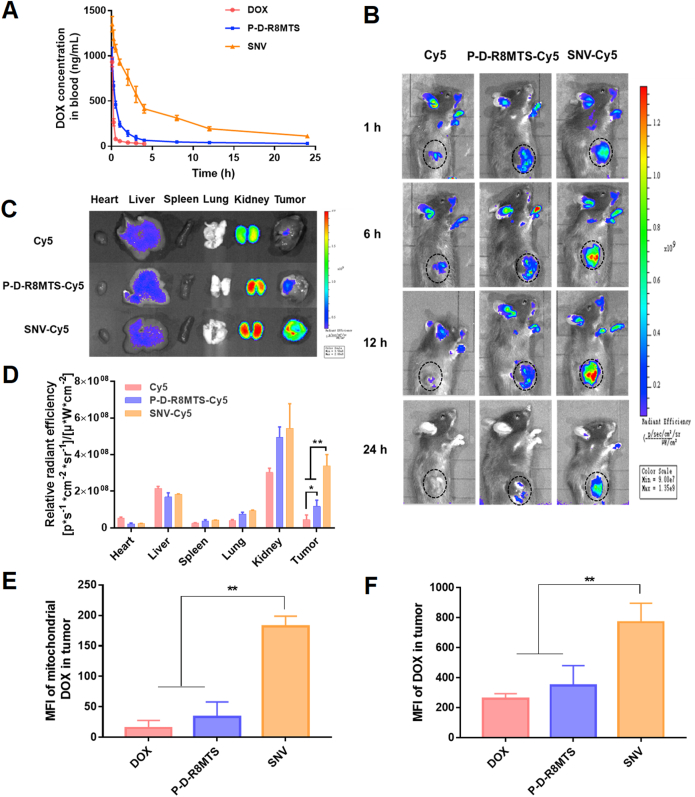
Induction of immunogenic cell death promotes antitumor immunity against cancer. However, majority of clinically-approved drugs are unable to elicit sufficient ICD. Here, our study revealed that mitochondria-targeted delivery of doxorubicin (DOX) massively amplified ICD via substantial generation of reactive oxygen species (ROS) after mitochondrial damage. The underlying mechanism behind increased ICD was further demonstrated to be ascribed to two pathways: (1) ROS elevated endoplasmic reticulum (ER) stress, leading to surface exposure of calreticulin; (2) ROS promoted release of various mitochondria-associated damage molecules including mitochondrial transcription factor A. Nevertheless, adaptive upregulation of PD-L1 was found after such ICD-inducing treatment. To overcome such immunosuppressive feedback, we developed a tumor stimuli-responsive nano vehicle to simultaneously exert mitochondrial targeted ICD induction and PD-L1 blockade. The nano vehicle was self-assembled from ICD-inducing copolymer and PD-L1 blocking copolymer, and possessed long-circulating property which contributed to better tumor accumulation and mitochondrial targeting. As a result, the nano vehicle remarkably activated antitumor immune responses and exhibited robust antitumor efficacy in both immunogenic and non-immunogenic tumor mouse models.
Keywords: Antitumor efficacy; Antitumor immune responses; Endoplasmic reticulum stress; Immunogenic cell death; Mitochondria-associated damage molecules; Mitochondrial targeting; PD-L1 blockade; Stimuli-responsive.
© 2022 Chinese Pharmaceutical Association and Institute of Materia Medica, Chinese Academy of Medical Sciences. Production and hosting by Elsevier B.V.
Figures


Similar articles
-
Immunogenic Cell Death Inducing Fluorinated Mitochondria-Disrupting Helical Polypeptide Synergizes with PD-L1 Immune Checkpoint Blockade.Adv Sci (Weinh). 2021 Feb 1;8(7):2001308. doi: 10.1002/advs.202001308. eCollection 2021 Apr. Adv Sci (Weinh). 2021. PMID: 33854870 Free PMC article.
-
Redirecting Chemotherapeutics to the Endoplasmic Reticulum Increases Tumor Immunogenicity and Potentiates Anti-PD-L1 Therapy.Small. 2022 Feb;18(6):e2104591. doi: 10.1002/smll.202104591. Epub 2021 Dec 2. Small. 2022. PMID: 34859582
-
All-in-one glycol chitosan nanoparticles for co-delivery of doxorubicin and anti-PD-L1 peptide in cancer immunotherapy.Bioact Mater. 2023 Jun 10;28:358-375. doi: 10.1016/j.bioactmat.2023.05.016. eCollection 2023 Oct. Bioact Mater. 2023. PMID: 37334068 Free PMC article.
-
Engineering nanomedicines for immunogenic eradication of cancer cells: Recent trends and synergistic approaches.Acta Pharm Sin B. 2024 Jun;14(6):2475-2504. doi: 10.1016/j.apsb.2024.03.022. Epub 2024 Mar 20. Acta Pharm Sin B. 2024. PMID: 38828160 Free PMC article. Review.
-
Chemotherapeutic and targeted drugs-induced immunogenic cell death in cancer models and antitumor therapy: An update review.Front Pharmacol. 2023 Apr 21;14:1152934. doi: 10.3389/fphar.2023.1152934. eCollection 2023. Front Pharmacol. 2023. PMID: 37153795 Free PMC article. Review.
Cited by
-
ROS-Responsive Nanoplatforms for Targeted Tumor Immunomodulation: A Paradigm Shift in Precision Cancer Immunotherapy.Pharmaceutics. 2025 Jul 5;17(7):886. doi: 10.3390/pharmaceutics17070886. Pharmaceutics. 2025. PMID: 40733095 Free PMC article. Review.
-
Advancing immune checkpoint blockade in colorectal cancer therapy with nanotechnology.Front Immunol. 2022 Oct 20;13:1027124. doi: 10.3389/fimmu.2022.1027124. eCollection 2022. Front Immunol. 2022. PMID: 36341334 Free PMC article. Review.
-
EGCG and DOX dual-drug-loaded enzyme-responsive nanovesicles boost mitochondrial-mediated ICD for improved immunotherapy.Front Pharmacol. 2025 Jul 7;16:1624109. doi: 10.3389/fphar.2025.1624109. eCollection 2025. Front Pharmacol. 2025. PMID: 40693277 Free PMC article.
-
Recent Advances in Nanoparticles-Based Platforms Targeting the PD-1/PD-L1 Pathway for Cancer Treatment.Pharmaceutics. 2022 Jul 29;14(8):1581. doi: 10.3390/pharmaceutics14081581. Pharmaceutics. 2022. PMID: 36015206 Free PMC article. Review.
-
Regulation of immunogenic cell death and potential applications in cancer therapy.Front Immunol. 2025 Mar 26;16:1571212. doi: 10.3389/fimmu.2025.1571212. eCollection 2025. Front Immunol. 2025. PMID: 40207233 Free PMC article. Review.
References
-
- Wellenstein M.D., de Visser K.E. Cancer-cell-intrinsic mechanisms shaping the tumor immune landscape. Immunity. 2018;48:399–416. - PubMed
-
- Krysko D.V., Garg A.D., Kaczmarek A., Krysko O., Agostinis P., Vandenabeele P. Immunogenic cell death and DAMPs in cancer therapy. Nat Rev Cancer. 2012;12:860–875. - PubMed
-
- Garg A.D., Agostinis P. ER stress, autophagy and immunogenic cell death in photodynamic therapy-induced anti-cancer immune responses. Photochem Photobiol Sci. 2014;13:474–487. - PubMed
-
- Yin Y.F., Jiang X.W., Sun L.P., Li H.Y., Su C.X., Zhang Y., et al. Continuous inertial cavitation evokes massive ROS for reinforcing sonodynamic therapy and immunogenic cell death against breast carcinoma. Nano Today. 2021;36:101009.
LinkOut - more resources
Full Text Sources
Research Materials
