

Crosstalk between CYP2E1 and PPAR α substrates and agonists modulate adipose browning and obesity
- PMID: 35646522
- PMCID: PMC9136617
- DOI: 10.1016/j.apsb.2022.02.004
Crosstalk between CYP2E1 and PPAR α substrates and agonists modulate adipose browning and obesity
Abstract
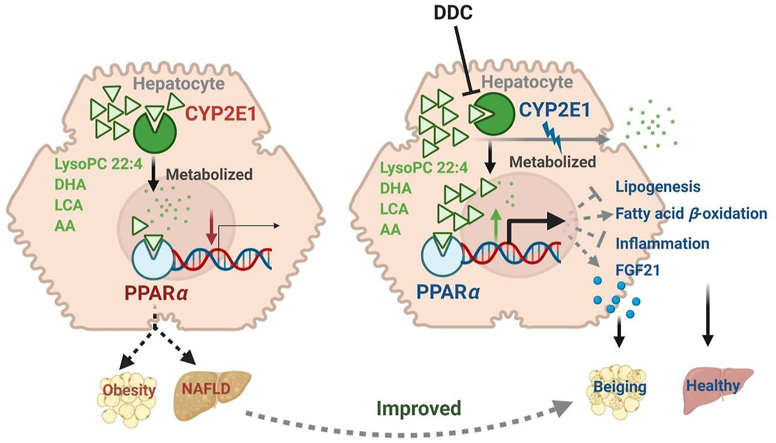
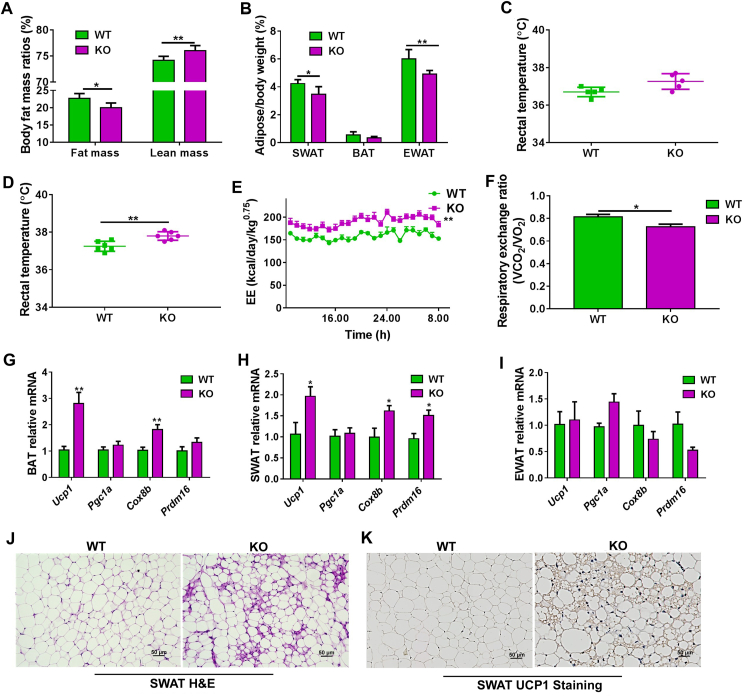
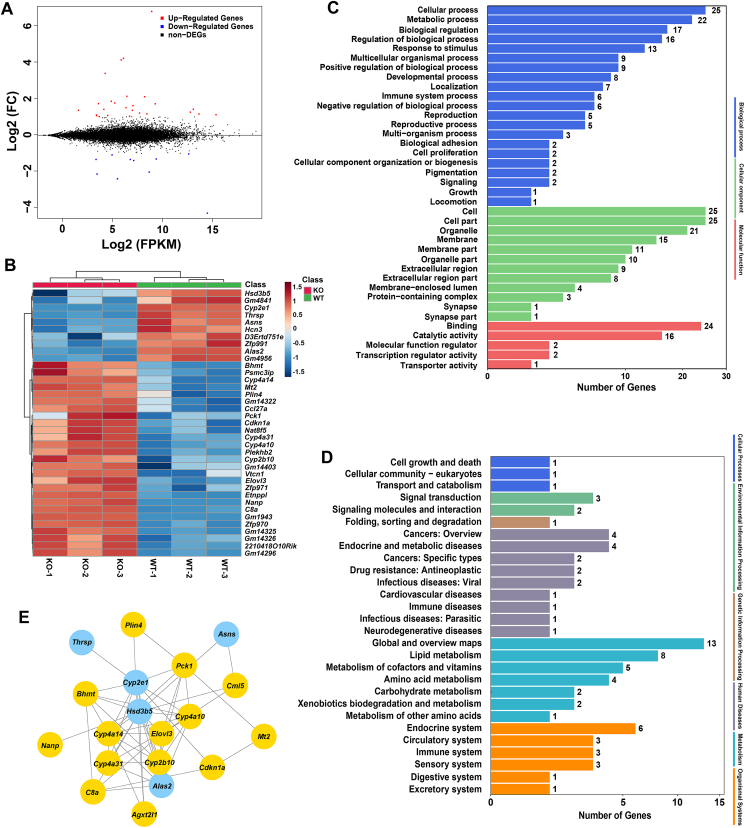
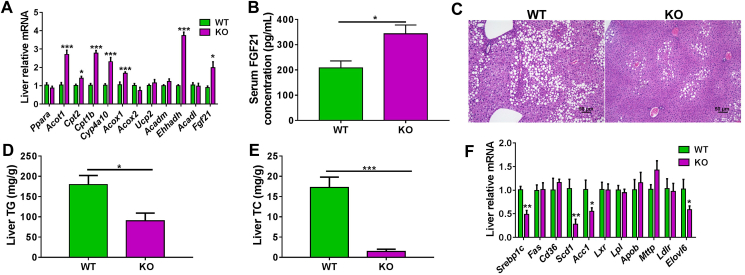
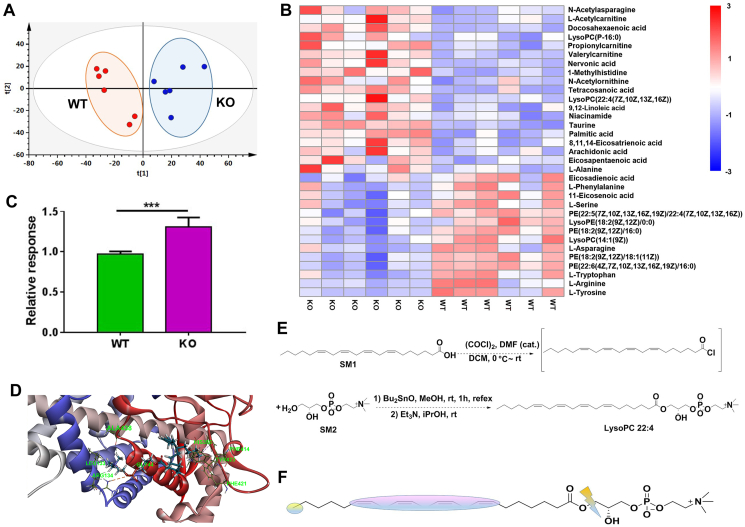
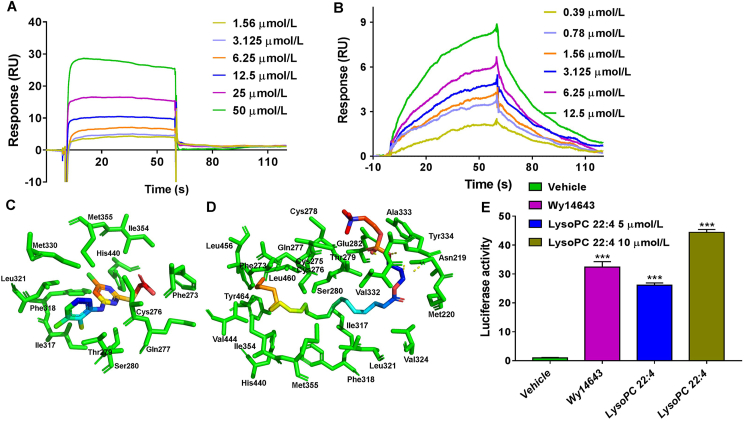
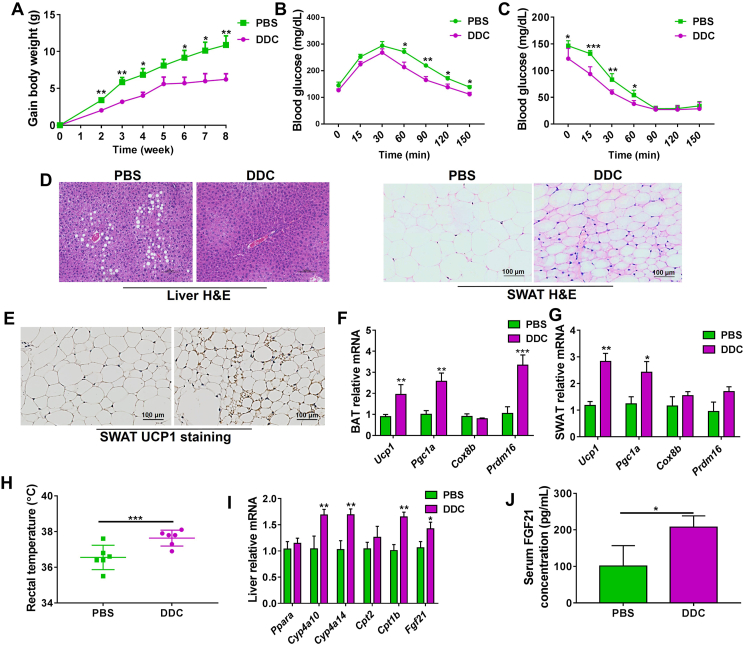
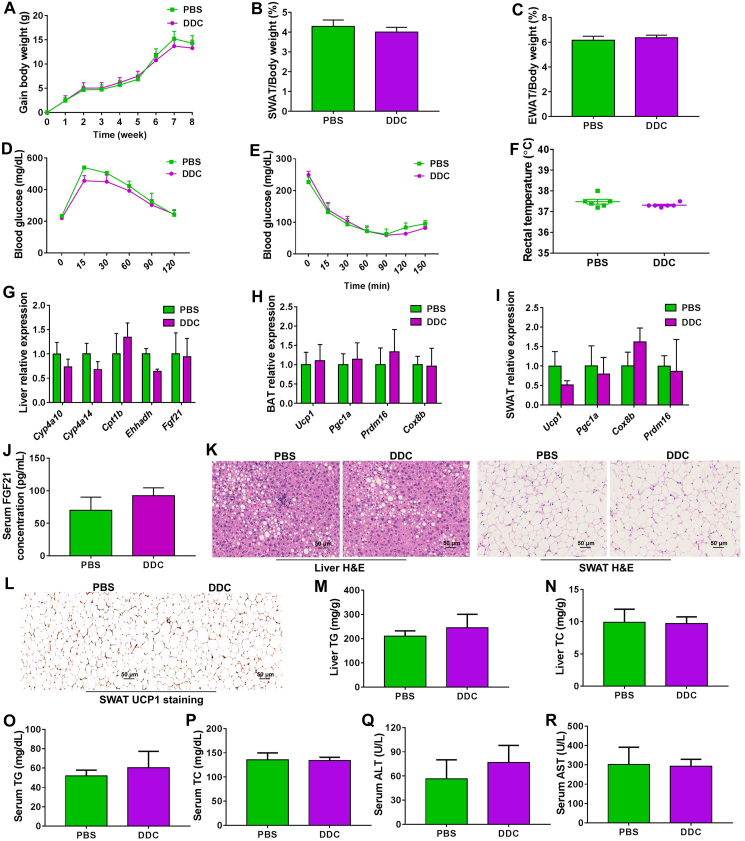
Although the functions of metabolic enzymes and nuclear receptors in controlling physiological homeostasis have been established, their crosstalk in modulating metabolic disease has not been explored. Genetic ablation of the xenobiotic-metabolizing cytochrome P450 enzyme CYP2E1 in mice markedly induced adipose browning and increased energy expenditure to improve obesity. CYP2E1 deficiency activated the expression of hepatic peroxisome proliferator-activated receptor alpha (PPARα) target genes, including fibroblast growth factor (FGF) 21, that upon release from the liver, enhanced adipose browning and energy expenditure to decrease obesity. Nineteen metabolites were increased in Cyp2e1-null mice as revealed by global untargeted metabolomics, among which four compounds, lysophosphatidylcholine and three polyunsaturated fatty acids were found to be directly metabolized by CYP2E1 and to serve as PPARα agonists, thus explaining how CYP2E1 deficiency causes hepatic PPARα activation through increasing cellular levels of endogenous PPARα agonists. Translationally, a CYP2E1 inhibitor was found to activate the PPARα-FGF21-beige adipose axis and decrease obesity in wild-type mice, but not in liver-specific Ppara-null mice. The present results establish a metabolic crosstalk between PPARα and CYP2E1 that supports the potential for a novel anti-obesity strategy of activating adipose tissue browning by targeting the CYP2E1 to modulate endogenous metabolites beyond its canonical role in xenobiotic-metabolism.
Keywords: CYP2E1; FGF21; Metabolic enzyme; Nuclear receptor; Obesity; PPARα.
© 2022 Chinese Pharmaceutical Association and Institute of Materia Medica, Chinese Academy of Medical Sciences. Production and hosting by Elsevier B.V.
Figures

Similar articles
-
Regulation of peroxisome proliferator activated receptor alpha-mediated pathways in alcohol fed cytochrome P450 2E1 deficient mice.Hepatol Res. 2001 Feb;19(2):117-130. doi: 10.1016/s1386-6346(00)00089-9. Hepatol Res. 2001. PMID: 11164737
-
The hepatokine FGF21 is crucial for peroxisome proliferator-activated receptor-α agonist-induced amelioration of metabolic disorders in obese mice.J Biol Chem. 2017 Jun 2;292(22):9175-9190. doi: 10.1074/jbc.M116.767590. Epub 2017 Apr 12. J Biol Chem. 2017. PMID: 28404815 Free PMC article.
-
Hepatic Small Ubiquitin-Related Modifier (SUMO)-Specific Protease 2 Controls Systemic Metabolism Through SUMOylation-Dependent Regulation of Liver-Adipose Tissue Crosstalk.Hepatology. 2021 Oct;74(4):1864-1883. doi: 10.1002/hep.31881. Epub 2021 Sep 9. Hepatology. 2021. PMID: 33934381
-
Hydrogen peroxide generation in peroxisome proliferator-induced oncogenesis.Mutat Res. 2000 Mar 17;448(2):159-77. doi: 10.1016/s0027-5107(99)00234-1. Mutat Res. 2000. PMID: 10725470 Review.
-
The role and regulation of the peroxisome proliferator activated receptor alpha in human liver.Biochimie. 2017 May;136:75-84. doi: 10.1016/j.biochi.2016.12.019. Epub 2017 Jan 8. Biochimie. 2017. PMID: 28077274 Review.
Cited by
-
Stress mechanism involved in the progression of alcoholic liver disease and the therapeutic efficacy of nanoparticles.Front Immunol. 2023 Sep 29;14:1205821. doi: 10.3389/fimmu.2023.1205821. eCollection 2023. Front Immunol. 2023. PMID: 37841267 Free PMC article. Review.
-
Conjugated bile acids promote metabolic dysfunction-associated steatotic liver disease through inducing nuclear translocation of sphingosine-1-phosphate receptor 2 to disrupt peroxisome proliferator-activated receptor alpha.Cell Commun Signal. 2025 May 25;23(1):240. doi: 10.1186/s12964-025-02249-1. Cell Commun Signal. 2025. PMID: 40414852 Free PMC article.
-
Subcellular expression of CYP2E1 in HepG2 cells impacts response to free oleic and palmitic acid.Curr Res Toxicol. 2024 Sep 28;7:100195. doi: 10.1016/j.crtox.2024.100195. eCollection 2024. Curr Res Toxicol. 2024. PMID: 39429948 Free PMC article.
-
Fat-1 Ameliorates Metabolic Dysfunction-Associated Fatty Liver Disease and Atherosclerosis through Promoting the Nuclear Localization of PPARα in Hamsters.Research (Wash D C). 2025 Mar 6;8:0577. doi: 10.34133/research.0577. eCollection 2025. Research (Wash D C). 2025. PMID: 40052160 Free PMC article.
-
Epigenetic Marks as Predictors of Metabolic Response to Bariatric Surgery: Validation from an Epigenome Wide Association Study.Int J Mol Sci. 2023 Sep 30;24(19):14778. doi: 10.3390/ijms241914778. Int J Mol Sci. 2023. PMID: 37834223 Free PMC article.
References
-
- Bluher M. Obesity: global epidemiology and pathogenesis. Nat Rev Endocrinol. 2019;15:288–298. - PubMed
-
- Shi Y., Burn P. Lipid metabolic enzymes: emerging drug targets for the treatment of obesity. Nat Rev Endocrinol. 2004;3:695–710. - PubMed
-
- De Bosscher K., Desmet S.J., Clarisse D., Estebanez-Perpina E., Brunsveld L. Nuclear receptor crosstalk-defining the mechanisms for therapeutic innovation. Nat Rev Endocrinol. 2020;16:363–377. - PubMed
LinkOut - more resources
Full Text Sources
Molecular Biology Databases
