

Intravenous route to choroidal neovascularization by macrophage-disguised nanocarriers for mTOR modulation
- PMID: 35646523
- PMCID: PMC9136612
- DOI: 10.1016/j.apsb.2021.10.022
Intravenous route to choroidal neovascularization by macrophage-disguised nanocarriers for mTOR modulation
Abstract
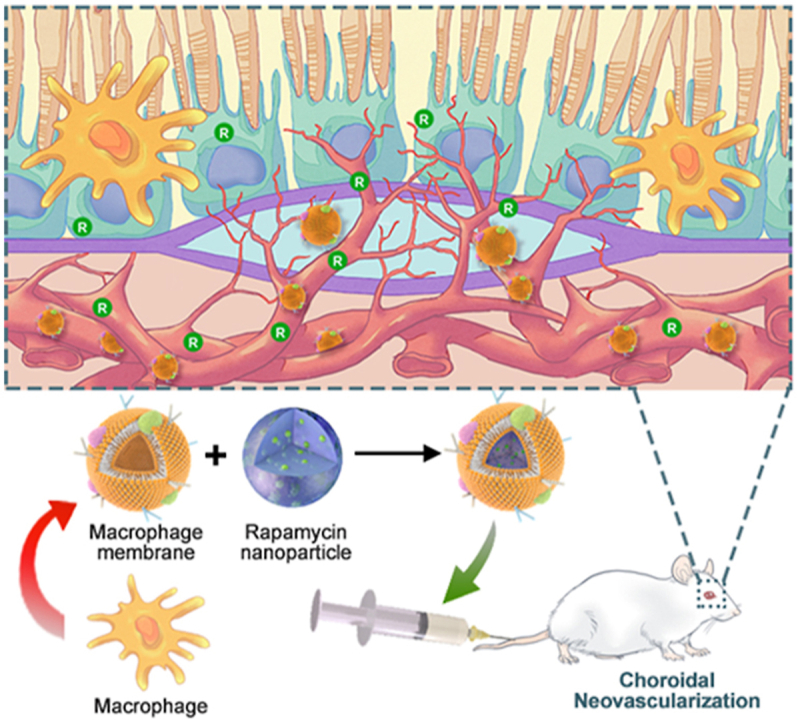
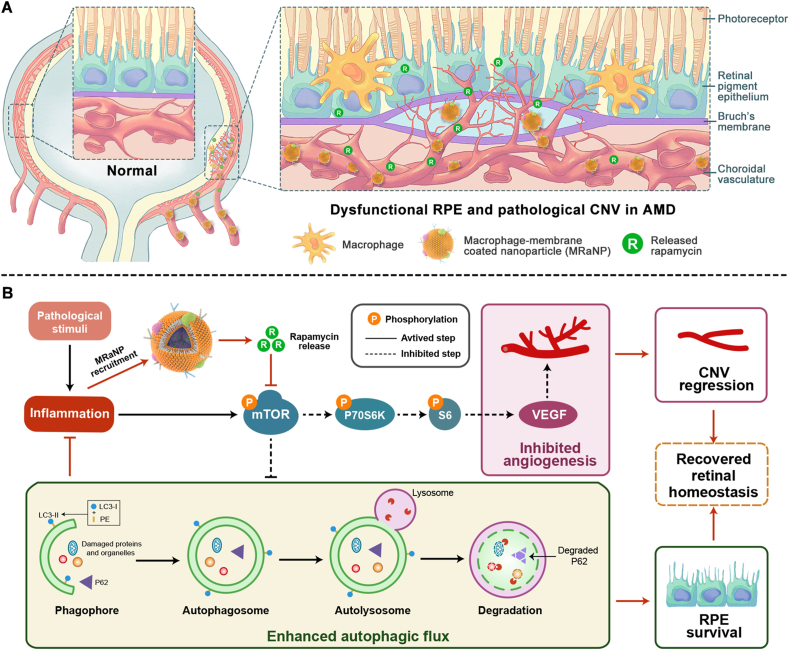
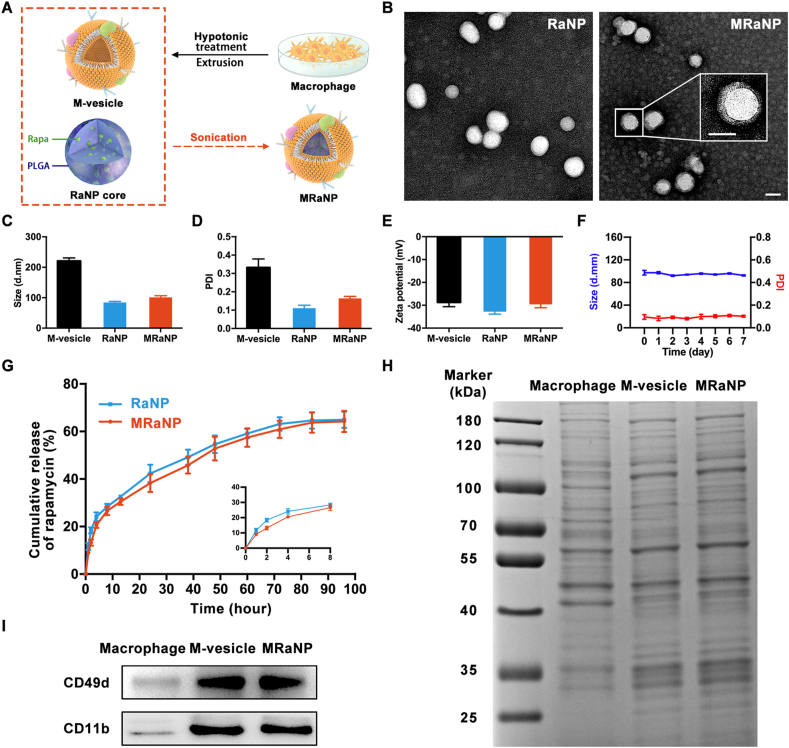
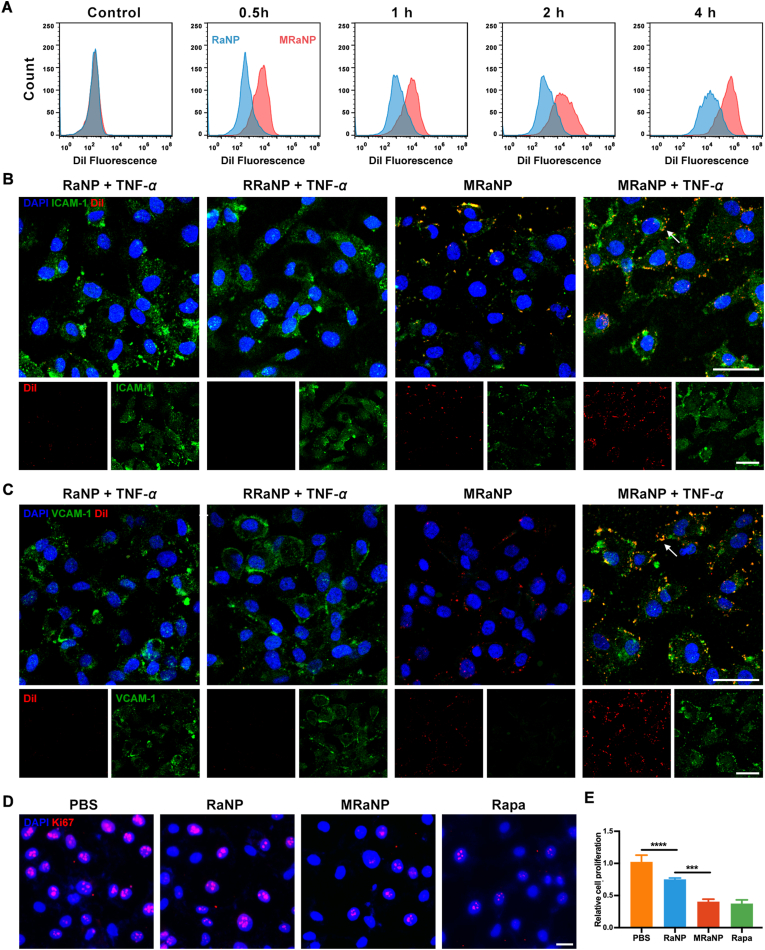
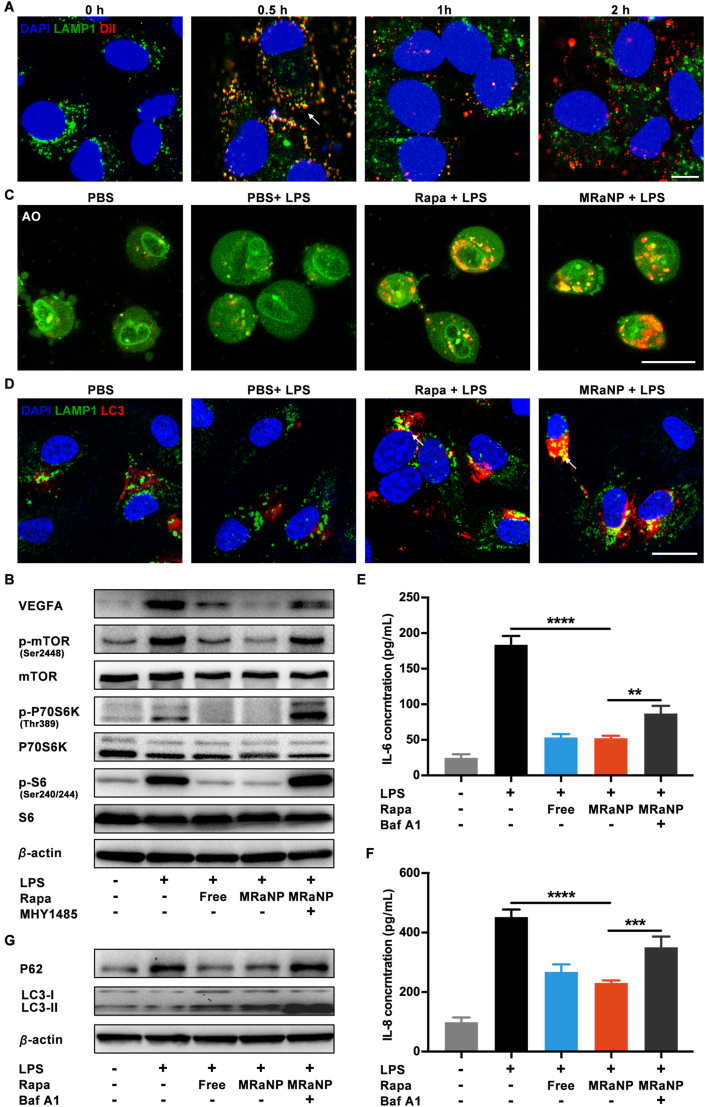
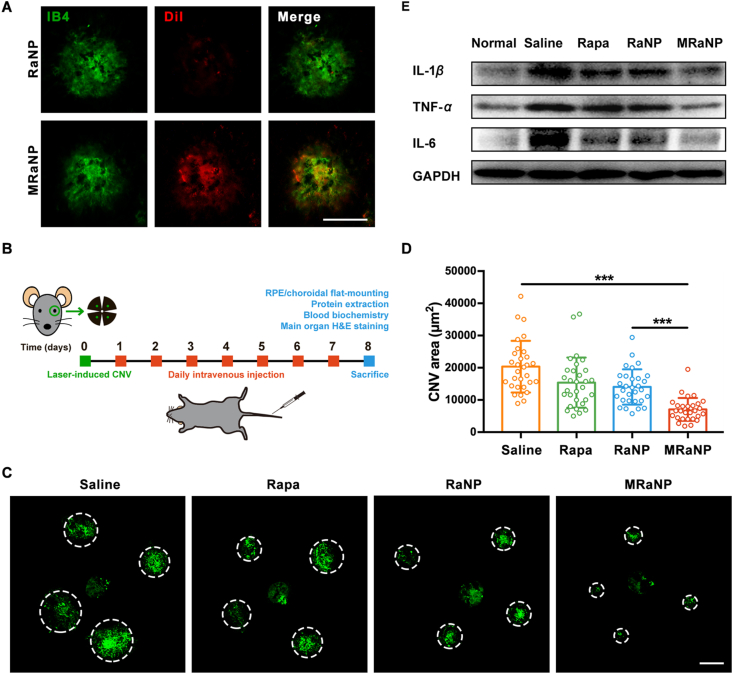
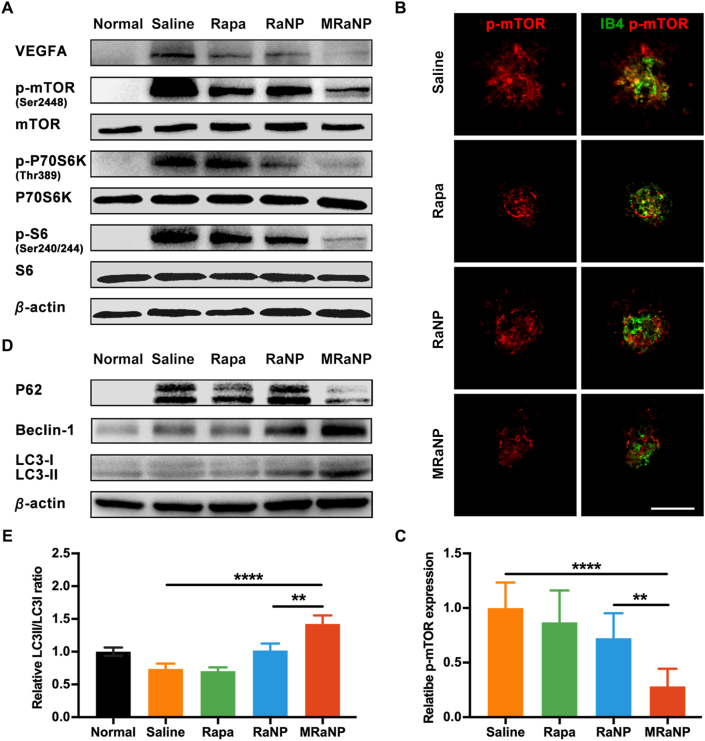
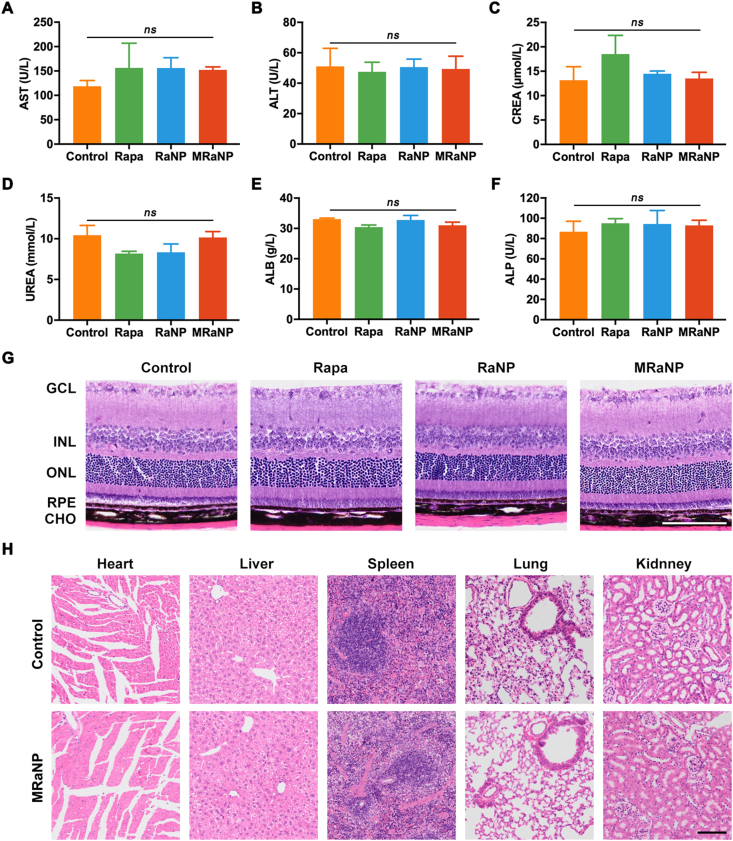
Retinal pigment epithelial (RPE) is primarily impaired in age-related macular degeneration (AMD), leading to progressive loss of photoreceptors and sometimes choroidal neovascularization (CNV). mTOR has been proposed as a promising therapeutic target, while the usage of its specific inhibitor, rapamycin, was greatly limited. To mediate the mTOR pathway in the retina by a noninvasive approach, we developed novel biomimetic nanocomplexes where rapamycin-loaded nanoparticles were coated with cell membrane derived from macrophages (termed as MRaNPs). Taking advantage of the macrophage-inherited property, intravenous injection of MRaNPs exhibited significantly enhanced accumulation in the CNV lesions, thereby increasing the local concentration of rapamycin. Consequently, MRaNPs effectively downregulated the mTOR pathway and attenuate angiogenesis in the eye. Particularly, MRaNPs also efficiently activated autophagy in the RPE, which was acknowledged to rescue RPE in response to deleterious stimuli. Overall, we design and prepare macrophage-disguised rapamycin nanocarriers and demonstrate the therapeutic advantages of employing biomimetic cell membrane materials for treatment of AMD.
Keywords: Age-related macular degeneration; Biomimetic nanoparticles; Choroidal neovascularization; Inflammation; Macrophage membrane; Rapamycin; Targeted drug delivery; mTOR signaling.
© 2022 Chinese Pharmaceutical Association and Institute of Materia Medica, Chinese Academy of Medical Sciences. Production and hosting by Elsevier B.V.
Conflict of interest statement
The authors have no conflicts of interest to declare.
Figures
Similar articles
-
[Novel approach for management of age-related macular degeneration--antiangiogenic therapy and retinal regenerative therapy].Nippon Ganka Gakkai Zasshi. 2007 Mar;111(3):232-68; discussion 269. Nippon Ganka Gakkai Zasshi. 2007. PMID: 17402564 Review. Japanese.
-
Evolution of oxidative stress, inflammation and neovascularization in the choroid and retina in a subretinal lipid induced age-related macular degeneration model.Exp Eye Res. 2021 Feb;203:108391. doi: 10.1016/j.exer.2020.108391. Epub 2020 Dec 8. Exp Eye Res. 2021. PMID: 33307075
-
Establishing Liposome-Immobilized Dexamethasone-Releasing PDMS Membrane for the Cultivation of Retinal Pigment Epithelial Cells and Suppression of Neovascularization.Int J Mol Sci. 2019 Jan 9;20(2):241. doi: 10.3390/ijms20020241. Int J Mol Sci. 2019. PMID: 30634448 Free PMC article.
-
Bruch's Membrane and the Choroid in Age-Related Macular Degeneration.Adv Exp Med Biol. 2021;1256:89-119. doi: 10.1007/978-3-030-66014-7_4. Adv Exp Med Biol. 2021. PMID: 33847999
-
Anaphylatoxin Signaling in Retinal Pigment and Choroidal Endothelial Cells: Characteristics and Relevance to Age-Related Macular Degeneration.Adv Exp Med Biol. 2018;1074:45-51. doi: 10.1007/978-3-319-75402-4_6. Adv Exp Med Biol. 2018. PMID: 29721926 Review.
Cited by
-
Frontier applications of retinal nanomedicine: progress, challenges and perspectives.J Nanobiotechnology. 2025 Feb 25;23(1):143. doi: 10.1186/s12951-025-03095-6. J Nanobiotechnology. 2025. PMID: 40001147 Free PMC article. Review.
-
Recent Advances in Nanomedicine for Ocular Fundus Neovascularization Disease Management.Adv Healthc Mater. 2024 Jul;13(17):e2304626. doi: 10.1002/adhm.202304626. Epub 2024 Mar 10. Adv Healthc Mater. 2024. PMID: 38406994 Free PMC article. Review.
-
The Essential Role of Light-Induced Autophagy in the Inner Choroid/Outer Retinal Neurovascular Unit in Baseline Conditions and Degeneration.Int J Mol Sci. 2023 May 19;24(10):8979. doi: 10.3390/ijms24108979. Int J Mol Sci. 2023. PMID: 37240326 Free PMC article. Review.
-
m6A-Mediated Upregulation of Imprinted in Prader-Willi Syndrome Induces Aberrant Apical-Basal Polarization and Oxidative Damage in RPE Cells.Invest Ophthalmol Vis Sci. 2024 Feb 1;65(2):10. doi: 10.1167/iovs.65.2.10. Invest Ophthalmol Vis Sci. 2024. PMID: 38315495 Free PMC article.
-
Research Progress of Bioinspired Nanostructured Systems for the Treatment of Ocular Disorders.Pharmaceuticals (Basel). 2023 Jan 10;16(1):96. doi: 10.3390/ph16010096. Pharmaceuticals (Basel). 2023. PMID: 36678597 Free PMC article. Review.
References
-
- Chakravarthy U., Peto T. Current perspective on age-related macular degeneration. JAMA. 2020;324:794–795. - PubMed
-
- Mitchell P., Liew G., Gopinath B., Wong T.Y. Age-related macular degeneration. Lancet. 2018;392:1147–1159. - PubMed
-
- Wong W.L., Su X.Y., Li X., Cheung C.M., Klein R., Cheng C.Y., et al. Global prevalence of age-related macular degeneration and disease burden projection for 2020 and 2040: a systematic review and meta-analysis. Lancet Glob Health. 2014;2:e106–e116. - PubMed
LinkOut - more resources
Full Text Sources
Miscellaneous
