

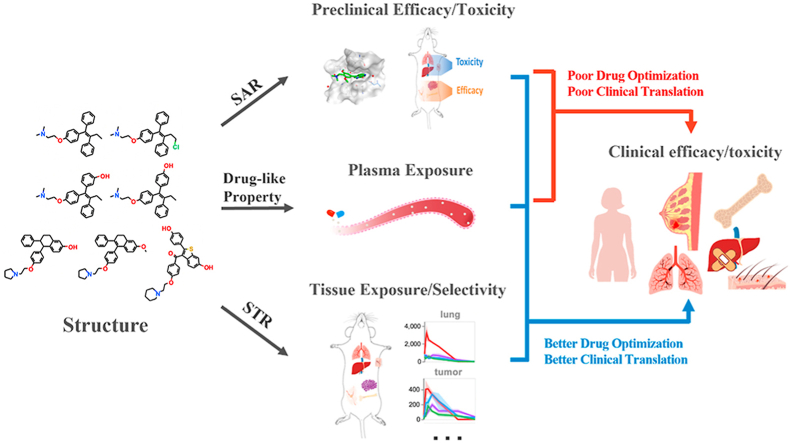
Structure‒tissue exposure/selectivity relationship (STR) correlates with clinical efficacy/safety
- PMID: 35646532
- PMCID: PMC9136610
- DOI: 10.1016/j.apsb.2022.02.015
Structure‒tissue exposure/selectivity relationship (STR) correlates with clinical efficacy/safety
Abstract
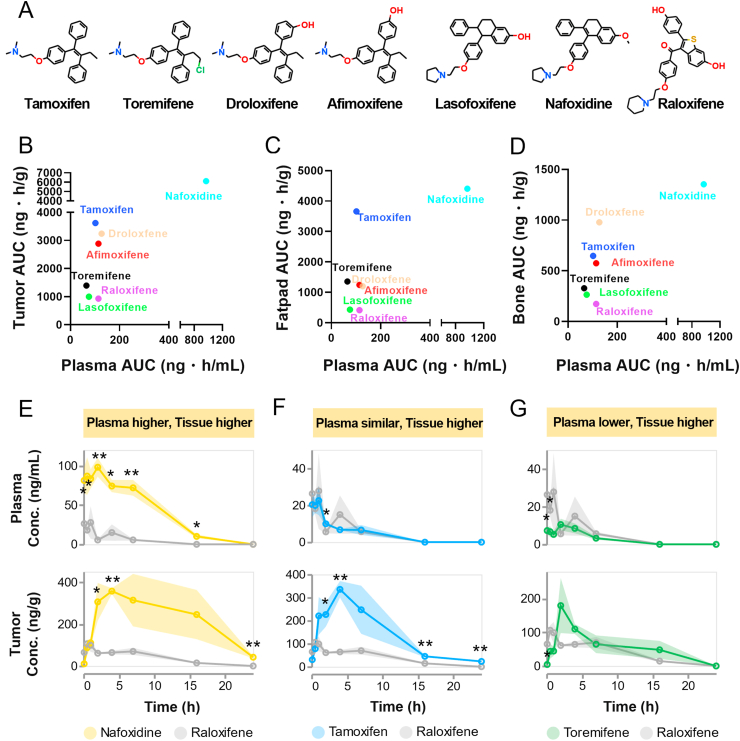
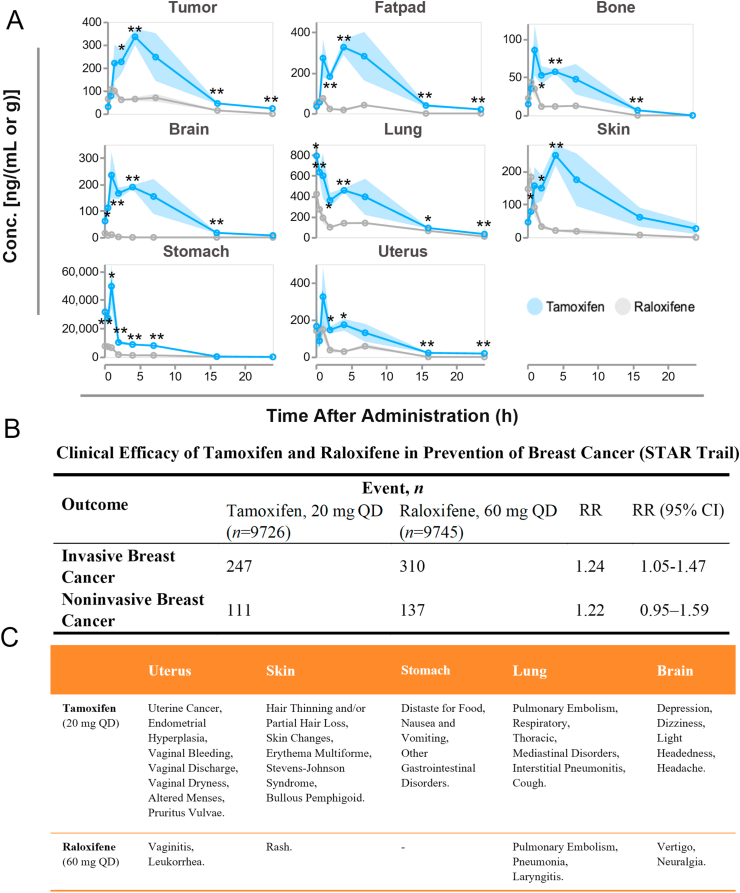
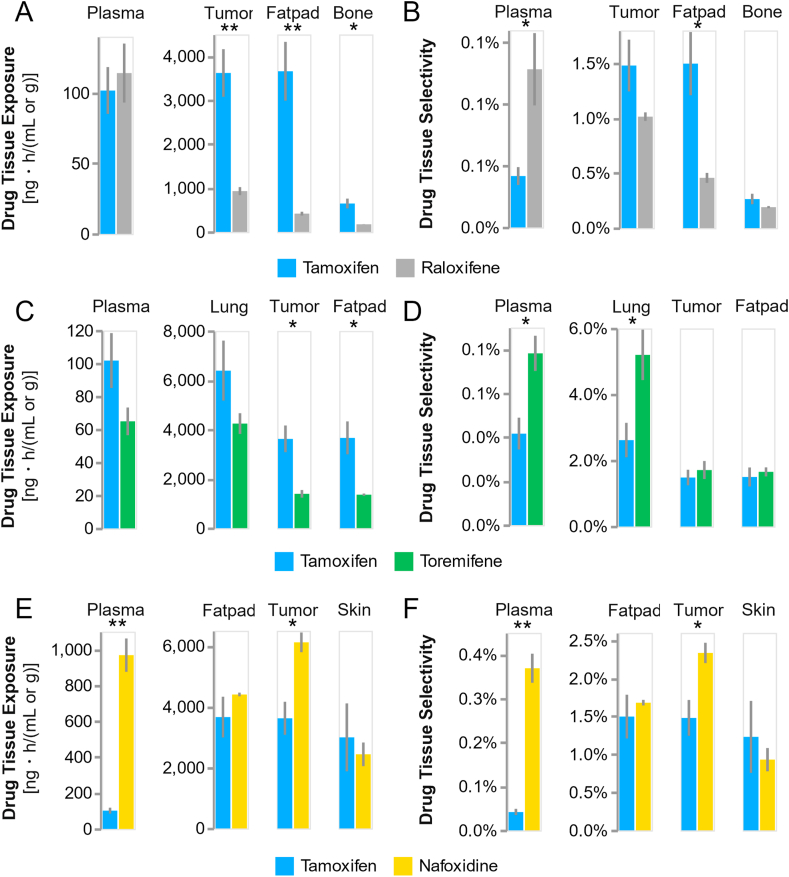
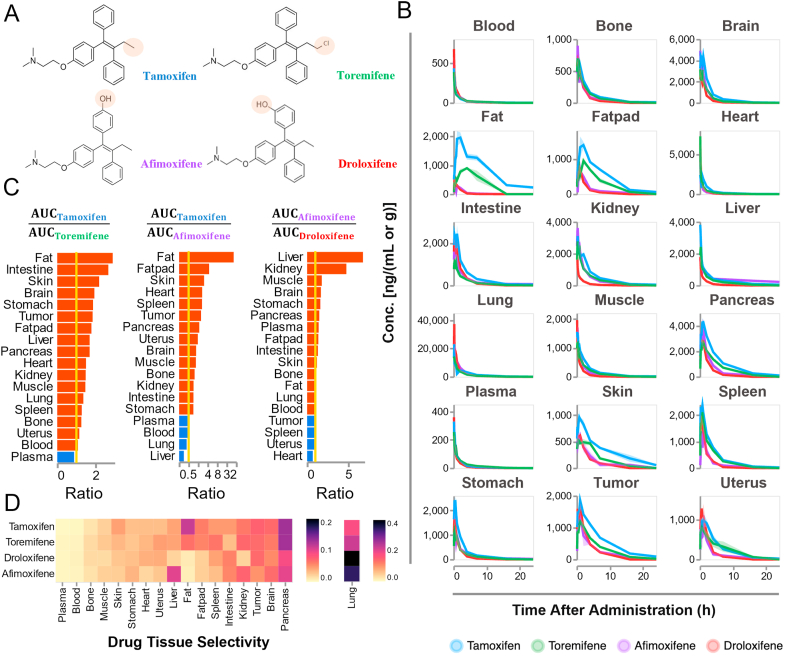
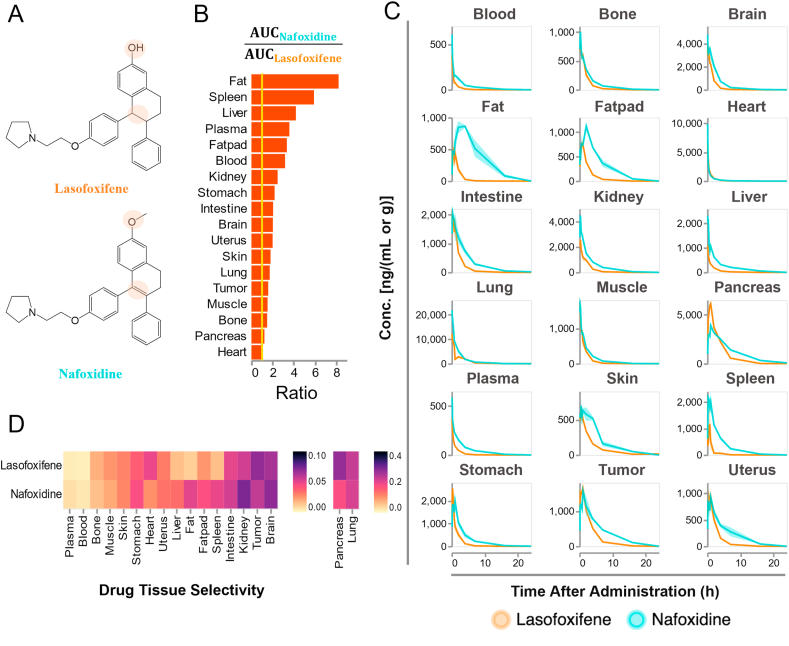
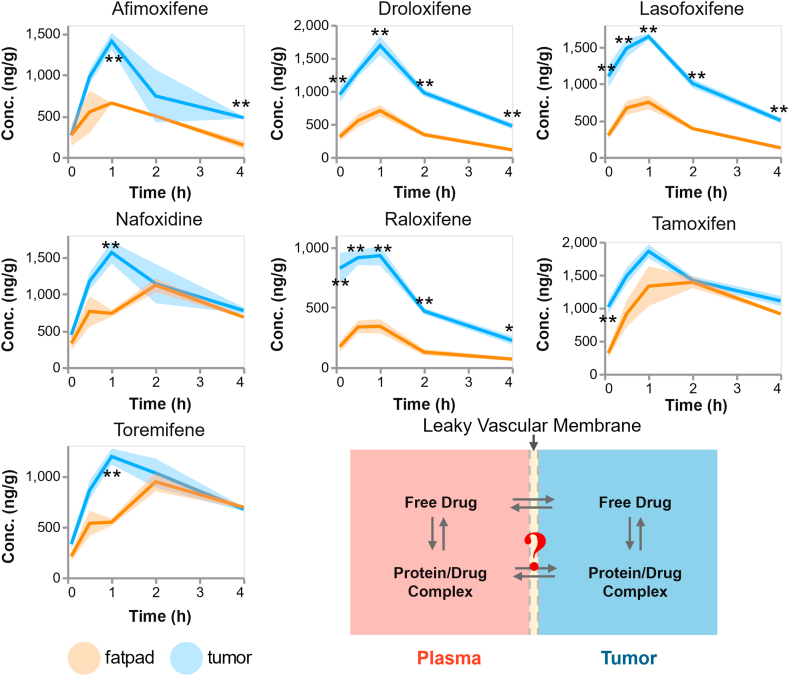
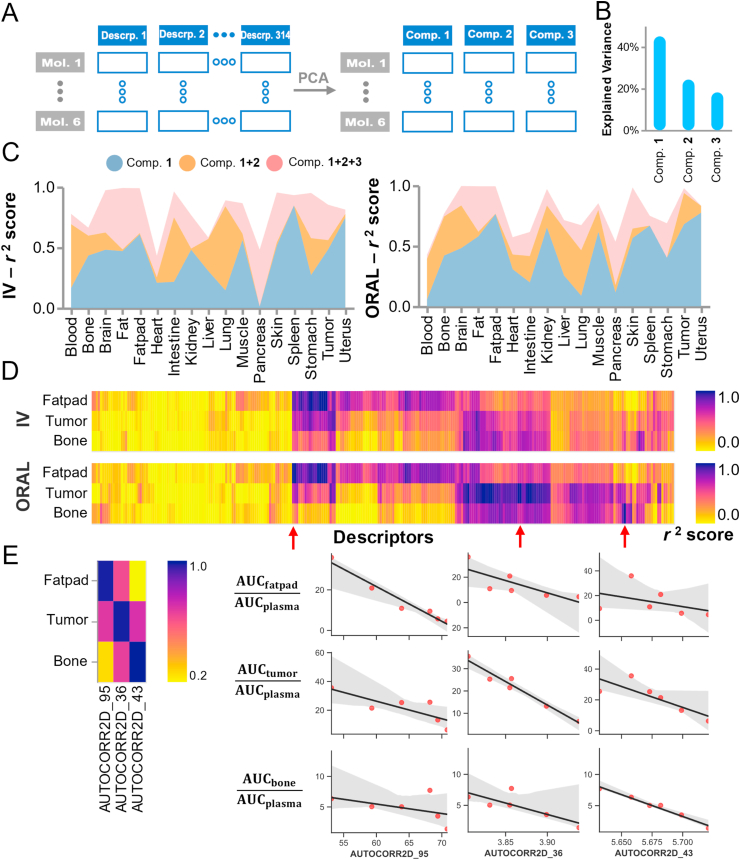
Drug optimization, which improves drug potency/specificity by structure‒activity relationship (SAR) and drug-like properties, is rigorously performed to select drug candidates for clinical trials. However, the current drug optimization may overlook the structure‒tissue exposure/selectivity-relationship (STR) in disease-targeted tissues vs. normal tissues, which may mislead the drug candidate selection and impact the balance of clinical efficacy/toxicity. In this study, we investigated the STR in correlation with observed clinical efficacy/toxicity using seven selective estrogen receptor modulators (SERMs) that have similar structures, same molecular target, and similar/different pharmacokinetics. The results showed that drug's plasma exposure was not correlated with drug's exposures in the target tissues (tumor, fat pad, bone, uterus), while tissue exposure/selectivity of SERMs was correlated with clinical efficacy/safety. Slight structure modifications of four SERMs did not change drug's plasma exposure but altered drug's tissue exposure/selectivity. Seven SERMs with high protein binding showed higher accumulation in tumors compared to surrounding normal tissues, which is likely due to tumor EPR effect of protein-bound drugs. These suggest that STR alters drug's tissue exposure/selectivity in disease-targeted tissues vs. normal tissues impacting clinical efficacy/toxicity. Drug optimization needs to balance the SAR and STR in selecting drug candidate for clinical trial to improve success of clinical drug development.
Keywords: Clinical efficacy/toxicity; Drug development; Drug optimization; Structure-tissue exposure/selectivity relationship (STR); Structure‒activity-relationship (SAR).
© 2022 Chinese Pharmaceutical Association and Institute of Materia Medica, Chinese Academy of Medical Sciences. Production and hosting by Elsevier B.V.
Figures
Similar articles
-
Why 90% of clinical drug development fails and how to improve it?Acta Pharm Sin B. 2022 Jul;12(7):3049-3062. doi: 10.1016/j.apsb.2022.02.002. Epub 2022 Feb 11. Acta Pharm Sin B. 2022. PMID: 35865092 Free PMC article. Review.
-
Structure-Tissue Exposure/Selectivity Relationship (STR) on Carbamates of Cannabidiol.Int J Mol Sci. 2024 Nov 5;25(22):11888. doi: 10.3390/ijms252211888. Int J Mol Sci. 2024. PMID: 39595958 Free PMC article.
-
Selective estrogen receptor modulators: mechanism of action and clinical experience. Focus on raloxifene.Reprod Fertil Dev. 2001;13(4):331-6. doi: 10.1071/rd00109. Reprod Fertil Dev. 2001. PMID: 11800172 Review.
-
Network predicting drug's anatomical therapeutic chemical code.Bioinformatics. 2013 May 15;29(10):1317-24. doi: 10.1093/bioinformatics/btt158. Epub 2013 Apr 5. Bioinformatics. 2013. PMID: 23564845
-
Medicinal chemistry and emerging strategies applied to the development of selective estrogen receptor modulators (SERMs).Curr Med Chem. 2007;14(11):1249-61. doi: 10.2174/092986707780598023. Curr Med Chem. 2007. PMID: 17504144 Review.
Cited by
-
A new paradigm for drug discovery in the treatment of complex diseases: drug discovery and optimization.Chin Med. 2025 Mar 24;20(1):40. doi: 10.1186/s13020-025-01075-4. Chin Med. 2025. PMID: 40122800 Free PMC article. Review.
-
In silico off-target profiling for enhanced drug safety assessment.Acta Pharm Sin B. 2024 Jul;14(7):2927-2941. doi: 10.1016/j.apsb.2024.03.002. Epub 2024 Mar 6. Acta Pharm Sin B. 2024. PMID: 39027254 Free PMC article.
-
Progress and application of lung-on-a-chip for lung cancer.Front Bioeng Biotechnol. 2024 May 24;12:1378299. doi: 10.3389/fbioe.2024.1378299. eCollection 2024. Front Bioeng Biotechnol. 2024. PMID: 38854856 Free PMC article. Review.
-
A gastrointestinal locally activating Janus kinase inhibitor to treat ulcerative colitis.J Biol Chem. 2023 Dec;299(12):105467. doi: 10.1016/j.jbc.2023.105467. Epub 2023 Nov 17. J Biol Chem. 2023. PMID: 37979913 Free PMC article.
-
Exploring bioactive molecules released during inter- and intraspecific competition: A paradigm for novel antiparasitic drug discovery and design for human use.Curr Res Parasitol Vector Borne Dis. 2025 Mar 25;7:100256. doi: 10.1016/j.crpvbd.2025.100256. eCollection 2025. Curr Res Parasitol Vector Borne Dis. 2025. PMID: 40292016 Free PMC article. Review.
References
-
- Dowden H., Munro J. Trends in clinical success rates and therapeutic focus. Nat Rev Drug Discov. 2019;18:495–496. - PubMed
-
- Harrison R.K. Phase II and Phase III failures: 2013-2015. Nat Rev Drug Discov. 2016;15:817–818. - PubMed
-
- Wassermann A.M., Wawer M., Bajorath J. Activity landscape representations for structure−activity relationship analysis. J Med Chem. 2010;53:8209–8223. - PubMed
LinkOut - more resources
Full Text Sources
Other Literature Sources
Miscellaneous
