. 2022 May 14:27:100368.
doi: 10.1016/j.pacs.2022.100368. eCollection 2022 Sep.

Modeling photoacoustic pressure generation in colloidal suspensions at different volume fractions based on a multi-scale approach

Affiliations

Modeling photoacoustic pressure generation in colloidal suspensions at different volume fractions based on a multi-scale approach

Hiroyuki Fujii et al. Photoacoustics. .

Abstract

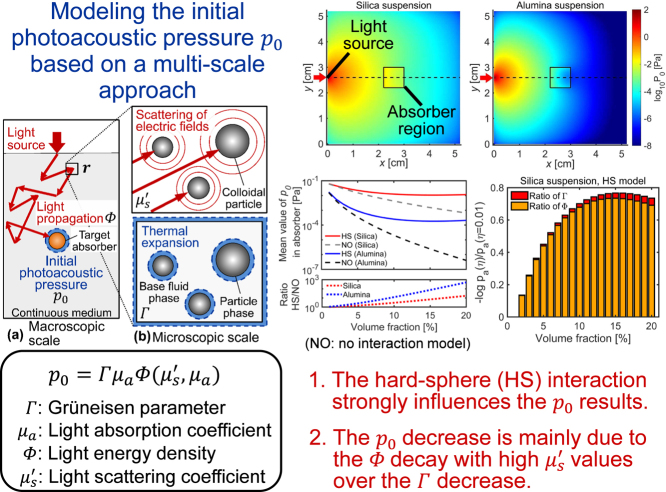
Further development of quantitative photoacoustic tomography requires understanding the photoacoustic pressure generation by modeling the generation process. This study modeled the initial photoacoustic pressure in colloidal suspensions, used as tissue phantoms, at different volume fractions on a multi-scale approach. We modeled the thermodynamic and light scattering properties on a microscopic scale with/without treating the hard-sphere interaction between colloidal particles. Meanwhile, we did the light energy density on a macroscopic scale. We showed that the hard-sphere interaction significantly influences the initial pressure and related quantities at a high volume fraction except for the thermodynamic properties. We also showed the initial pressure at the absorber inside the medium logarithmically decreases with increasing the volume fractions. This result is mainly due to the decay of the light energy density with light scattering. Our numerical results suggest that modeling light scattering and propagation is crucial over modeling thermal expansion.

Keywords: Grüneisen parameter; Hard-sphere interaction between colloidal particles; Light scattering properties; Modeling photoacoustic pressure generation; Multi-scale approach.


Conflict of interest statement

The authors declare that they have no known competing financial interests or personal relationships that could have appeared to influence the work reported in this paper.

Figures

None
Graphical abstract
Fig. 1
Fig. 1
Schematic of the initial photoacoustic pressure model for a colloidal suspension based on the multi-scale approach: (a) macroscopic and (b) microscopic scales. In the figure (b)’s top, the red arrow represents the incident direction of the electric fields and red spherical waves the scattered fields from colloidal particles. In the figure (b)’s bottom, blue regions represent the small volume changes by thermal expansion.
Fig. 2
Fig. 2
(a, b) Specific heat capacity at constant pressure C for the silica and alumina suspensions at different volume fractions; numerical results for the WB and WCS models (Eqs. (3), (10)), and experimental results. We used the measurement data of (a) silica suspensions by O’Hanley et al.  and Sorour et al. ; and (b) alumina suspensions by O’Hanley et al.  and by Zhou and Ni . (c) Normalized C-results by the water value Cw using the two models for the two suspensions. (d) Normalized thermal expansion coefficient by the water value βw using the two models (Eqs. (4), (9)). Figures (c) and (d)’s bottom plots the relative differences (RD) in the normalized results between the two models.
Fig. 3
Fig. 3
(a) Sound velocity V for the silica suspension at different volume fractions; numerical results for the Urick and UCS models (Eqs. (5), (15)); and experimental results by Pryazhnikov and Minakov  and by Dukhin et al. . (b) Normalized V-results by the water value (ρwκw)1/2 for the silica and alumina suspensions using the two models. (c) Isothermal compressibility κ normalized by the water value κw using the Urick and UCS models (Eqs. (6), (11)). (d) Grüneisen parameter (GP), Γ, using the no interaction (NO) and hard-sphere (HS) models (Eqs. (7), (14)). On the right axis, the normalized Γ-results by the water value of 0.127 are plotted.
Fig. 4
Fig. 4
Reduced scattering coefficients at different volume fractions for silica and alumina suspensions using the IST (no interaction) and DST (hard-sphere interaction). On the right axis, the normalized values by the result for the IST at the volume fraction of 1% are plotted.
Fig. 5
Fig. 5
(a, b) Spatial distributions of the light energy density Φ at a plane of z=2.6 cm using the PDE with the DST for the two suspensions at the volume fraction of 15%. A red arrow denotes the light source incident on (0.0 cm, 2.6 cm, 2.6 cm); black square a boundary of the single absorber with a size of 0.8 cm. (c, d) The Φ-calculations from the PDE with the DST or IST for the different distances between the source position and the calculating points on the line of (x, 2.6, 2.6) denoted by the black dashed line in the figures (a) and (b). The bottom figures plot the ratio of Φ-results using the DST with those using the IST.
Fig. 6
Fig. 6
(a, b) Spatial distributions of the initial photoacoustic pressure p0 at the plane of z=2.6 cm using the hard-sphere (HS) model (Eq. (16)) for the two suspensions at the volume fraction of 15%. Other details are the same as Fig. 5(a) and (b). (c, d) The p0-calculations using the HS model and no interaction (NO) model (Eq. (17)) at the different distances. The bottom figures plot the ratio of p0-results using the HS model with those using the NO model. Other details are the same as Fig. 5(c) and (d). (e) Mean values of p0 over the absorber region, pa, at different volume fractions. (f) Logarithmic pa-decrease, log10pa(η)/pa(η=0.01), for silica suspensions with the HS model. The pa-decrease is decomposed into the ratios of Γ and Φ.

References

    1. Wang L.V., Wu H. John Wiley & Sons, Ltd; 2009. Biomedical Optics: Principles and Imaging.
    1. Wang L.V., Hu S. Photoacoustic tomography : In vivo imaging from organelles to organs. Science. 2012;335(6075):1458–1463. - PMC - PubMed
    1. Cox B., Laufer J.G., Arridge S.R., Beard P.C. Quantitative spectroscopic photoacoustic imaging : a review. J. Biomed. Opt. 2012;17(6) 1–22. - PubMed
    1. Ntziachristos V. Going deeper than microscopy: The optical imaging frontier in biology. Nature Methods. 2010;7(8):603–614. - PubMed
    1. Yang H., Irudayaraj J. Characterization of beef and pork using fourier-transform infrared photoacoustic spectroscopy. LWT - Food Sci. Technol. 2001;34(6):402–409.

LinkOut - more resources