. 2022 May 12:10:865948.
doi: 10.3389/fcell.2022.865948. eCollection 2022.

Thyroid Hormones Deficiency Impairs Male Germ Cell Development: A Cross Talk Between Hypothalamic-Pituitary-Thyroid, and-Gonadal Axes in Zebrafish

Affiliations

Thyroid Hormones Deficiency Impairs Male Germ Cell Development: A Cross Talk Between Hypothalamic-Pituitary-Thyroid, and-Gonadal Axes in Zebrafish

Maira S Rodrigues et al. Front Cell Dev Biol. .

Abstract

In vertebrates, thyroid hormones are critical players in controlling different physiological processes such as development, growth, metabolism among others. There is evidence in mammals that thyroid hormones are also an important component of the hormonal system that controls reproduction, although studies in fish remain poorly investigated. Here, we tested this hypothesis by investigating the effects of methimazole-induced hypothyroidism on the testicular function in adult zebrafish. Treatment of fish with methimazole, in vivo, significantly altered zebrafish spermatogenesis by inhibiting cell differentiation and meiosis, as well as decreasing the relative number of spermatozoa. The observed impairment of spermatogenesis by methimazole was correlated with significant changes in transcript levels for several genes implicated in the control of reproduction. Using an in vitro approach, we also demonstrated that in addition to affecting the components of the brain-pituitary-peripheral axis, T3 (triiodothyronine) also exerts direct action on the testis. These results reinforce the hypothesis that thyroid hormones are an essential element of multifactorial control of reproduction and testicular function in zebrafish and possibly other vertebrate species.

Keywords: germ cell; hypothyroidism; methimazole; spermatogenesis; thyroid hormones; zebrafish.


Conflict of interest statement

The authors declare that the research was conducted in the absence of any commercial or financial relationships that could be construed as a potential conflict of interest.

Figures

FIGURE 1
FIGURE 1
(A) Experimental design representation of treatments: control (non-treated fish), methimazole (1 mM) and methimazole (1 mM) co-treated with T4 (100 μg/L) groups. Zebrafish adult males were exposed to reconstituted water containing 1 mM methimazole (goitrogen) for 21 days or 1 mM methimazole following T4 (100 μg/L) added in the water from the second week until the end of exposure. The control group received the same volume of vehicle solution. T3 levels (ng/mL plasma) and thyroid follicles were evaluated after treatments. (B) Levels of Triiodothyronine (T3) in the plasma of adult male zebrafish following methimazole induced-hypothyroidism and methimazole co-treated with T4. Bars represent the mean ± SEM (n = 5 per condition). ANOVA followed by Dunnett’s multiple comparison tests. Distinct letters denote significant differences (p < 0.05) between different treatment conditions with the control group. After 3 weeks heads were dissected for histological analysis of thyroid follicles (C–E). Control group (C) have thyroid follicles typical of euthyroid animals. These thyroid follicles display squamous or cuboidal epithelial cells and are totally filled with colloid. However, animals treated with methimazole (D) revealed disturbed thyroid follicles with columnar epithelium, follicle cell hypertrophy and colloid depletion, while fish co-treated with T4 (E) showed follicles similar to the control animals. Staining: Toluidine blue with sodium borate. Scale bar = 20 μm.
FIGURE 2
FIGURE 2
Histomorphometrical evaluation of zebrafish testes after in vivo exposure to methimazole and co-treatment with T4 for 3 weeks. Control group (non-treated fish) (A). Methimazole-treated group (B). Methimazole co-treated with T4 (C). Asterisks in (A), (B) and (C) indicate the testicular lumen with spermatozoa that appeared reduced in the methimazole group. (D) Proportion of section area occupied by different spermatogenic cysts: type A undifferentiated spermatogonia (Aund*, Aund), type A differentiated spermatogonia (Adiff), type B spermatogonia (SpgB), spermatocytes (Spc), and spermatids (Spt). Bars (mean ± SEM; n = 8) are expressed as fold-change relative to the no-treated fish (control group) (dotted black line set at 1). (E) Spermatozoa number per field generated by using IMAGEJ Software from control and treatments. ANOVA followed by Dunnett’s multiple comparison tests. Distinct letters denote significant differences (p < 0.05) between different treatment conditions with the untreated group. Asterisks denote statistical significance differences between control, methimazole and methimazole + T4 groups; *p < 0.05; **p < 0.01 (Student unpaired t-test; n = 8). Staining: Toluidine blue. Scale bar = 50 µm.
FIGURE 3
FIGURE 3
Relative mRNA levels of selected genes expressed in zebrafish testis after in vivo exposure to methimazole and methimazole co-treated with T4 for 3 weeks. The selected genes thrα and thrβ (thyroid hormones receptor) (A,B); fshr (follicle-stimulating hormone receptor) (C); genes expressed by somatic cells (Leydig and Sertoli cells) (D–I); cyp17a1 (17α-hydroxylase/17,20 lyase) (D); insl3 (insulin-like peptide 3) (E); cx43 (testicular connexin) (F); igf3 (insulin-like growth factor 3) (G); amh (anti-Müllerian hormone) (H); gsdf (gonadal somatic cell derived factor) (I); and germ cell markers (J–M); nanos2 (J); dazl (deleted-in azoospermia-like) (K); sycp3l (synaptonemal complex protein 3) (L); odf3a (outer dense fiber of sperm tails 3B) (M) were evaluated. Ct values were normalized with β-actin and expressed as relative values of control levels of expression. Bars represent the mean ± SEM fold change (n = 8) relative to the control, which is set at 1. Student unpaired t-test. Different letters denote significant differences (p < 0.05) between different treatment conditions with the control.
FIGURE 4
FIGURE 4
(A) Experimental design. 11-Ketotestosterone (11-KT) plasma levels (ng/mL plasma) was evaluated in zebrafish males exposed to different treatments: Control (non-treated fish), T4 (100 μg/L), methimazole (1 mM) and methimazole (1 mM) + T4 (100 μg/L). Amounts of 11-KT (ng/mg of testis weight) released by zebrafish testes were measured in the incubation media after 18 h (short-term exposure) in the presence or absence of Fsh (100 ng/ml) from control, T4, methimazole and methimazole + T4 groups. (B) Effect of T4, methimazole and combination of methimazole and T4 on 11-KT plasma levels. (C) Androgen (11-KT) release from zebrafish testicular explants previously treated with T4, methimazole or methimazole co-treated with T4. Bars represent the mean ± SEM (n = 8). ANOVA followed by Tukey’s test. Different letters denote significant difference (p < 0.05) between different treatments compared to the respective control group.
FIGURE 5
FIGURE 5
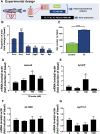
(A) Experiment 1: zebrafish adult males were exposed to methimazole-induced hypothyroidism for 3 weeks. (B) Experiment 2: zebrafish adult males were injected with 0 or 250 ng of T3/fish and tissue were collected 12 h post-injection. Relative mRNA levels of selected genes, including gnrh2 and gnrh3 (gonadotropin-releasing hormones), gnih (gonadotropin-inhibitory hormone), and crf (corticotropin-releasing hormone), expressed in the brain (n = 8), and lhβ (luteinizing hormone), fshβ (follicle-stimulating hormone), and tshβ (thyroid-stimulating hormone) expressed in the pituitary (n = 4 pools of 4 pituitaries for each pool) from the methimazole group (C) and 12 h post-injection with 0 and 250 ng of T3/fish (D). Ct values were normalized with β-actin and expressed as relative values of control (no-treated fish) levels of expression. Bars represent mean ± SEM fold-change relative to the control, which is set at 1. Student unpaired t-test, *p < 0.05, **p < 0.01 and ***p < 0.001.
FIGURE 6
FIGURE 6
(A) Experimental design of histomorphometrical analysis of zebrafish testicular explants incubated for 7 days (long-term exposure) with T3 (100 nM) compared to the control (basal) and gene expression of relative mRNA levels of several selected genes in zebrafish testis incubated to different concentrations of T3 (0, 10, 100 e 1,000 nM) for 7 days. (B) Histomorphometrical analysis of testicular explants containing types A undifferentiated spermatogonia (Aund*, Aund), type A differentiated spermatogonia (Adiff), type B spermatogonia (SpgB), spermatocytes (Spc), and spermatids (Spt). Bars (mean ± SEM; n = 8) are expressed as fold-change relative to the untreated group (control) (dotted black line set at 1). (C) Spermatozoa number per field generated by using IMAGEJ Software from zebrafish explants incubated for 7 days with basal (L-15) and T3 (100 nM). Bars (mean ± SEM; n = 8). Student paired t-test, *p < 0.05 and ***p < 0.001 denote significant differences between control and treated fish. The selected genes nanos2 (D), sycp3l (synaptonemal complex protein 3) (E), 3β-HSD (3-beta (β)-hydroxysteroid dehydrogenase) (F), and cyp17a1 (17α-hydroxylase/17,20 lyase/17,20 desmolase) (G) were evaluated. Ct values were normalized with β-actin and expressed as relative values of basal levels of expression. Bars represent the mean ± SEM fold change (n = 8), relative to the control (basal), which is set at 1. Paired t -test, *p < 0.05, **p < 0.01.

Similar articles

Cited by

References

    1. Abraham P., Acharya S. (2010). Current and Emerging Treatment Options for Graves&rsquo; Hyperthyroidism. Tcrm 6, 29–40. 10.2147/tcrm.s5229 - DOI - PMC - PubMed
    1. Allan E. R. O., Habibi H. R. (2012). Direct Effects of Triiodothyronine on Production of Anterior Pituitary Hormones and Gonadal Steroids in Goldfish. Mol. Reprod. Dev. 79, 592–602. 10.1002/mrd.22066 - DOI - PubMed
    1. Amano M., Moriyama S., Iigo M., Kitamura S., Amiya N., Yamamori K., et al. (2006). Novel Fish Hypothalamic Neuropeptides Stimulate the Release of Gonadotrophins and Growth Hormone from the Pituitary of Sockeye Salmon. J. Endocrinol. 188, 417–423. 10.1677/joe.1.06494 - DOI - PubMed
    1. Amin S. O., El-Sheikh A. S. (1977). Pituitary-testicular Function Changes in Hypo-And Hyperthyroid Male Rats. Cells Tissues Organs 98, 121–129. 10.1159/000144788 - DOI - PubMed
    1. Aoki Y., Nakamura S., Ishikawa Y., Tanaka M. (2009). Expression and Syntenic Analyses of FournanosGenes in Medaka. Zoological Sci. 26, 112–118. 10.2108/zsj.26.112 - DOI - PubMed

LinkOut - more resources