. 2022 May 13:10:853003.
doi: 10.3389/fcell.2022.853003. eCollection 2022.

Nuclear GSK-3β and Oncogenic KRas Lead to the Retention of Pancreatic Ductal Progenitor Cells Phenotypically Similar to Those Seen in IPMN

Affiliations

Nuclear GSK-3β and Oncogenic KRas Lead to the Retention of Pancreatic Ductal Progenitor Cells Phenotypically Similar to Those Seen in IPMN

Li Ding et al. Front Cell Dev Biol. .

Abstract

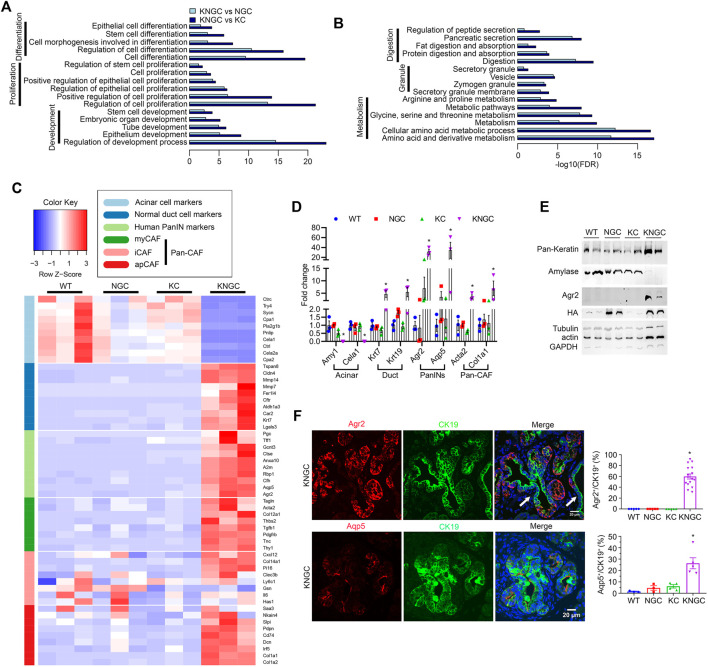
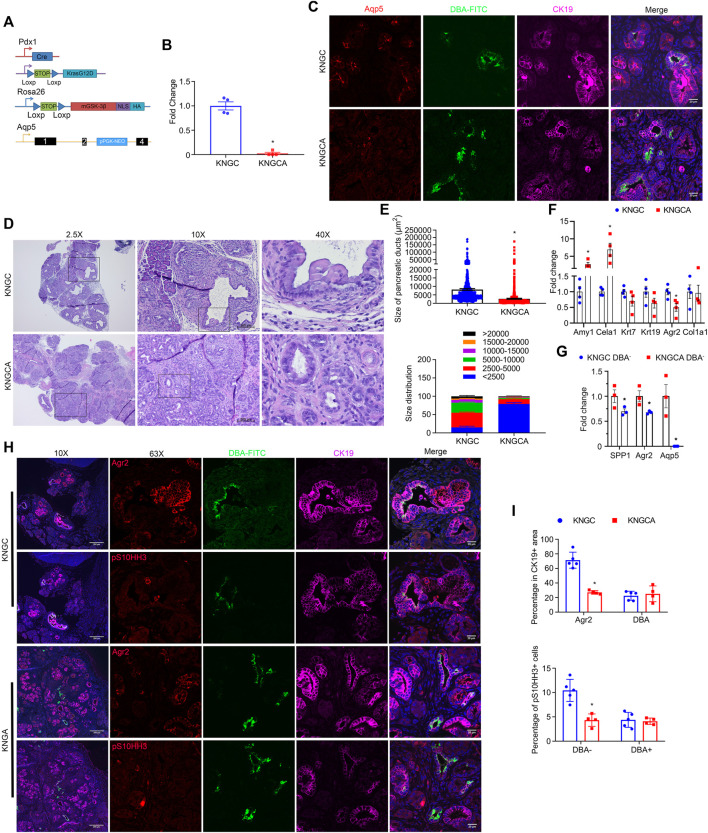
Glycogen synthase kinase-3β (GSK-3β) is a downstream target of oncogenic KRas and can accumulate in the nucleus in pancreatic ductal adenocarcinoma (PDA). To determine the interplay between oncogenic KRas and nuclear GSK-3β in PDA development, we generated Lox-STOP-Lox (LSL) nuclear-targeted GSK-3β animals and crossed them with LSL-KRasG12D mice under the control of the Pdx1-cre transgene-referred to as KNGC. Interestingly, 4-week-old KNGC animals show a profound loss of acinar cells, the expansion of ductal cells, and the rapid development of cystic-like lesions reminiscent of intraductal papillary mucinous neoplasm (IPMN). RNA-sequencing identified the expression of several ductal cell lineage genes including AQP5. Significantly, the Aqp5+ ductal cell pool was proliferative, phenotypically distinct from quiescent pancreatic ductal cells, and deletion of AQP5 limited expansion of the ductal pool. Aqp5 is also highly expressed in human IPMN along with GSK-3β highlighting the putative role of Aqp5+ ductal cells in human preneoplastic lesion development. Altogether, these data identify nGSK-3β and KRasG12D as an important signaling node promoting the retention of pancreatic ductal progenitor cells, which could be used to further characterize pancreatic ductal development as well as lineage biomarkers related to IPMN and PDA.

Keywords: AQP5; GSK-3β; KRAS; intraductal papillary mucinous neoplasm; pancreatic adenocarcinoma; progenitor cell.


Conflict of interest statement

The authors declare that the research was conducted in the absence of any commercial or financial relationships that could be construed as a potential conflict of interest.

Figures

FIGURE 1
FIGURE 1
Nuclear GSK-3β and KRasG12D promote pancreatic ductal cell expansion and IPMN development. (A) Schematic representation of KNGC (LSL-KRasG12D/Rosa26-LSL-nuclear GSK-3β/Pdx1-Cre) mouse model. Blue triangles indicate loxP sites. (B) Kaplan-Meier survival curve of the indicated genotypes. (C) Immunofluorescence (IF) staining of HA (red), amylase (green) and CK19 (purple) from pancreatic sections of indicated genotypes at 4 weeks age. Nuclei were counter-stained with Hoechst (blue). Shown are representative image from three different mice. (D) H&E-stained pancreatic sections from KNGC mice of 4-week, 4-month, and 8-month. Black boxes indicate magnified area. Bars = 200 μm. (E) Quantification of pancreatic duct size distribution and distribution of pancreatic duct size for KNGC mice were analyzed and expressed as mean ± SEM. n = 5. ∗p < 0.05 4-month versus 4-week KNGC mice. # p < 0.05 8-month versus 4-month KNGC mice.
FIGURE 2
FIGURE 2
Transcriptional regulation of pancreatic ductal neoplasia by nuclear GSK-3β and KrasG12D. (A) KEGG cellular processes enriched for genes with increased expression in KNGC mice compared with NGC or KC. (B) KEGG cellular processes enriched for genes with decreased expression in KNGC mice compared with NGC or KC. (C) Heatmap was generated for selected gene sets related to the indicated groups using normalized gene expression. Colors are assigned based on raw z-scores. (D) Real-time PCR quantification of the indicated genes from 4-week-old WT, NGC, KC or KNGC mice. Data were analyzed and expressed as mean ± SEM. n = 3. ∗p < 0.05 KNGC mice versus the other genotypes. (E) Cell lysates from pancreas of 4-week-old WT, NGC, KC and KNGC mice were prepared and probed with the indicated antibodies. Shown are representative results from three experiments. (F) Immunofluorescence staining of Agr2 (red, top), Aqp5 (red, bottom) and CK19 (green) from pancreatic sections of 4-week-old KNGC mice. White arrow indicated Agr2 (top) and Aqp5 (bottom)/CK19+ cells. And quantification of Agr2+ and Aqp5+ percentage in CK19 cells was analyzed and expressed as mean ± SEM. ∗p < 0.05 KNGC mice versus the other genotypes.
FIGURE 3
FIGURE 3
scRNA-Seq analysis reveals a progenitor-like ducts for the ductal hyperplasia in KNGC mice. (A) UMAP plot of 4,705 cells, colored by cell type identified by cluster markers. (B) Gene expression dot plot showing selected cluster-specific genes. Rows are clusters and columns are genes. Size of the dots indicates percentage of cells expressing a gene in each cluster. Color depth of the dot indicates normalized expression value. (C) UMAP plot of 4,705 cells colored by expression of selected genes from (B). (D) Heatmap showing average expression of selected genes with log foldchange over 1 (lfc > 1) across all clusters. (E) Top over-represented pathways for marker genes of cluster 8.
FIGURE 4
FIGURE 4
KNGC mice develop two distinct ductal populations. (A) Illustration of the experimental approach to purify lectin-expressing ductal cells through negative selection (anti-CD45 and anti-Podoplanin) and purification using the lectin-binding protein DBA. (B) Cell lysates from isolated DBA and DBA+ cell pools of five 4-week-old KNGC mice and pancreatic cells from WT, NGC, KC mice were prepared and probed with the indicated antibodies. (C) Real-time PCR quantification of the indicated genes from isolated DBA and DBA+ samples from 4-week-old KNGC mice. TBP, β-actin, RPLP0 and GAPDH were used as internal housekeeping gene controls. Data were analyzed and expressed as mean ± SEM. n = 3; ∗p < 0.05. (D) Immunofluorescence staining of Agr2 (red, upper panel) or Aqp5 (red, lower panel) with DBA-FITC (green) from pancreatic sections of 4-week-old KNGC mice. (E) Immunofluorescence staining of EdU (green), Aqp5 (red) and CK19 (purple) from pancreatic sections of 4-week-old KNGC mice. (F) Quantification of EdU positive percentage in Aqp5 positive or negative cells was analyzed and expressed as mean ± SEM. ∗p < 0.05 EdU positive in Aqp5 positive versus negative cells.
FIGURE 5
FIGURE 5
Aqp5 is necessary for the differentiation and growth of terminal ducts in KNGC mice. (A) Schematic representation of KNGCA (LSL-KRasG12D/Rosa26-LSL-nuclear GSK-3β/Pdx1-Cre/Aqp5 knockout) mouse model. Blue triangles indicate loxP sites. Black rectangles indicate exons of aqp5 gene. (B) Real-time PCR quantification of Aqp5 gene expression from 4-week-old KNGC and KNGCA mice. TBP, β-actin, RPLP0 and GAPDH were used as internal housekeeping gene controls. Data were analyzed and expressed as mean ± SEM. ∗p < 0.05 KNGCA versus KNGC mice. (C) Immunofluorescence staining of Aqp5 (red), DBA-FITC (green) and CK19 (purple) from pancreatic sections of 4-week-old KNGC and KNGCA mice. (D) H&E-stained pancreatic sections from KNGC and KNGCA mice. Black boxes indicated area magnified. Bars = 200 μm. (E) Quantification of pancreatic ducts size distribution and average pancreatic duct size were analyzed and expressed as mean ± SEM. n = 3. ∗p < 0.05 KNGCA versus KNGC mice. (F) Real-time PCR quantification of the indicated genes expressions from 4-week-old KNGC and KNGCA mice. Data were analyzed and expressed as mean ± SEM. ∗p < 0.05 KNGCA versus KNGC mice. (G) Real-time PCR quantification of the indicated gene expression in DBA ducts from 4-week-old KNGC and KNGCA mice. Data were analyzed and expressed as mean ± SEM. ∗p < 0.05 KNGCA versus KNGC mice. (H) Immunofluorescence staining of Agr2 (red, upper panel) or pS10HH3 (red, lower panel) with DBA-FITC (green) and CK19 (purple) from serial pancreatic sections of 4-week-old KNGC and KNGCA mice. (I) Quantification of percentage in CK19 positive cells, as well as percentage of pS10HH3 positive cells in DBA and DBA+ ducts were analyzed and expressed as mean ± SEM. ∗p < 0.05 KNGCA versus KNGC mice.
FIGURE 6
FIGURE 6
Aqp5, GSK-3β and Agr2 but not DBA staining is enriched in human IPMN. (A) Representative immunohistochemistry staining of GSK-3β (Top), Aqp5 (Middle), and immunofluorescence staining of Agr2 (red) with DBA-FITC (green) and CK19 (cyan) (Bottom) from serial sections of the same human IPMN sample. Bars = 200 μm. (B) Histological score (Hscore) of Aqp5, GSK-3β, Agr2 and DBA staining in 140 samples of human IPMN were calculated and graphed. The mean ± SD is shown. Black diamond: Mean value. Black line: Median value. (C) Scatter plot with loess fit line and 95% confidence limits (colored area) for Aqp5 and GSK-3β in overall samples (left) and IPMN with adenocarcinoma (right) were drawn and Spearman correlation coefficient were calculated with p-value.

Similar articles

Cited by

References

    1. American Cancer Society (2019). Cancer Facts & Figures 2019. Atlanta: American Cancer Society.
    1. Auciello F. R., Bulusu V., Oon C., Tait-Mulder J., Berry M., Bhattacharyya S., et al. (2019). A Stromal Lysolipid-Autotaxin Signaling Axis Promotes Pancreatic Tumor Progression. Cancer Discov. 9, 617–627. 10.1158/2159-8290.cd-18-1212 - DOI - PMC - PubMed
    1. Bardeesy N., DePinho R. A. (2002). Pancreatic Cancer Biology and Genetics. Nat. Rev. Cancer 2, 897–909. 10.1038/nrc949 - DOI - PubMed
    1. Baumgart S., Chen N.-M., Zhang J.-S., Billadeau D. D., Gaisina I. N., Kozikowski A. P., et al. (2016). GSK-3β Governs Inflammation-Induced NFATc2 Signaling Hubs to Promote Pancreatic Cancer Progression. Mol. Cancer Ther. 15, 491–502. 10.1158/1535-7163.mct-15-0309 - DOI - PMC - PubMed
    1. Beurel E., Grieco S. F., Jope R. S. (2015). Glycogen Synthase Kinase-3 (GSK3): Regulation, Actions, and Diseases. Pharmacol. Ther. 148, 114–131. 10.1016/j.pharmthera.2014.11.016 - DOI - PMC - PubMed