. 2022 May 11:10:840964.
doi: 10.3389/fcell.2022.840964. eCollection 2022.

Spatial Learning Promotes Adult Neurogenesis in Specific Regions of the Zebrafish Pallium

Affiliations

Spatial Learning Promotes Adult Neurogenesis in Specific Regions of the Zebrafish Pallium

Laura S Mazzitelli-Fuentes et al. Front Cell Dev Biol. .

Abstract

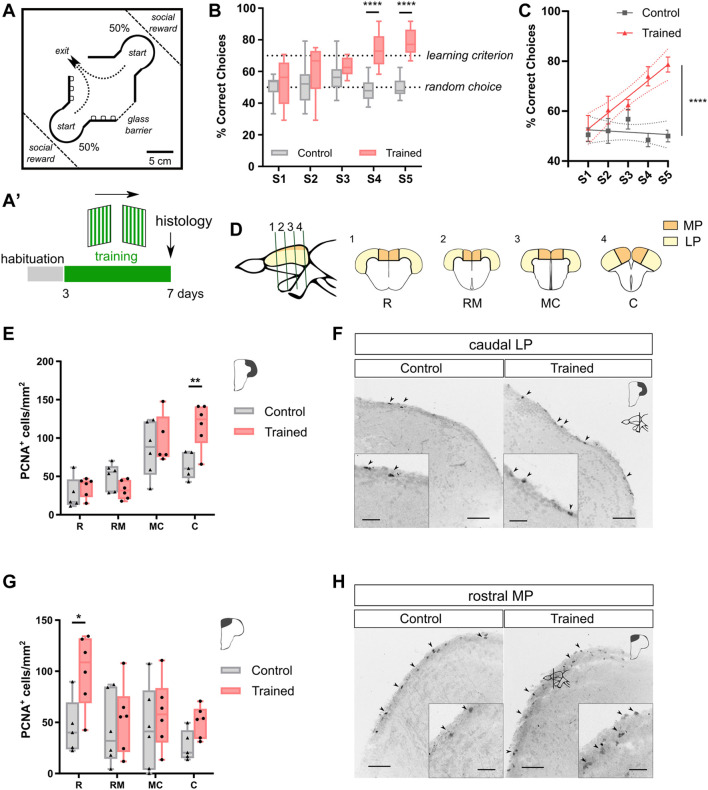
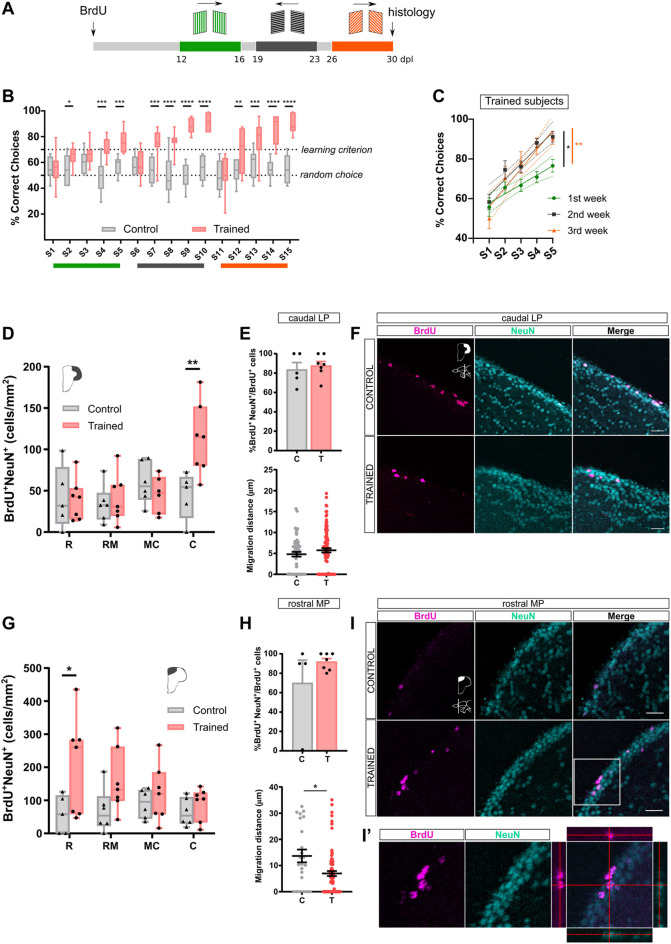
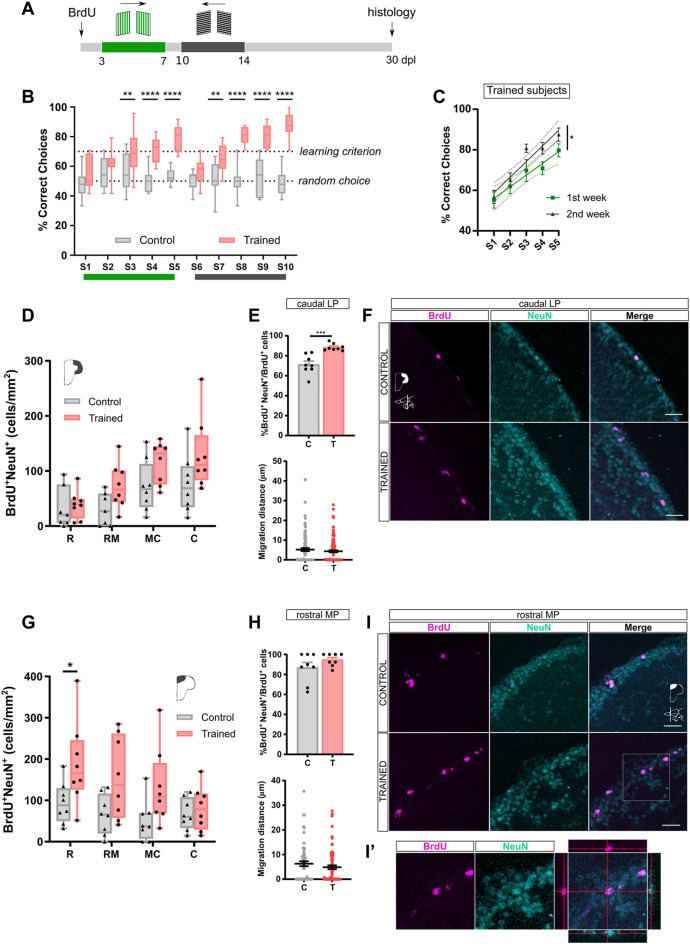
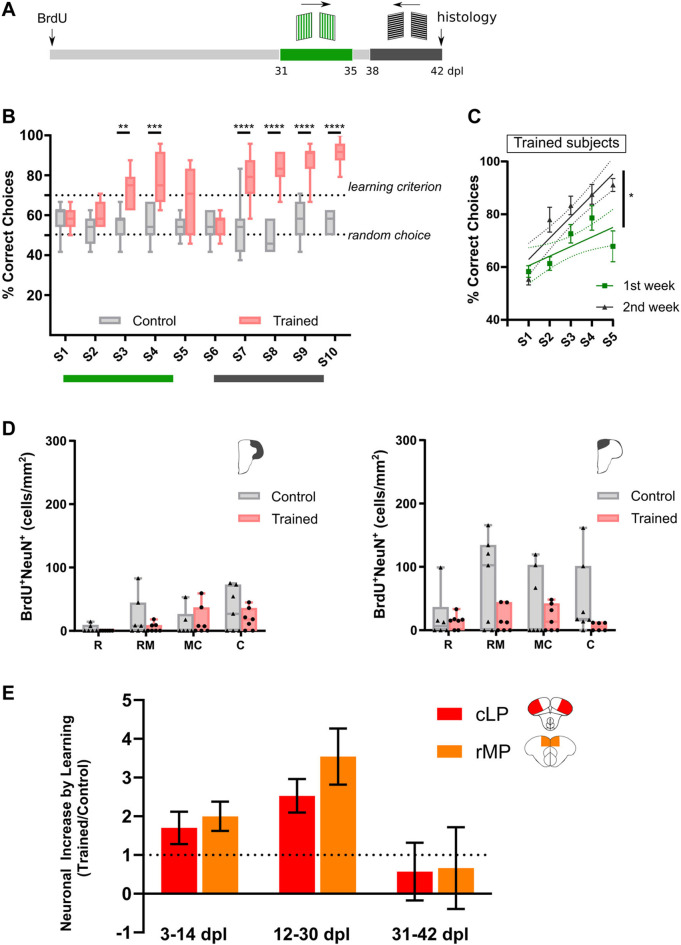
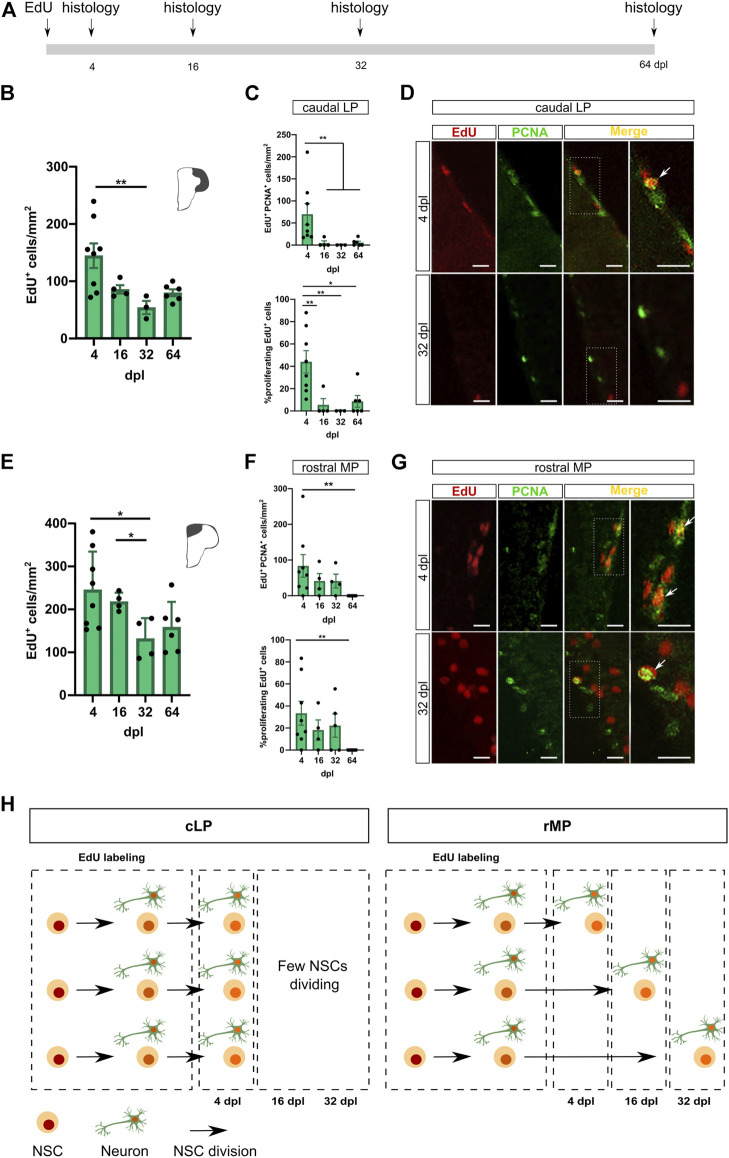
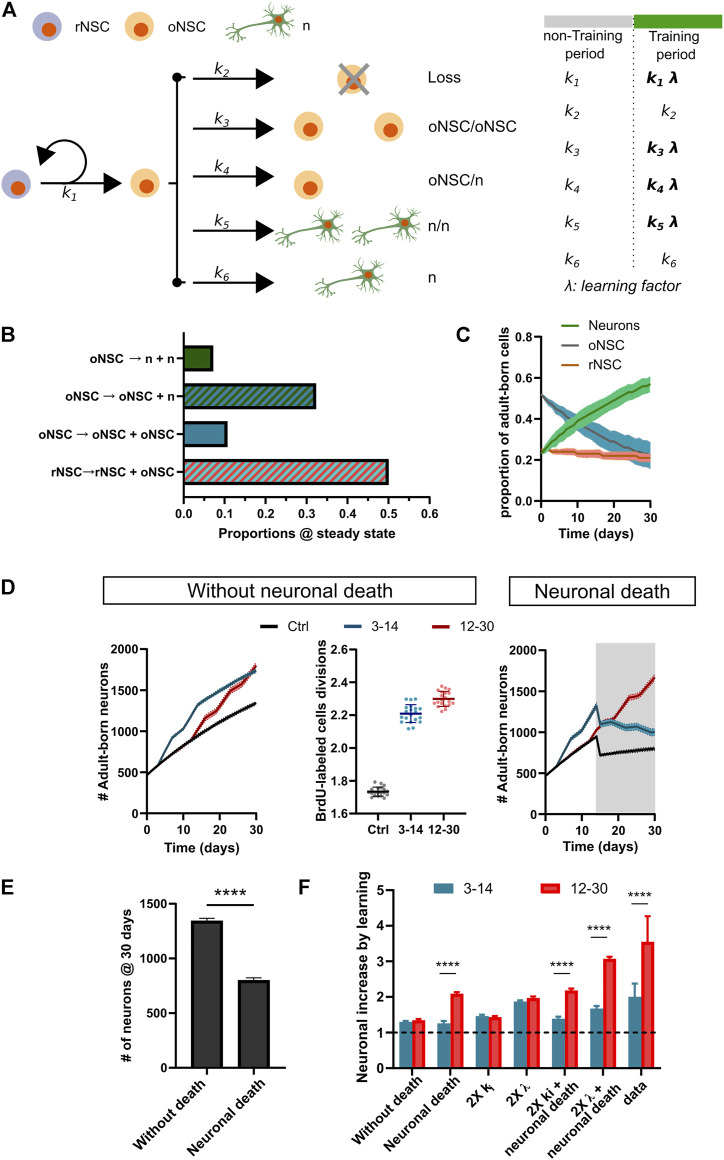
Adult neurogenesis could be considered as a homeostatic mechanism that accompanies the continuous growth of teleost fish. As an alternative but not excluding hypothesis, adult neurogenesis would provide a form of plasticity necessary to adapt the brain to environmental challenges. The zebrafish pallium is a brain structure involved in the processing of various cognitive functions and exhibits extended neurogenic niches throughout the periventricular zone. The involvement of neuronal addition as a learning-related plastic mechanism has not been explored in this model, yet. In this work, we trained adult zebrafish in a spatial behavioral paradigm and evaluated the neurogenic dynamics in different pallial niches. We found that adult zebrafish improved their performance in a cue-guided rhomboid maze throughout five daily sessions, being the fish able to relearn the task after a rule change. This cognitive activity increased cell proliferation exclusively in two pallial regions: the caudal lateral pallium (cLP) and the rostral medial pallium (rMP). To assessed whether learning impinges on pallial adult neurogenesis, mitotic cells were labeled by BrdU administration, and then fish were trained at different periods of adult-born neuron maturation. Our results indicate that adult-born neurons are being produced on demand in rMP and cLP during the learning process, but with distinct critical periods among these regions. Next, we evaluated the time course of adult neurogenesis by pulse and chase experiments. We found that labeled cells decreased between 4 and 32 dpl in both learning-sensitive regions, whereas a fraction of them continues proliferating over time. By modeling the population dynamics of neural stem cells (NSC), we propose that learning increases adult neurogenesis by two mechanisms: driving a chained proliferation of labeled NSC and rescuing newborn neurons from death. Our findings highlight adult neurogenesis as a conserved source of brain plasticity and shed light on a rostro-caudal specialization of pallial neurogenic niches in adult zebrafish.

Keywords: danio rerio (zebrafish); neural stem/progenitor cells; plasticity; spatial learning and memory; telencephalon.


Conflict of interest statement

The authors declare that the research was conducted in the absence of any commercial or financial relationships that could be construed as a potential conflict of interest.

Figures

FIGURE 1
FIGURE 1
Training adult zebrafish in a rhomboid maze boosts cell proliferation in the rMP and the cLP. (A). Experimental device. The maze contains two starting boxes, and two possible exits, one of which is blocked with a glass barrier. Fish were trained to find the correct exit, orientating themselves with cues placed on two walls. On the edges of the tank, two glass enclosures contained fish’s conspecifics as social reward. On each trial, fish were placed in a start box, and, once they reached the central arena, a correct choice was scored if they swam through the exit, and a failure if they bumped against the glass barrier. Each daily session consisted of 24 trials. (A') Behavioral schedule. Cue patterns and exit position (arrow) are specified above. Fish were habituated to the experimental tank for 2 days, and subsequently trained for five consecutive days. (B). Learning curves for Trained and Control individuals. Trained fish reach the learning criterion after five consecutive sessions. Controls do not exhibit a learning curve (Two-way RM ANOVA, Treatment effect: F(1, 14) = 25.78 with p = 0.0002, Session effect: F(4, 56) = 3.422 with p = 0.0143. Bonferroni’s multiple comparisons test, **** depicts p < 0.0001. Trained, N = 8; Control N = 8). Dashed line at 70% correct choices depicts learning criterion; dashed line at 50% correct choices indicates random choice. (C). Simple linear regression for Trained and Control individuals (ANCOVA, F(1, 77) = 9.010. **** depicts p < 0.0001. Trained, N = 8; Control N = 8). Dashed line indicates 95% confidence intervals. (D). Left: Sagittal schematic view of zebrafish forebrain, indicating the position of the cross sections on the right. Right: Cross sections of zebrafish telencephalon along rostro-caudal axis (R: rostral, RM: rostro-medial, MC: medio-caudal, C: caudal). The colored regions depict MP and LP. (E). PCNA+ cells in LP. (Two-way ANOVA, Treatment effect: F(1, 37) = 3.873 with p = 0.0566, Pallium region effect: F(3, 37) = 20.27 with p < 0.0001. Bonferroni’s multiple comparisons test, ** denotes p < 0.001. Trained, N = 6; Control, N = 6). (F). Cross sections of telencephalic pallium immunostained for PCNA in cLP of Trained and Control individuals. Scale bar, 50 μm. Scale bar in higher magnifications, 20 μm. Black arrows indicate representative PCNA+ cells. (G). PCNA+ cells in MP. (Two-way ANOVA, Treatment effect: F(1, 38) = 7.796 with p = 0.0082, Pallium region effect: F(3, 38) = 2.332 with p = 0.0895. Bonferroni’s multiple comparisons test, * denotes p < 0.05. Trained, N = 6; Control, N = 6). (H). Cross sections of telencephalic pallium immunostained for PCNA in rMP of Trained and Control individuals. Scale bar, 50 μm. Scale bar in higher magnifications, 20 μm. Black arrows indicate representative PCNA+ cells.
FIGURE 2
FIGURE 2
Sustained training of zebrafish from 12–30 dpl increases adult neurogenesis exclusively in the cLP and the rMP. (A). Experimental schedule. Fish were immersed in BrdU, and training started at 12 dpl. Training consisted of 15 sessions, distributed in three slots. Every five sessions both cues and exit position were changed. A 2-day interval was fixed between slots. At 30 dpl fish were euthanised for histology. (B). Learning curves for Trained and Control individuals (Two-way RM ANOVA, Treatment effect: F(1, 14) = 67.71 with p < 0.0001, Session effect: F(14, 196) = 6.805 with p < 0.0001. Bonferroni’s multiple comparisons test, * depicts p < 0.05, **p < 0.01, ****p < 0.0001. Trained, N = 8; Control N = 8). (C). Simple linear regression for each training window for Trained fish (ANCOVA, first vs. 2nd week: F(1,76) = 4.647; 1st vs. 3rd week: F(1,76) = 7.068, * indicates p < 0.05, **, p < 0.01. Trained, N = 8; Control N = 8). (D). BrdU+NeuN+ cell quantification in LP (Two-way ANOVA, Treatment effect: F(1, 41) = 2.766 with p = 0.103, Pallium region effect: F(3, 41) = 4.493 with p = 0.0098. Bonferroni’s multiple comparisons test, **p < 0.01. Trained, N = 7; Control N = 6). (E). Top: Neuronal fate (%BrdU+NeuN+/BrdU+ cells) in caudal LP (Unpaired t test, t(10) = 0.5091, n. s. Trained, N = 7; Control N = 5). Bottom: Cell migration in caudal LP (Mann Whitney test, U = 2419, n. s. Trained, N = 7; Control N = 6). (F). Adult-born neurons (BrdU/NeuN) in cLP for Trained and Control individuals. Scale bar, 20 μm. (G). BrdU+NeuN+ cell quantification in MP. (Two-way ANOVA, Treatment effect: F(1, 43) = 9.564 with p = 0.0035, Pallium region effect: F(3, 43) = 0.889 with p = 0.455. Bonferroni’s multiple comparisons test, *p < 0.05. Trained, N = 7; Control N = 6). (H). Top: Neuronal fate (%BrdU+NeuN+/BrdU+ cells) in rMP (Mann-Whitney test, U = 11.5, n. s. Trained, N = 7; Control N = 4). Bottom: Cell migration in rMP (Mann Whitney test, U = 602, * depicts p < 0.05. Trained, N = 7; Control, N = 4). (I). Adult-born neurons (BrdU/NeuN) in rMP for Trained and Control individuals. Scale bar, 20 μm. (I'). Higher magnification of the boxed square in I (merge panel). Single focal plane and orthogonal views after three-dimension reconstruction.
FIGURE 3
FIGURE 3
Training zebrafish during an early period (3–14 dpl) increases adult neurogenesis in the rMP. (A). Experimental design. (B). Learning curves for Trained and Control individuals (Two-way RM ANOVA, Treatment effect: F(1, 14) = 126.1 with p < 0.0001, Session effect: F(9, 126) = 5.254 with p < 0.0001. Bonferroni’s multiple comparisons test, *** depicts p < 0.001, ****, p < 0.0001. Trained, N = 8; Control N = 8). (C). Simple linear regression for each training window for Trained fish (ANCOVA, F(1, 76) = 1.516, n. s. Trained, N = 8; Control N = 8). (D). BrdU+NeuN+ cell quantification in LP. (Two-way ANOVA, Treatment effect: F(1, 54) = 10.63 with p = 0.0019, Pallium region effect: F(3, 54) = 8.642 with p < 0.0001. Bonferroni’s multiple comparisons test, not significant differences. Trained, N = 8; Control N = 8). (E). Top: Neuronal fate (%BrdU+NeuN+/BrdU+ cells) in cLP. (Unpaired t test, t(14) = 4.749, *** depicts p < 0.001. Trained, N = 8; Control N = 8). Bottom: Cell migration in cLP (Mann Whitney test, U = 6492, n. s. Trained, N = 8; Control N = 8). (F). Adult-born neurons (BrdU+NeuN+) in cLP for Trained and Control individuals. Scale bar, 20 μm. (G). BrdU+NeuN+ cell quantification in MP. (Two-way ANOVA, Treatment effect: F(1, 56) = 15.34 with p = 0.0002, Pallium region effect: F(3, 56) = 2.685 with p = 0.0553. Bonferroni’s multiple comparisons test, * depicts p < 0.05. Trained, N = 8; Control N = 8). (H). Top: Neuronal fate (%BrdU+NeuN+/BrdU+ cells) in rMP (Unpaired t test, t(14) = 1.396, n. s. Trained, N = 8; Control N = 8). Bottom: Cell migration in rMP (Mann Whitney test, U = 2088, n. s. Trained, N = 8; Control N = 8). (I). Adult-born neurons (BrdU+NeuN+) in rMP for Trained and Control individuals. Scale bar, 20 μm. (I'). Higher magnification of the boxed square in I (merge panel). Single focal plane and orthogonal views after three-dimension reconstruction.
FIGURE 4
FIGURE 4
Training adult zebrafish during a late period (31–42 dpl) has no effect on pallial neurogenesis. (A). Experimental design. (B). Learning curves for Trained and Control individuals. (Two-way RM ANOVA, Treatment effect: F(1, 12) = 108.0 with p < 0.0001, Session effect: F(9, 108) = 6.800 with p < 0.0001. Bonferroni’s multiple comparisons test, **p < 0.01, ***p < 0.001, ****p < 0.0001. Trained, N = 7; Control N = 7). (C). Simple linear regression for each training window for Trained fish (ANCOVA, F(1, 66) = 5.914, * indicates p < 0.05. Trained, N = 7; Control N = 7). (D). BrdU+NeuN+ cell quantification in LP (left) and MP (right) (Kruskal–Wallis test with: Left panel, p = 0.1984; Right panel, p = 0.316. Dunn’s multiple comparisons test, not significant differences were found. Trained, N = 7; Control, N = 7). (E). Neuronal increase ratio (Trained/Control) in rMP and cLP for each learning time frame.
FIGURE 5
FIGURE 5
Balance of adult neurogenesis driven by chained proliferation and loss of adult-born cells. (A). Experimental design. Fish were i. p. injected with EdU and euthanised for histology at three times points: 4, 16, 32 and 64 dpl. (B). EdU+ cell quantification in cLP in 4, 16, 32 and 64 dpl. (Kruskal–Wallis test, followed by post-hoc Dunn’s test, K-W st = 9.048, ** depicts p < 0.01. 4 dpl, N = 8; 16 dpl, N = 4; 32 dpl, N = 3, 64 dpl, N = 6). (C). Number of proliferating EdU cells (top) and % of proliferating EdU cells (bottom) (Kruskal–Wallis test, followed by post-hoc Dunn’s test, K-W st = 13.80 and K-W st = 12.88, respectively. * depicts p < 0.05, **, p < 0.01. 4 dpl, N = 8; 16 dpl, N = 4; 32 dpl, N = 3, 64 dpl, N = 6). (D). EdU/PCNA in cLP for 4 dpl and 32 dpl. Scale bar, 20 μm. (E). EdU+ cell quantification in rMP in 4, 16, 32 and 64 dpl. (Kruskal–Wallis test, followed by post-hoc Dunn’s test, K-W st = 7.88, * depicts p < 0.05. 4 dpl, N = 8; 16 dpl, N = 4; 32 dpl, N = 4, 64 dpl, N = 6). (F). Number of proliferating EdU cells (top) and % of proliferating EdU cells (bottom) (Kruskal–Wallis test, followed by post-hoc Dunn’s test, K-W st = 9.571 and K-W st = 8.827, respectively. ** depicts p < 0.01. 4 dpl, N = 8; 16 dpl, N = 4; 32 dpl, N = 3, 64 dpl, N = 6). (G). EdU/PCNA in rMP for 4 dpl and 32 dpl. Scale bar, 20 μm. (H). Scheme summarizing EdU/PCNA results in cLP and rMP.
FIGURE 6
FIGURE 6
A population NSC dynamics model mimics the learning-induced adult neurogenesis in the rMP. (A). Scheme outlining NSC population dynamics model. ki indicates rates of division/differentiation. The learning effect on NSC proliferation was simulated by adding a learning factor (λ) during training windows. rNSC: reservoir neural stem cell; oNSC: operative neural stem cell; n: neuron. (B). Number of cellular divisions at steady state, calculated to estimate the initial populations of BrdU-labeled cells. (C). Population dynamics under Control condition. (D). Left: Stochastic simulations to estimate the population of adult-born neurons in Control and Trained subjects during two training periods (3–14 dpl) and three training periods (12–30 dpl). Middle: BrdU-labeled cells division under Control and Training conditions. Right: Stochastic simulations to estimate the population of adult-born neurons considering a checkpoint (at 15 dpl) for neuronal death, together with a learning-induced rescue. (E). Adult-born neurons for Control subjects at 30 dpl, with and without neuronal death (Unpaired t-test, t(38) = 73.10, **** depicts p < 0.0001, N = 20). (F). Neuronal increase by learning under different conditions (Two-way ANOVA, Period effect: F(6, 239) = 430.7 with p < 0.0001, Condition effect: F(1, 239) = 1,342 with p < 0.0001. Post-hoc Sidak’s test **** depicts p < 0.0001- N = 20 for simulation, N = 5 for data).

Similar articles

Cited by

References

    1. Aasebø I. E. J., Kasture A. S., Passeggeri M., Tashiro A. (2018). A Behavioral Task with More Opportunities for Memory Acquisition Promotes the Survival of New Neurons in the Adult Dentate Gyrus. Sci. Rep. 8, 1–11. 10.1038/s41598-018-25331-w - DOI - PMC - PubMed
    1. Adams M. M., Kafaligonul H. (2018). Zebrafish-A Model Organism for Studying the Neurobiological Mechanisms Underlying Cognitive Brain Aging and Use of Potential Interventions. Front. Cel. Dev. Biol. 6, 1–5. 10.3389/fcell.2018.00135 - DOI - PMC - PubMed
    1. Adolf B., Chapouton P., Lam C. S., Topp S., Tannhäuser B., Strähle U., et al. (2006). Conserved and Acquired Features of Adult Neurogenesis in the Zebrafish Telencephalon. Dev. Biol. 295, 278–293. 10.1016/j.ydbio.2006.03.023 - DOI - PubMed
    1. Alonso M., Viollet C., Gabellec M.-M., Meas-Yedid V., Olivo-Marin J.-C., Lledo P.-M. (2006). Olfactory Discrimination Learning Increases the Survival of Adult-Born Neurons in the Olfactory Bulb. J. Neurosci. 26, 10508–10513. 10.1523/JNEUROSCI.2633-06.2006 - DOI - PMC - PubMed
    1. Alunni A., Bally-Cuif L. (2016). A Comparative View of Regenerative Neurogenesis in Vertebrates. Development 143, 741–753. 10.1242/dev.122796 - DOI - PMC - PubMed

LinkOut - more resources