. 2022 May 12:10:876893.
doi: 10.3389/fcell.2022.876893. eCollection 2022.

Sequence Determinants of TDP-43 Ribonucleoprotein Condensate Formation and Axonal Transport in Neurons

Affiliations

Sequence Determinants of TDP-43 Ribonucleoprotein Condensate Formation and Axonal Transport in Neurons

Sonali S Vishal et al. Front Cell Dev Biol. .

Abstract

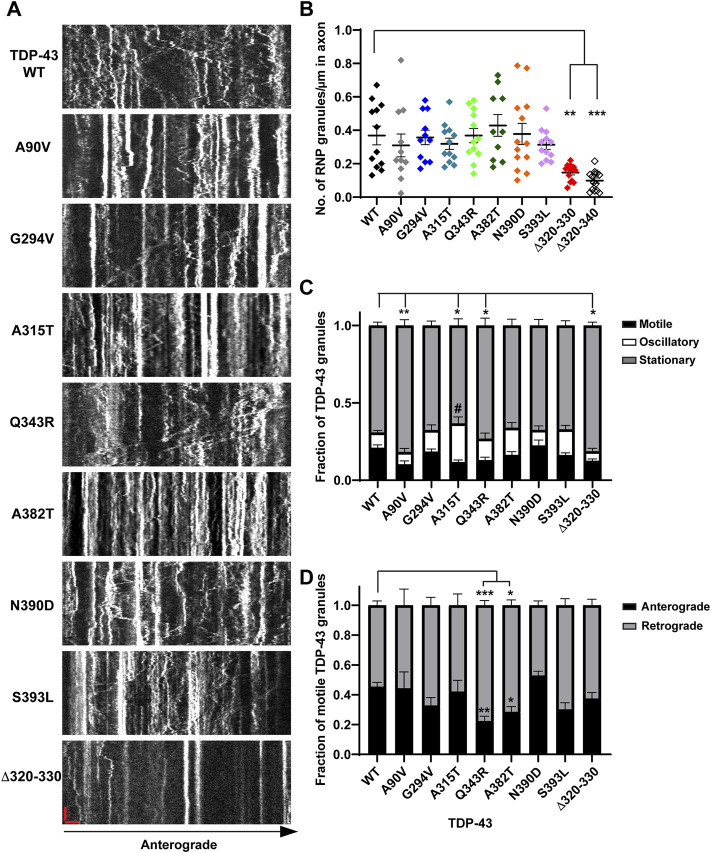
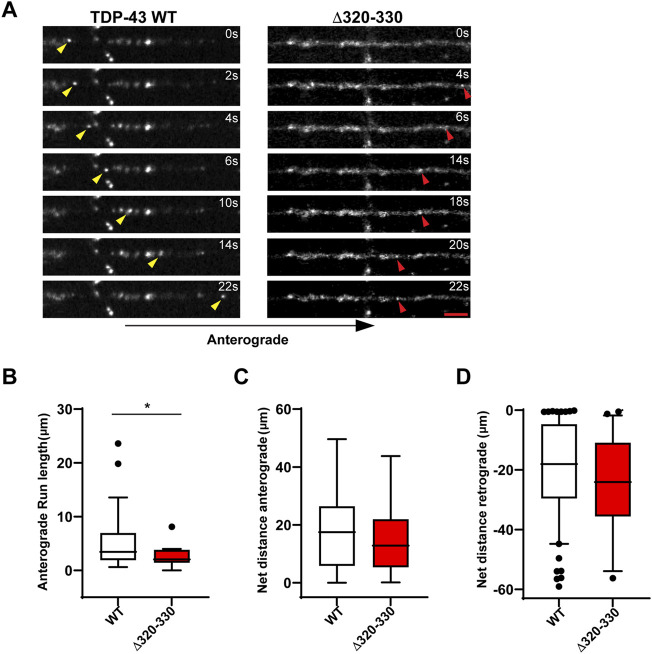
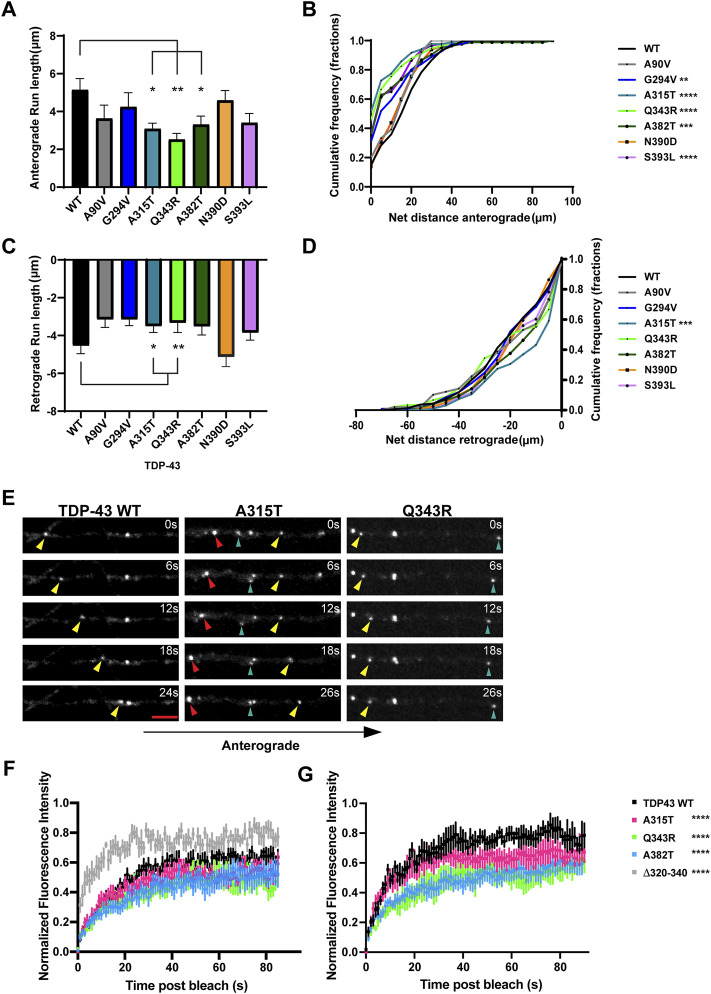
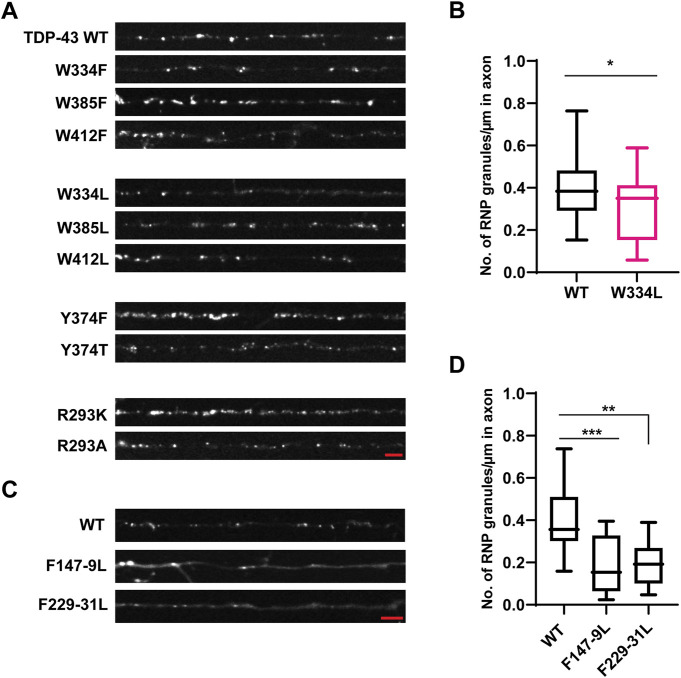
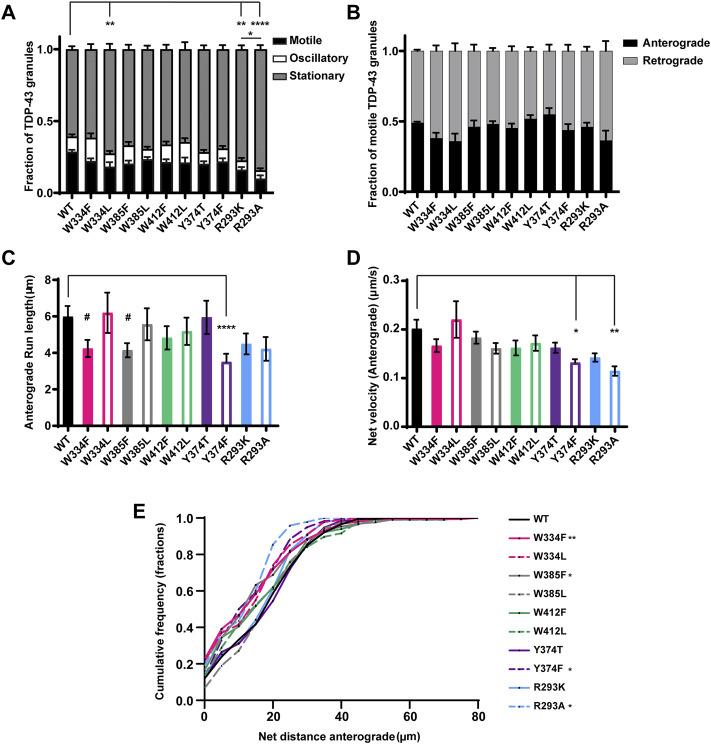
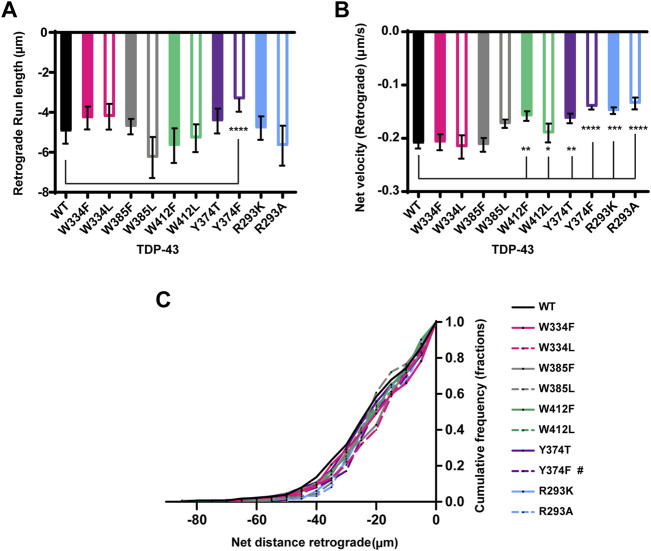
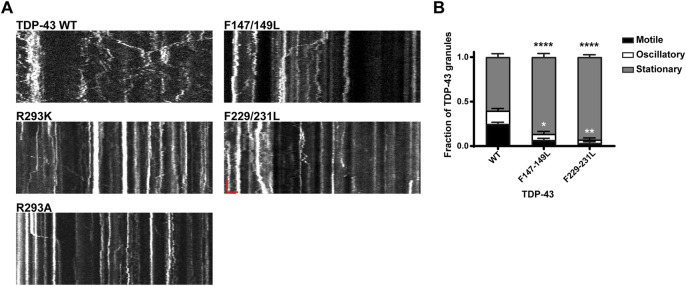
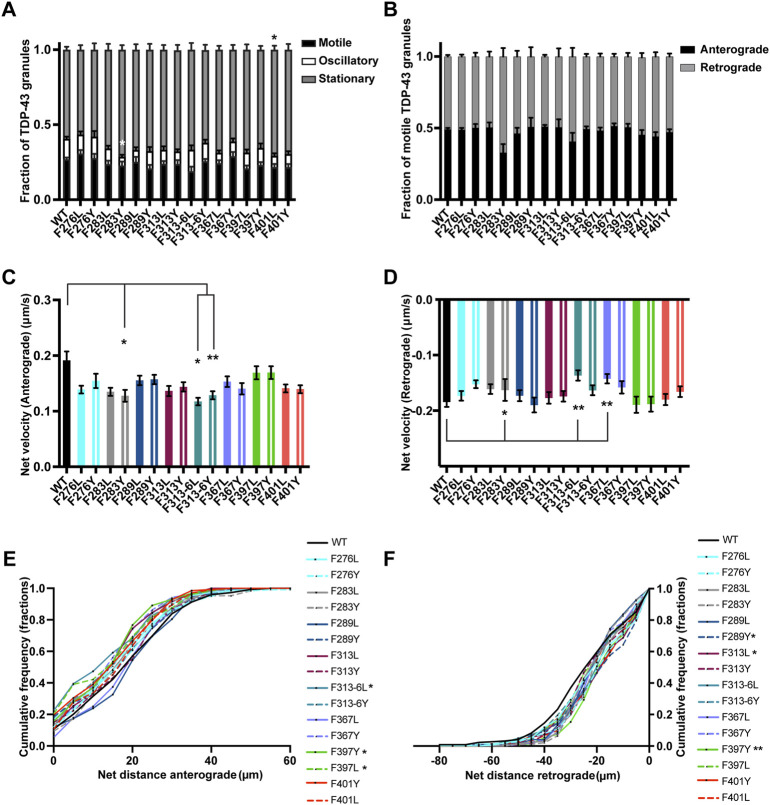
Mutations in TDP-43, a RNA-binding protein with multiple functions in RNA metabolism, cause amyotrophic lateral sclerosis (ALS), but it is uncertain how defects in RNA biology trigger motor neuron degeneration. TDP-43 is a major constituent of ribonucleoprotein (RNP) granules, phase separated biomolecular condensates that regulate RNA splicing, mRNA transport, and translation. ALS-associated TDP-43 mutations, most of which are found in the low complexity domain, promote aberrant liquid to solid phase transitions and impair the dynamic liquid-like properties and motility of RNP transport granules in neurons. Here, we perform a comparative analysis of ALS-linked mutations and TDP-43 variants in order to identify critical structural elements, aromatic and charged residues that are key determinants of TDP-43 RNP transport and condensate formation in neurons. We find that A315T and Q343R disease-linked mutations and substitutions of aromatic residues within the α-helical domain and LARKS, show the most severe defects in TDP-43 RNP granule transport and impair both anterograde and retrograde motility. F313L and F313-6L/Y substitutions of one or both phenylalanine residues in LARKS suggest the aromatic rings are important for TDP-43 RNP transport. Similarly, W334F/L substitutions of the tryptophan residue in the α-helical domain, impair TDP-43 RNP motility (W334L) or anterograde transport (W334F). We also show that R293A and R293K mutations, which disrupt the only RGG in the LCD, profoundly reduce long-range, directed transport and net velocity of TDP-43 RNP granules. In the disordered regions flanking the α-helical domain, we find that F283Y, F397Y or Y374F substitutions of conserved GF/G and SYS motifs, also impair anterograde and/or retrograde motility, possibly by altering hydrophobicity. Similarly, ALS-linked mutations in disordered regions distant from the α-helical domain also show anterograde transport deficits, consistent with previous findings, but these mutations are less severe than A315T and Q343R. Overall our findings demonstrate that the conserved α-helical domain, phenylalanine residues within LARKS and RGG motif are key determinants of TDP-43 RNP transport, suggesting they may mediate efficient recruitment of motors and adaptor proteins. These results offer a possible mechanism underlying ALS-linked TDP-43 defects in axonal transport and homeostasis.

Keywords: TDP-43; amyotrophic lateral sclerosis; axonal transport; biomolecular condensates; neuron; ribonucleoprotein granules.


Conflict of interest statement

The authors declare that the research was conducted in the absence of any commercial or financial relationships that could be construed as a potential conflict of interest.

Figures

FIGURE 1
FIGURE 1
Neuronal RNP granules composed of ALS-linked TDP-43 mutants or TDP-43 Δ320-330 exhibit reduced motility. (A) Axons of primary cortical neurons (DIV7-10) expressing GFP tagged WT or mutant TDP-43 were imaged using live-cell spinning disk confocal microscopy. Representative kymographs of GFP tagged TDP-43 WT or mutant RNP granules are shown. In the kymographs, the retrograde direction (towards the Soma) is to the left and the anterograde direction is to the right. The scale bar (horizontal red line) corresponds to 3 μm (x axis) and time scale (vertical red line) corresponds to 50 s (y axis). (B) The number of TDP-43 RNP granules per μm length of axon for TDP-43 WT and different mutants is shown. TDP-43 Δ320-330 and Δ320-340 lack part or all of the α-helical domain, respectively, and serve as controls expected to substantially reduce phase separation. For each condition, n = 10–14 neurons were analyzed from 3 independent experiments (N = 3). (C) Fraction of TDP-43 WT or mutant RNP granules that are stationary, oscillatory, or motile in the axon; motile puncta ≥10 μm net displacement in 5 min. (D) The fraction of motile TDP-43 RNP granules for WT and mutants (shown as black bars in Figure 1C), is further categorized by retrograde or anterograde motility. For each condition, n = 12–14 neurons were analyzed from 3 independent experiments (N = 3). Error bars represent standard error mean. One way ANOVA (Kruskal–Wallis test with Dunn’s correction for multiple comparisons) was used to determine statistically significant differences among samples; #p < 0.1, *p < 0.05, **p < 0.01, and ***p < 0.0005.
FIGURE 2
FIGURE 2
Disrupting the α-helical domain impairs anterograde motility. (A) Time-lapse images of a representative motile TDP-43 WT RNP granule (left, yellow arrowhead) travelling in the anterograde direction and TDP-43 Δ320-330 RNP granule moving retrograde (right, red arrowhead); scale bar: 3 μm. (B) TDP-43 WT RNP granules exhibit significantly longer anterograde run lengths (μm) than RNP granules containing TDP-43 Δ320-330. (C) The net distance (μm) anterograde or (D) retrograde travelled by motile WT and Δ320-330 TDP-43 RNP granules. The values are from the 3 independent experiments (WT n = 134 and Δ320-330 n = 36); plotted data represent mean ± SEM. Mann-Whitney test was used to determine statistical significance, *p < 0.05.
FIGURE 3
FIGURE 3
ALS-linked TDP-43 mutants A315T and Q343R exhibit defects in anterograde and retrograde transport. (A) Anterograde run lengths (μm) of WT or ALS-linked mutant TDP-43 RNP granules were determined using custom semi-automated analysis in MATLAB. Run lengths (mean ± SEM) are plotted (WT n = 63, G294V n = 54, A315T n = 85, Q343R n = 45, A382T n = 75, N390D n = 59, S393L, n = 64, and A90V n = 19, from 12 to 16 neurons for each condition, N = 3). (B) Cumulative frequency distribution of WT and ALS-linked TDP-43 RNP anterograde net distances from 3 independent experiments. (C) Retrograde run lengths (μm) of WT or ALS-linked mutant TDP-43 RNP granules were determined using custom semi-automated analysis in MATLAB; mean ± SEM is plotted (WT n = 100, G294V n = 77, A315T n = 125 and Q343R n = 65, A382T n = 85, N390D n = 45, S393L, n = 73, and A90V n = 26, from 12 to 16 neurons for each condition, N = 3). (D) Cumulative frequency distribution of WT and ALS-linked TDP-43 RNP retrograde net distances from 3 independent experiments. One way ANOVA (Kruskal–Wallis test with Dunn’s correction for multiple comparisons) was used to determine statistically significant difference among different samples, *p < 0.05, **p < 0.01, ***p < 0.0005 and ****p < 0.0001. (E) Time-lapse images of representative motile TDP-43 WT RNP granule (left panel, yellow arrowhead) travelling in the anterograde direction. Time-lapse images of representative ALS-linked TDP-43 mutants, A315T (middle panel) and Q343R (right panel), showing the most severe transport defects. A315T and Q343R RNP granules display reduced anterograde (yellow arrowhead) and/or retrograde (red arrowhead) runs. Oscillatory RNP granules are shown with cyan arrowheads; scale bar: 3 μm. (F) ALS-mutant RNP granules (A315T, n = 12; Q343R n = 8; A382T, n = 10 from N = 3 independent experiments) in the axon display reduced fluorescence recovery after whole bleach compared to TDP-43 WT RNP granules (n = 10); 2-way ANOVA with Tukey’s post-test for multiple comparisons, ****p < 0.0001. TDP-43 Δ320-330 RNP granules (n = 8) show more robust and rapid whole bleach recovery than WT (2-way ANOVA with Tukey’s post-test for multiple comparisons, ****p < 0.0001). (G) Fluorescence recovery after half-bleach of mid axonal TDP-43 WT granules (n = 9) or ALS-linked mutants [A315T (n = 9); Q343R (n = 5); A382T (n = 10)] from N = 3 independent experiments. TDP-43 WT RNP granules in the mid axon display more robust, rapid recovery after half-bleach, suggesting rapid internal molecular mobility reorganization within granules, compared to RNP granules containing A315T, Q343R, and A382T (2-way ANOVA with Tukey’s post-test for multiple comparisons, ****p < 0.0001). Normalized intensity values represent mean ± SEM.
FIGURE 4
FIGURE 4
Aromatic mutant W334L affects RNP granule assembly. (A) TDP-43 RNP granules are observed along the axons of DIV 7–10 primary cortical neurons expressing the GFP tagged WT TDP-43, aromatic or RGG TDP-43 mutants. Representative images of WT or aromatic/RGG mutant RNP granules are shown. Scale bar (shown in red) corresponds to 3 μm. (B) Number of RNP granules per μm length of axon for WT TDP-43 and W334L TDP-43 mutants is plotted (see Materials and Methods) from n = 13–15 neurons per condition, from 3 independent experiments (N = 3). Error bars represent standard error mean. Unpaired t-test was used to determine statistically significant difference between WT and W334L TDP-43 RNP granules, *p < 0.05. (C) Representative images of GFP tagged WT TDP-43 and RRM mutant RNP granules are shown. Scale bar (shown in red) corresponds to 3 μm. (D) Number of RNP granules per μm length of axon for WT TDP-43 and TDP-43 RRM mutants is shown from n = 11–12 neurons per condition, from 3 independent experiments (N = 3). One way ANOVA with Dunn’s correction for multiple comparisons was used to test for statistically significant differences among samples; **p < 0.01, ***p < 0.001.
FIGURE 5
FIGURE 5
TDP-43 mutations disrupting RGG motif of LCD and W residue of α-helical domain display defects in anterograde transport. (A) WT TDP-43 or TDP-43 LCD W/Y/R mutant kymographs from 3 independent experiments are analyzed to determine the motility of different RNP granules. Fraction of motile, oscillatory and stationary RNP granules are plotted. (B) The fraction of motile RNP granules for WT TDP-43 and each of the TDP-43 LCD W/Y/R mutant (shown as black bars in Figure 5A), are further categorized as granules travelling in retrograde or anterograde direction and the resulting fraction is plotted. (C) The run lengths (μm) of motile WT TDP-43 or TDP-43 LCD W/Y/R mutant RNP granules moving in anterograde direction are determined using custom semi-automated analysis in MATLAB software and the resulting run lengths are plotted (N = 3, WT n = 75, W334F n = 72, W385F n = 87 and Y374F n = 80 from 13 to 15 neurons from each condition). (D) The anterograde net velocity (μm/s) for each of the motile WT TDP-43 or TDP-43 LCD W/Y/R mutant RNP granule was determined using custom semi-automated analysis in MATLAB and the average net velocity is plotted (N = 3, WT n = 88, Y374F n = 105 and R293A n = 40). Error bars represent standard error mean. (E) Cumulative frequency distribution of TDP-43 WT and LCD W/Y/R mutant RNP anterograde net distances, N = 3 independent experiments. One way ANOVA (Kruskal–Wallis test with Dunn’s correction for multiple comparisons) is used to determine the statistically significant difference among different samples. #p < 0.1, *p < 0.05, **p < 0.01, ***p < 0.0005 and ****p < 0.0001.
FIGURE 6
FIGURE 6
TDP-43 mutations disrupting Y374 in the LCD may affect retrograde motility. (A) The run lengths (μm) of motile WT TDP-43 or TDP-43 LCD W/Y/R mutant RNP granules moving in retrograde direction are determined using custom semi-automated analysis in MATLAB and the resulting run lengths are plotted (N = 3, WT n = 38 and Y374F n = 89). (B) The retrograde net velocity (μm/s) for each of the motile WT TDP-43 or TDP-43 LCD W/Y/R mutant RNP granule was determined using MATLAB software and the average net velocity is plotted (N = 3, WT n = 120, W412F n = 86, W412L n = 82, Y374T n = 91, Y374F n = 114, R293K n = 82, and R293A n = 41). Error bars represent standard error mean. (C) Retrograde net distance cumulative frequency distribution of TDP-43 WT and LCD W/Y/R mutant RNP granules, N = 3 independent experiments. One way ANOVA (Kruskal–Wallis test with Dunn’s correction for multiple comparisons) was used to determine the statistically significant difference among different samples. #p < 0.1, *p < 0.05, **p < 0.01, ***p < 0.0005, and ****p < 0.0001.
FIGURE 7
FIGURE 7
Neuronal RNP granules composed of TDP-43 RRM1/RRM2 mutants exhibit reduced motility. (A) Representative kymographs of GFP tagged TDP-43 WT, RGG mutant, or RRM1/2 mutant RNP granules are shown. In the kymographs, the retrograde direction (towards the Soma) is to the left and the anterograde direction is to the right. The scale bar (horizontal red line) corresponds to 3 μm (x axis) and time scale (vertical red line) corresponds to 50 s (y axis). (B) Fraction of TDP-43 WT or RRM1/2 mutant RNP granules that are stationary, oscillatory, or motile in the axon; motile puncta ≥10 μm net displacement in 5 min. TDP-43 RRM1 (F147-149L) and RRM2 (F229-231L) mutants exhibit significantly reduced motile (black asterisk) and oscillatory fraction (white asterisk), compared to WT. For each condition, n = 11–12 neurons were analyzed from 3 independent experiments (N = 3). Error bars represent standard error mean. One way ANOVA with Dunnett’s correction for multiple comparisons was used to determine statistically significant differences among samples; *p < 0.05, **p < 0.01, and ****p < 0.0001.
FIGURE 8
FIGURE 8
TDP-43 mutation disrupting F in LARKS affects RNP transport. (A) WT TDP-43 or TDP-43 LCD F mutant kymographs from 3 independent experiments are analyzed to determine the motility of different RNP granules. Fraction of motile, oscillatory and stationary RNP granules are plotted. (B) The fraction of motile RNP granules for WT TDP-43 and each of the TDP-43 LCD F mutant (shown as black bars in Figure 8A), are further categorized as granules travelling in retrograde or anterograde direction and the resulting fraction is plotted. (C) The anterograde net velocity (μm/s) for each of the motile WT TDP-43 or TDP-43 LCD F mutant RNP granule was determined using custom semi-automated analysis in MATLAB and the average net velocity is plotted (N = 3, WT n = 104, F276L n = 105, F276Y n = 98, F283L n = 88, F283Y n = 49, F289L n = 72, F289Y n = 71, F313L n = 85, F313Y n = 101, F313-6L n = 43, F313-6Y n = 124, F367L n = 86, F367Y n = 95, F397L n = 75, F397Y n = 84, F401L n = 71, F401Y n = 91, from 9 to 15 neurons per condition). (D) The retrograde net velocity (μm/s) for each of the motile WT TDP-43 or TDP-43 LCD F mutant RNP granule was determined using custom semi-automated analysis in MATLAB and the average net velocity is plotted (N = 3, WT n = 128, F276L n = 109, F276Y n = 125, F283L n = 95, F283Y n = 75, F289L n = 79, F289Y n = 70, F313L n = 82, F313Y n = 100, F313-6L n = 59, F313-6Y n = 124, F367L n = 92, F367Y n = 90, F397L n = 73, F397Y n = 100, F401L n = 88, F401Y n = 99). Error bars represent standard error mean. (E) Anterograde or (F) retrograde net distance cumulative frequency distribution for TDP-43 WT or LCD F mutant RNP granules, from 3 independent experiments. One way ANOVA (Kruskal–Wallis test with Dunn’s correction for multiple comparisons) was used to determine statistically significant difference among different samples. *p < 0.05, **p < 0.01.

Similar articles

Cited by

References

    1. Afroz T., Hock E.-M., Ernst P., Foglieni C., Jambeau M., Gilhespy L. A. B., et al. (2017). Functional and Dynamic Polymerization of the ALS-Linked Protein TDP-43 Antagonizes its Pathologic Aggregation. Nat. Commun. 8 (1), 45. 10.1038/s41467-017-00062-0 - DOI - PMC - PubMed
    1. Alami N. H., Smith R. B., Carrasco M. A., Williams L. A., Winborn C. S., Han S. S. W., et al. (2014). Axonal Transport of TDP-43 mRNA Granules Is Impaired by ALS-Causing Mutations. Neuron 81 (3), 536–543. 10.1016/j.neuron.2013.12.018 - DOI - PMC - PubMed
    1. Altman T., Ionescu A., Ibraheem A., Priesmann D., Gradus-Pery T., Farberov L., et al. (2021). Axonal TDP-43 Condensates Drive Neuromuscular Junction Disruption through Inhibition of Local Synthesis of Nuclear Encoded Mitochondrial Proteins. Nat. Commun. 12 (1), 6914. 10.1038/s41467-021-27221-8 - DOI - PMC - PubMed
    1. Amrute-Nayak M., Bullock S. L. (2012). Single-molecule Assays Reveal that RNA Localization Signals Regulate Dynein-Dynactin Copy Number on Individual Transcript Cargoes. Nat. Cell Biol. 14 (4), 416–423. 10.1038/ncb2446 - DOI - PMC - PubMed
    1. Ashkenazy H., Erez E., Martz E., Pupko T., Ben-Tal N. (2010). ConSurf 2010: Calculating Evolutionary Conservation in Sequence and Structure of Proteins and Nucleic Acids. Nucleic Acids Res. 38, W529–W533. 10.1093/nar/gkq399 - DOI - PMC - PubMed