

Prognosis and Therapeutic Efficacy Prediction of Adrenocortical Carcinoma Based on a Necroptosis-Associated Gene Signature
- PMID: 35647181
- PMCID: PMC9135517
- DOI: 10.1155/2022/8740408
Prognosis and Therapeutic Efficacy Prediction of Adrenocortical Carcinoma Based on a Necroptosis-Associated Gene Signature
Retraction in
-
Retracted: Prognosis and Therapeutic Efficacy Prediction of Adrenocortical Carcinoma Based on a Necroptosis-Associated Gene Signature.Biomed Res Int. 2024 Mar 20;2024:9850107. doi: 10.1155/2024/9850107. eCollection 2024. Biomed Res Int. 2024. PMID: 38550181 Free PMC article.
Abstract
Background: Adrenocortical carcinoma (ACC) is a rare and poor prognosis malignancy. Necroptosis is a special type of cell apoptosis, which is regulated in caspase-independent pathways and mainly induced through the activation of receptor-interacting protein kinase 1, receptor-interacting protein kinase 3, and mixed lineage kinase domain-like pseudokinase. A precise predictive tool based on necroptosis is needed to improve the level of diagnosis and treatment.
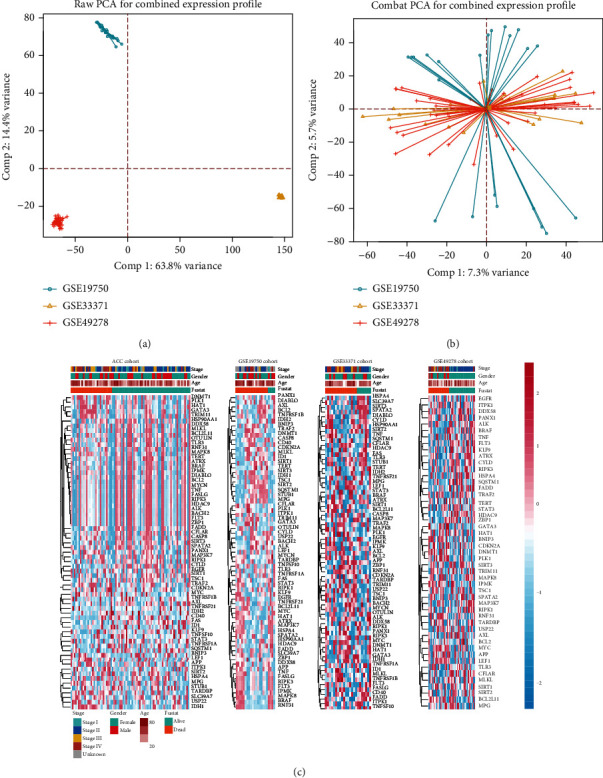
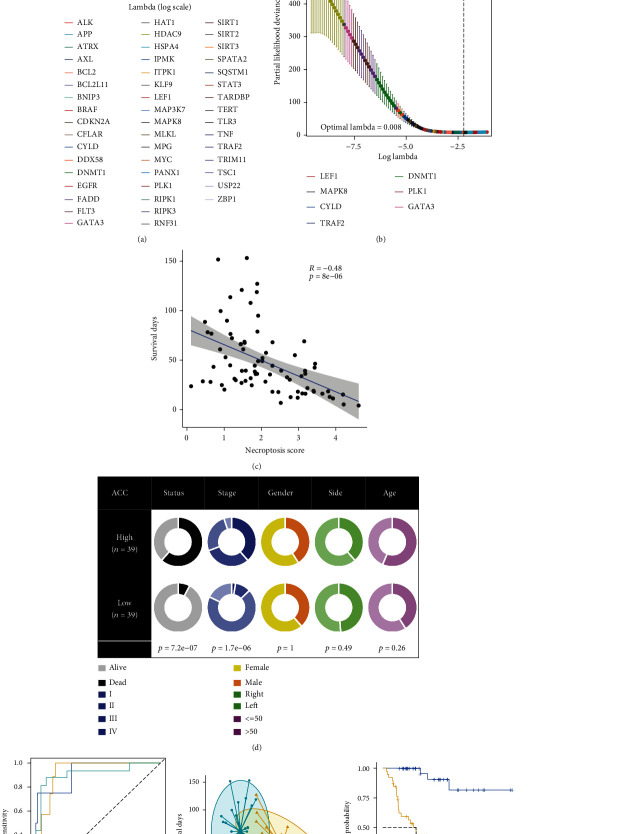
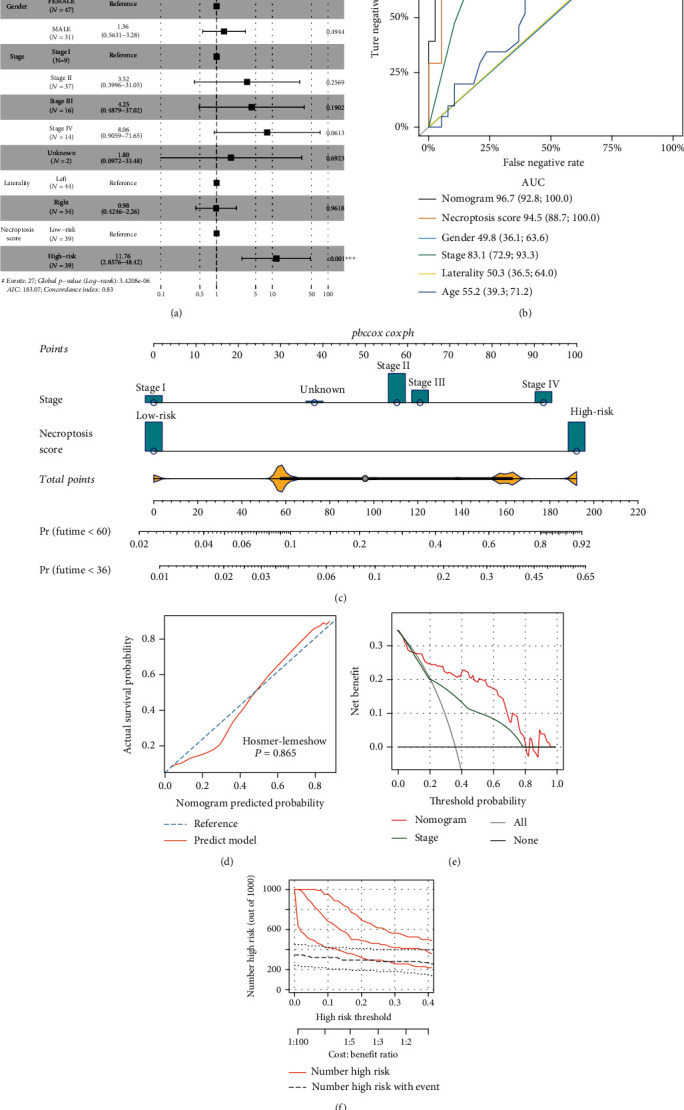
Method: Four ACC cohorts were enrolled in this study. The Cancer Genome Atlas ACC (TCGA-ACC) cohort was used as the training cohort; three datasets (GSE19750, GSE33371, and GSE49278) from Gene Expression Omnibus (GEO) platform were combined as the GEO testing cohort after removing of batch effect. Forty-nine necroptosis-associated genes were obtained from a prior study and further filtered by least absolute shrinkage and selection operator Cox regression analysis; corresponding coefficients were used to calculate the necroptosis-associated gene score (NAGs). Patients in the TCGA-ACC cohort were equally divided into two groups with the mean value of NAGs. We investigated the associations between NAGs groups and clinicopathological feature distribution and overall survival (OS) in ACC, the molecular mechanisms, and the value of NAGs in therapy prediction. A nomogram risk model was established to quantify risk stratification for ACC patients. Finally, the results were confirmed in the GEO-combined cohort.
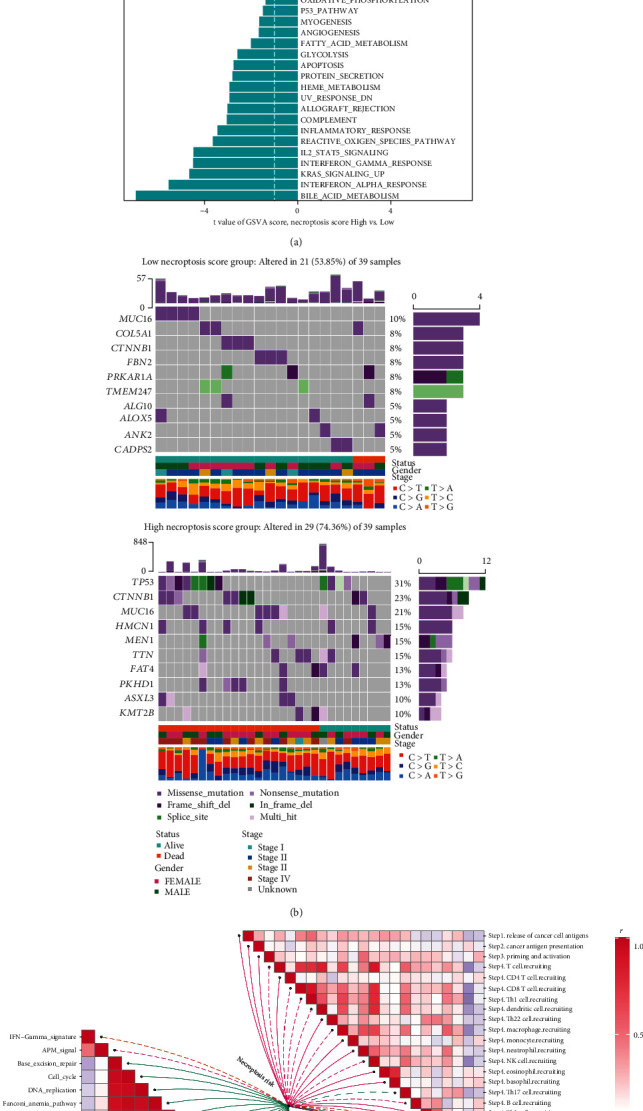
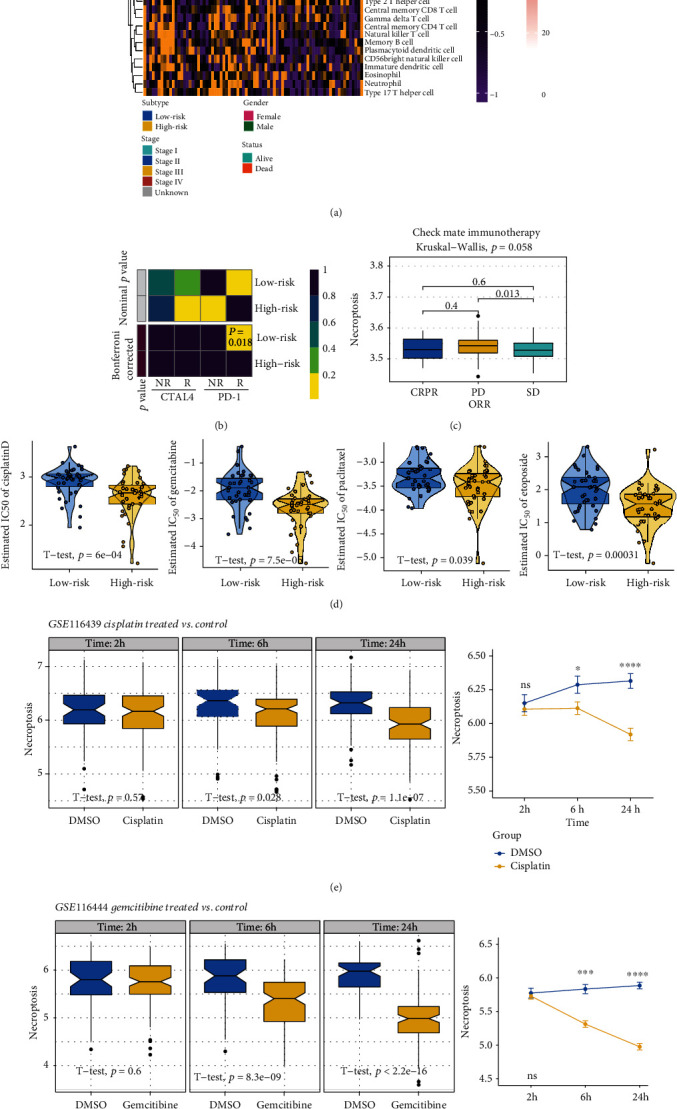
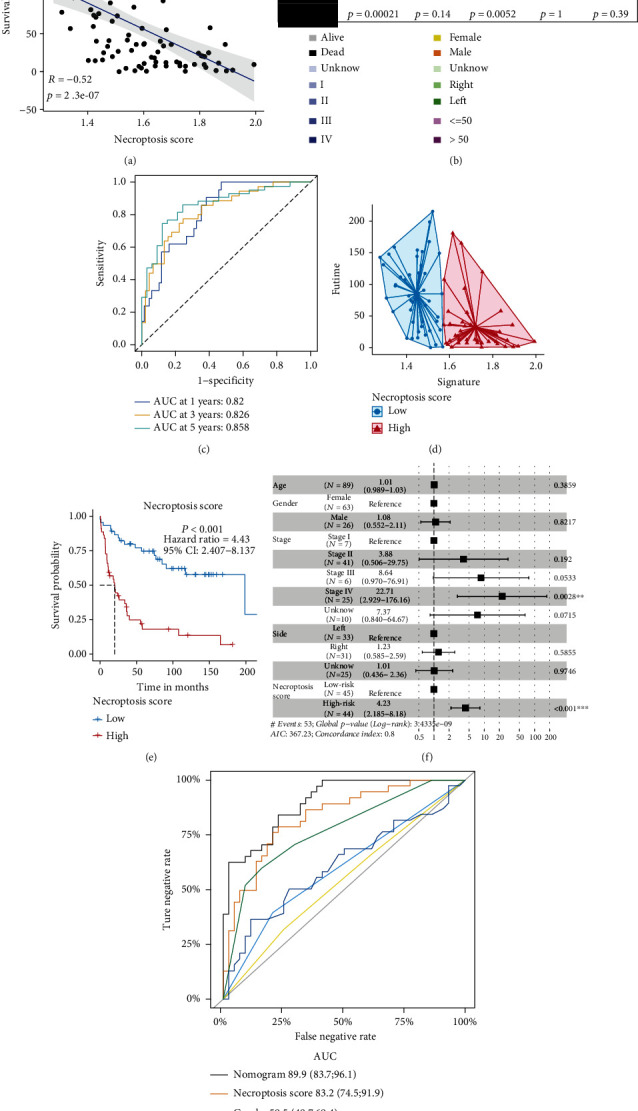
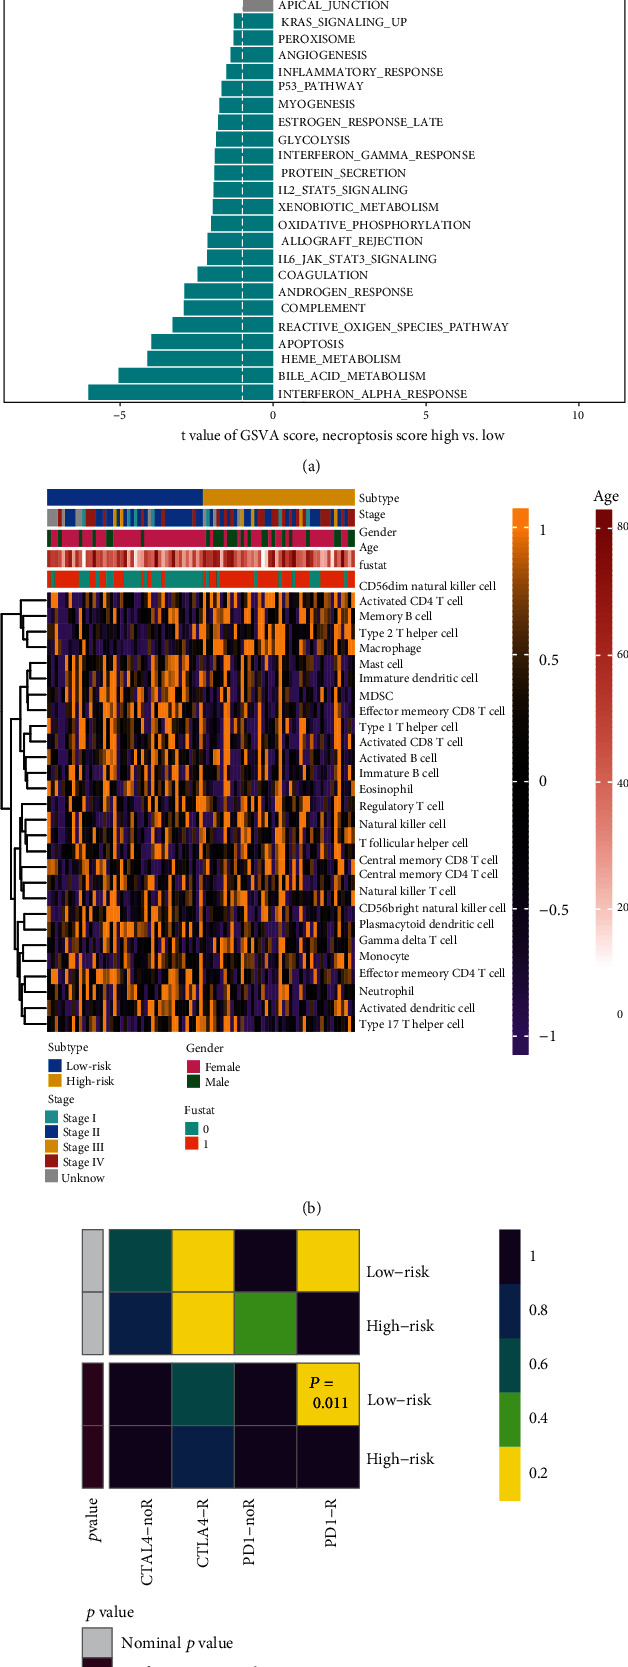
Result: Patients in the TCGA-ACC cohort were divided into high and low NAGs groups. The high NAGs group had more fatal cases and advanced stage patients than the low NAGs group (P < 0.001, hazard ratio (HR) = 13.97, 95% confidence interval (95% CI): 4.168-46.844; survival rate: low NAGs, 7.69% vs. high NAGs, 61.53%). NAGs were validated to be negatively correlated with OS (R = -0.48, P < 0.001) and act as an independent factor in ACC with high discriminative efficacy (P < 0.001, HR = 11.76, 95% CI: 2.86-48.42). In addition, a high predictive efficacy nomogram risk model was established combining NAGs with tumor stage. Higher mutation rates were observed in the high NAGs group, and the mutation of TP53 may lead to a high T cell infiltration level among the NAGs groups. Patients belonged to the high NAGs are more sensitive to the chemotherapy of cisplatin, gemcitabine, paclitaxel, and etoposide (all P < 0.05). Ultimately, the same statistical algorithms were conducted in the GEO-combined cohort, and the crucial role of NAGs prediction value was further validated.
Conclusion: We constructed a necroptosis-associated gene signature, revealed the prognostic value between ACC and it, systematically explored the molecular alterations among patients with different NAGs, and manifested the value of drug sensitivity prediction in ACC.
Copyright © 2022 Dan Ji et al.
Conflict of interest statement
All authors have completed the ICMJE uniform disclosure form. The authors have no conflicts of interest to declare.
Figures
Similar articles
-
Identification of prognostic metabolic genes in adrenocortical carcinoma and establishment of a prognostic nomogram: A bioinformatic study.Medicine (Baltimore). 2021 Dec 17;100(50):e27864. doi: 10.1097/MD.0000000000027864. Medicine (Baltimore). 2021. PMID: 34918636 Free PMC article.
-
Bioinformatic analyses and experimental validation of the role of m6A RNA methylation regulators in progression and prognosis of adrenocortical carcinoma.Aging (Albany NY). 2021 Apr 21;13(8):11919-11941. doi: 10.18632/aging.202896. Epub 2021 Apr 21. Aging (Albany NY). 2021. PMID: 33952721 Free PMC article.
-
Analysis of m6A-Related Signatures in the Tumor Immune Microenvironment and Identification of Clinical Prognostic Regulators in Adrenocortical Carcinoma.Front Immunol. 2021 Mar 3;12:637933. doi: 10.3389/fimmu.2021.637933. eCollection 2021. Front Immunol. 2021. PMID: 33746977 Free PMC article.
-
Pediatric adrenocortical carcinoma.Front Endocrinol (Lausanne). 2022 Oct 31;13:961650. doi: 10.3389/fendo.2022.961650. eCollection 2022. Front Endocrinol (Lausanne). 2022. PMID: 36387865 Free PMC article. Review.
-
Genomic and expression profiling of adrenocortical carcinoma: application to diagnosis, prognosis and treatment.Future Oncol. 2009 Jun;5(5):641-55. doi: 10.2217/fon.09.45. Future Oncol. 2009. PMID: 19519204 Review.
Cited by
-
Pitfalls in the Diagnosis and Management of Hypercortisolism (Cushing Syndrome) in Humans; A Review of the Laboratory Medicine Perspective.Diagnostics (Basel). 2023 Apr 14;13(8):1415. doi: 10.3390/diagnostics13081415. Diagnostics (Basel). 2023. PMID: 37189516 Free PMC article. Review.
-
Retracted: Prognosis and Therapeutic Efficacy Prediction of Adrenocortical Carcinoma Based on a Necroptosis-Associated Gene Signature.Biomed Res Int. 2024 Mar 20;2024:9850107. doi: 10.1155/2024/9850107. eCollection 2024. Biomed Res Int. 2024. PMID: 38550181 Free PMC article.
References
Publication types
MeSH terms
Substances
LinkOut - more resources
Full Text Sources
Research Materials
Miscellaneous
