

Key Genes Identified in Nonsyndromic Microtia by the Analysis of Transcriptomics and Proteomics
- PMID: 35647449
- PMCID: PMC9134388
- DOI: 10.1021/acsomega.1c07059
Key Genes Identified in Nonsyndromic Microtia by the Analysis of Transcriptomics and Proteomics
Abstract
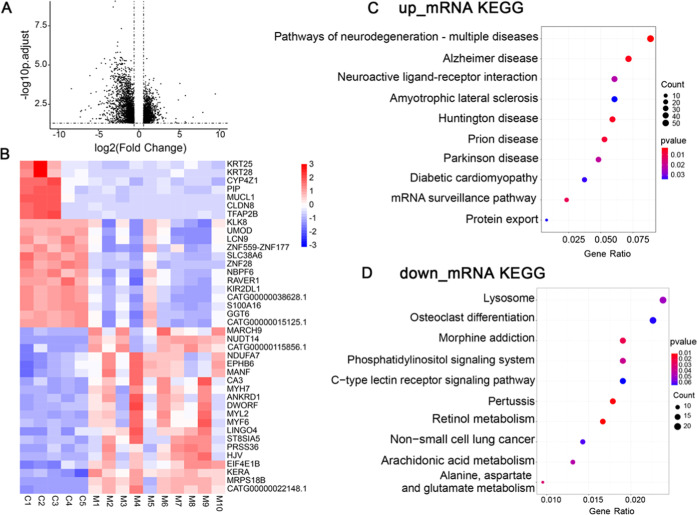
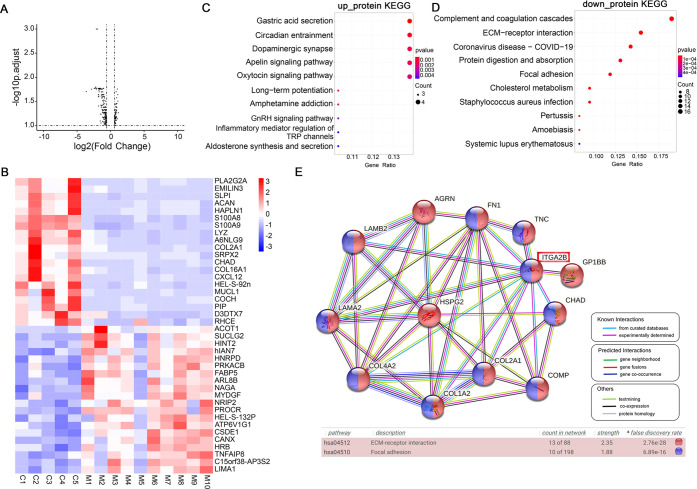
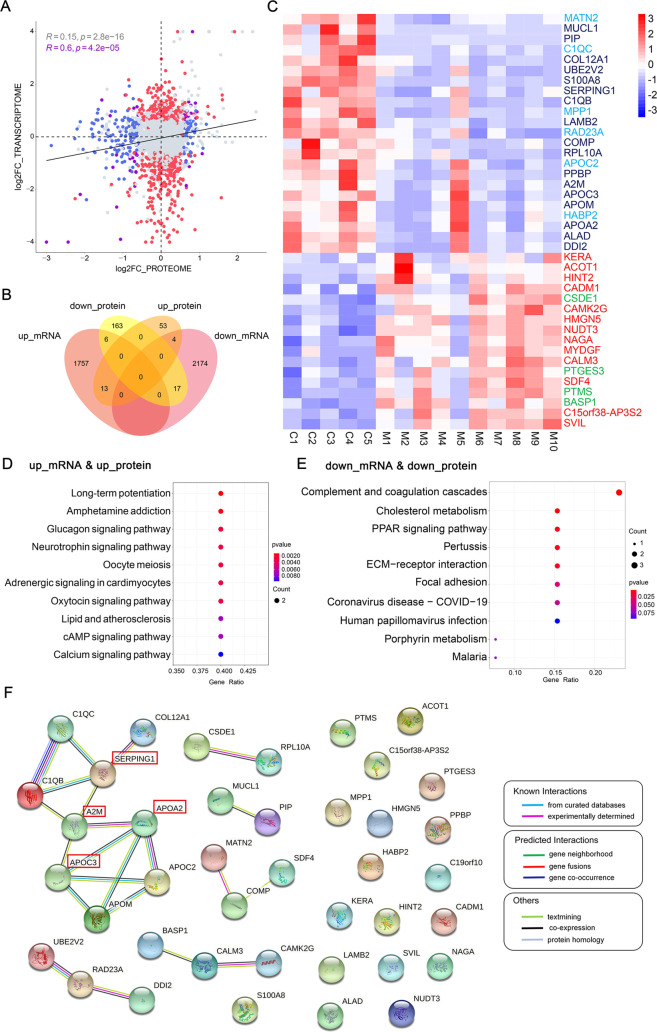
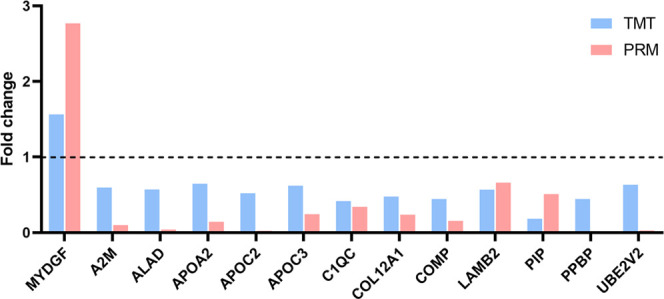
As one of the common birth defects worldwide, nonsyndromic microtia is a complex disease that results from interactions between environmental and genetic factors. However, the underlying causes of nonsyndromic microtia are currently not well understood. The present study determined transcriptomic and proteomic profiles of auricular cartilage tissues in 10 patients with third-degree nonsyndromic microtia and five control subjects by RNA microarray and tandem mass tag-based quantitative proteomics technology. Relative mRNA and protein abundances were compared and evaluated for their function and putative involvement in nonsyndromic microtia. A total of 3971 differentially expressed genes and 256 differentially expressed proteins were identified. Bioinformatics analysis demonstrated that some of these genes and proteins showed potential associations with nonsyndromic microtia. Thirteen proteins with the same trend at the mRNA level obtained by the integrated analysis were validated by parallel reaction monitoring analysis. Several key genes, namely, LAMB2, COMP, APOA2, APOC2, APOC3, and A2M, were found to be dysregulated, which could contribute to nonsyndromic microtia. The present study is the first report on the transcriptomic and proteomic integrated analysis of nonsyndromic microtia using the same auricular cartilage sample. Additional studies are required to clarify the roles of potential key genes in nonsyndromic microtia.
© 2022 The Authors. Published by American Chemical Society.
Conflict of interest statement
The authors declare no competing financial interest.
Figures
Similar articles
-
Identification of Key Genes and Signaling Pathways in Microtia by the Analysis of Transcriptomics.J Craniofac Surg. 2024 Sep 23. doi: 10.1097/SCS.0000000000010601. Online ahead of print. J Craniofac Surg. 2024. PMID: 39311594
-
Differential Expression of Noncoding RNAs Revealed Enhancer RNA AC016735.2 as a Potential Pathogenic Marker of Congenital Microtia Patients.J Craniofac Surg. 2024 Mar 8;35(3):787-93. doi: 10.1097/SCS.0000000000010046. Online ahead of print. J Craniofac Surg. 2024. PMID: 38456687 Free PMC article.
-
Protein profile of ear auricle cartilage and the important role of ITGB1/PTK2 in microtia.Int J Pediatr Otorhinolaryngol. 2020 Oct;137:110235. doi: 10.1016/j.ijporl.2020.110235. Epub 2020 Jul 12. Int J Pediatr Otorhinolaryngol. 2020. PMID: 32896350
-
The genetics of auricular development and malformation: new findings in model systems driving future directions for microtia research.Eur J Med Genet. 2014 Aug;57(8):394-401. doi: 10.1016/j.ejmg.2014.05.003. Epub 2014 May 29. Eur J Med Genet. 2014. PMID: 24880027 Free PMC article. Review.
-
Auricular reconstruction of congenital microtia (grade III).Laryngoscope. 1996 Dec;106(12 Pt 2 Suppl 82):1-26. doi: 10.1097/00005537-199612001-00001. Laryngoscope. 1996. PMID: 8955687 Review.
Cited by
-
Metabolomic characterization of congenital microtia: a possible analysis for early diagnosis.Ann Transl Med. 2022 Dec;10(24):1330. doi: 10.21037/atm-22-5614. Ann Transl Med. 2022. PMID: 36660691 Free PMC article.
-
Severe Unilateral Microtia with Aural Atresia, Hair White Patch, Stereotypes in a Young Boy with De novo 16p13.11 Deletion: Reasons for a New Genotype-Phenotype Correlation.Glob Med Genet. 2023 Dec 4;10(4):370-375. doi: 10.1055/s-0043-1777362. eCollection 2023 Dec. Glob Med Genet. 2023. PMID: 38053544 Free PMC article.
-
HOXB6 down-regulation induced by retinoic acid pathway repression leads to chondrocyte proliferation inhibition and apoptosis in microtia.Genes Dis. 2024 Jun 25;12(3):101367. doi: 10.1016/j.gendis.2024.101367. eCollection 2025 May. Genes Dis. 2024. PMID: 39897132 Free PMC article. No abstract available.
-
JAG2: A Potential Biomarker for Microtia Identified by Integrated RNA Transcriptome Analysis.Curr Genomics. 2025;26(3):210-224. doi: 10.2174/0113892029311725240911065539. Epub 2024 Sep 25. Curr Genomics. 2025. PMID: 40433419 Free PMC article.
-
Upregulated desmin/integrin β1/MAPK axis promotes elastic cartilage regeneration with increased ECM mechanical strength.Int J Biol Sci. 2023 May 21;19(9):2740-2755. doi: 10.7150/ijbs.83024. eCollection 2023. Int J Biol Sci. 2023. PMID: 37324935 Free PMC article.
References
LinkOut - more resources
Full Text Sources
Research Materials
Miscellaneous
