. 2022 Aug 26;28(48):e202201130.
doi: 10.1002/chem.202201130. Epub 2022 Jul 4.

Electron-Rich EDOT Linkers in Tetracationic bis-Triarylborane Chromophores: Influence on Water Stability, Biomacromolecule Sensing, and Photoinduced Cytotoxicity

Affiliations

Electron-Rich EDOT Linkers in Tetracationic bis-Triarylborane Chromophores: Influence on Water Stability, Biomacromolecule Sensing, and Photoinduced Cytotoxicity

Matthias Ferger et al. Chemistry. .

Abstract

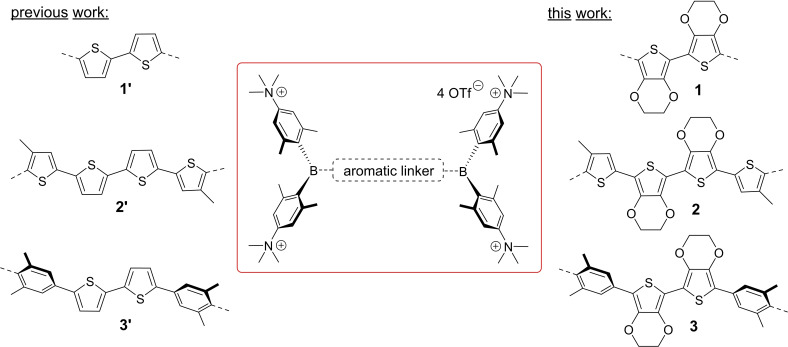
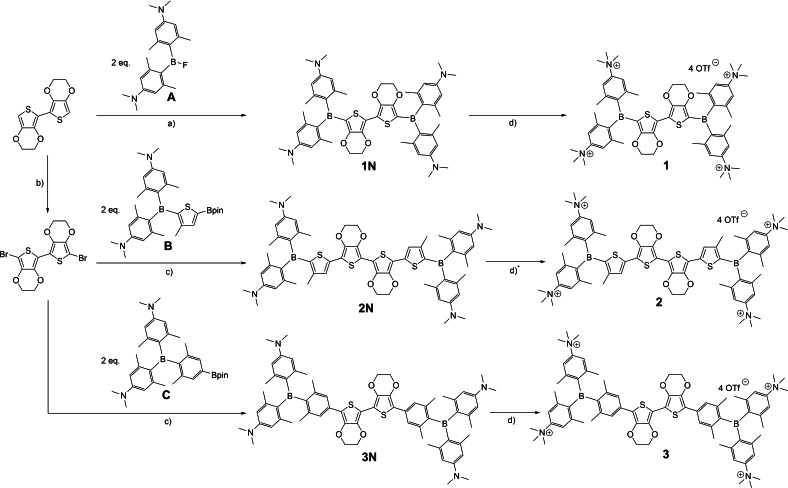
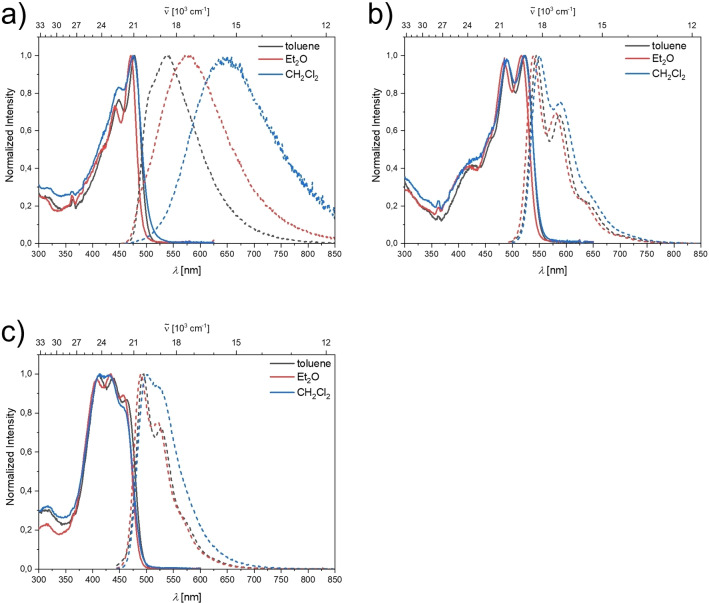
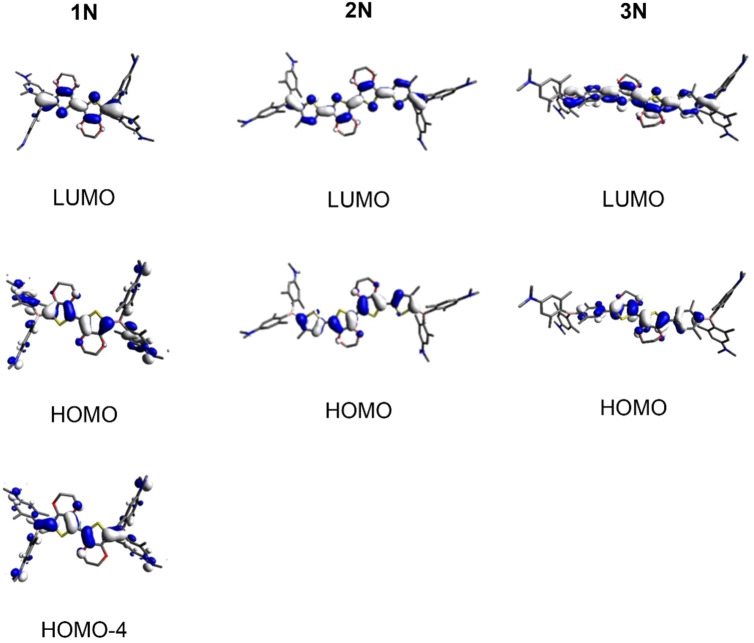
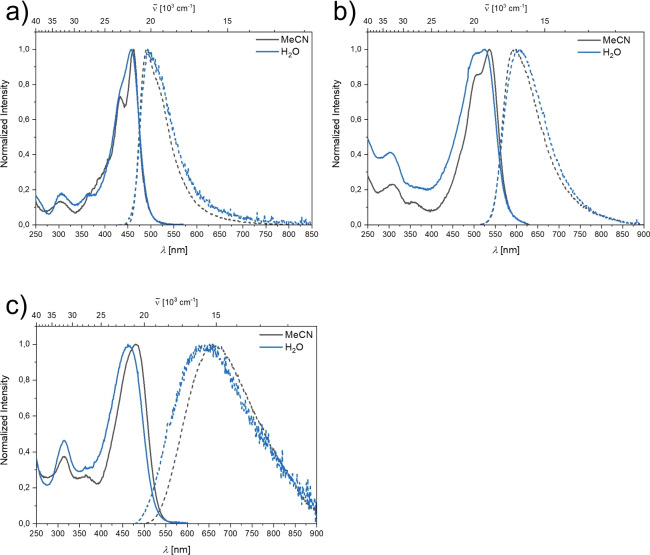
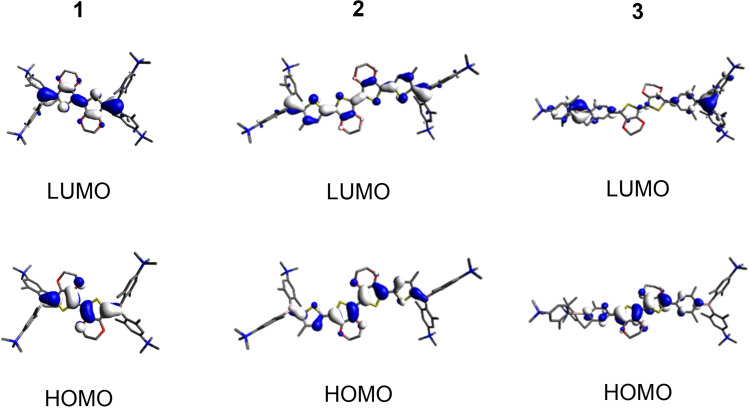
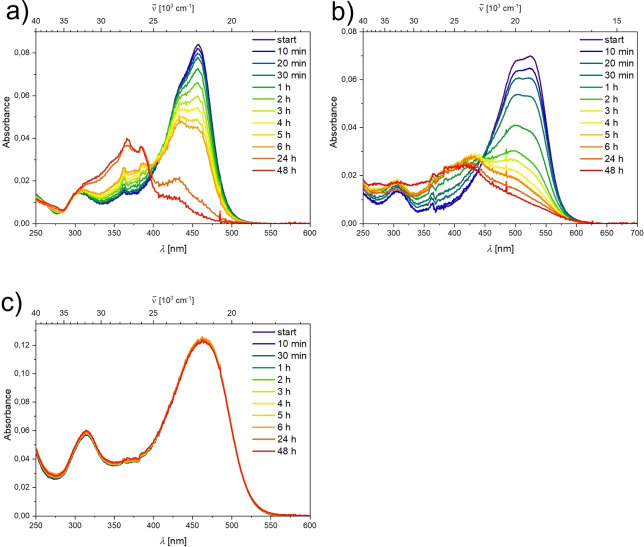
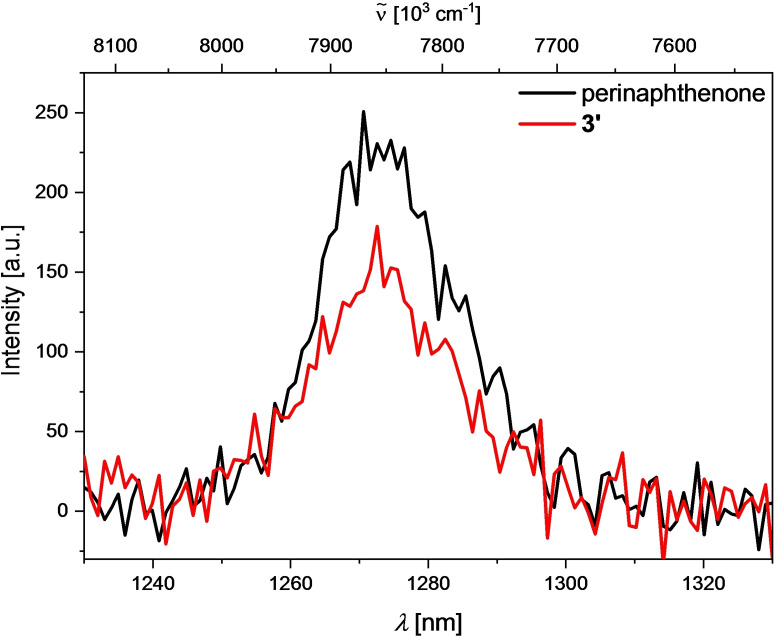
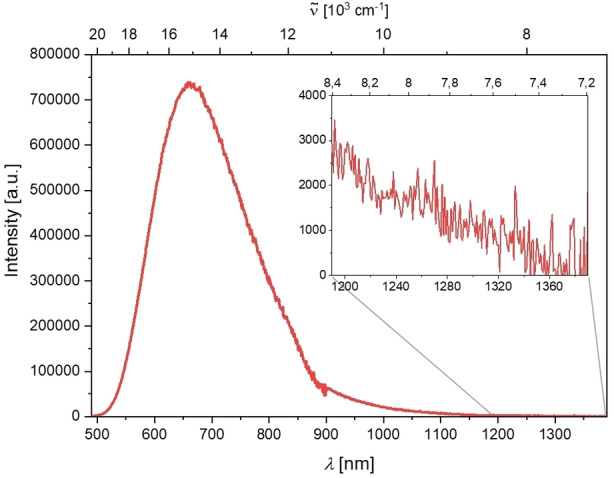
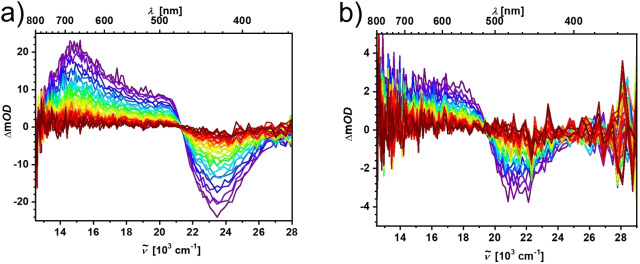
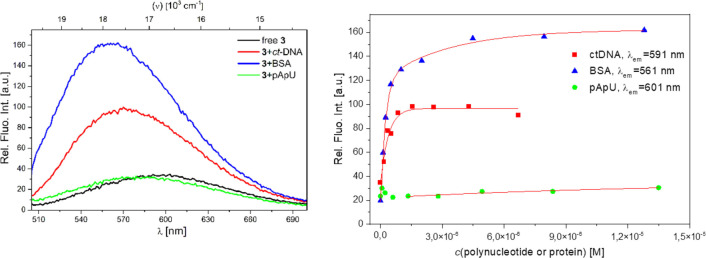
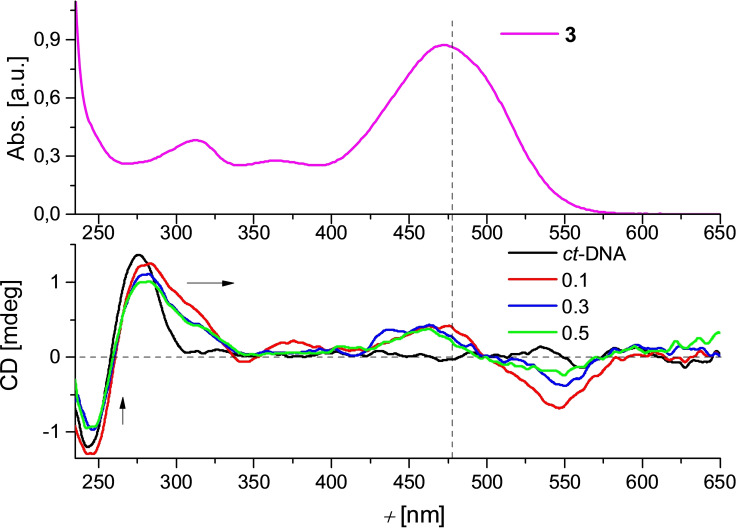
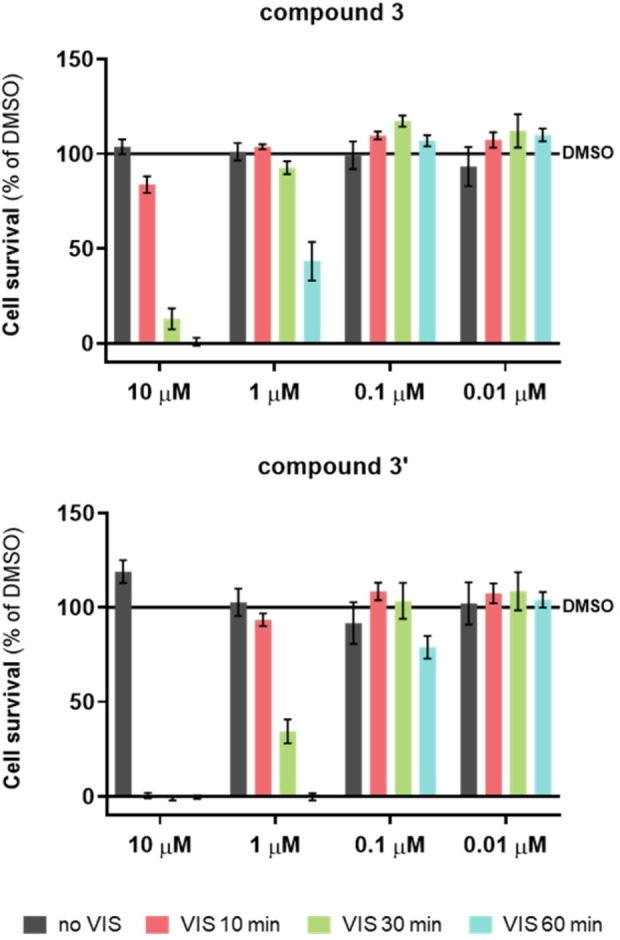
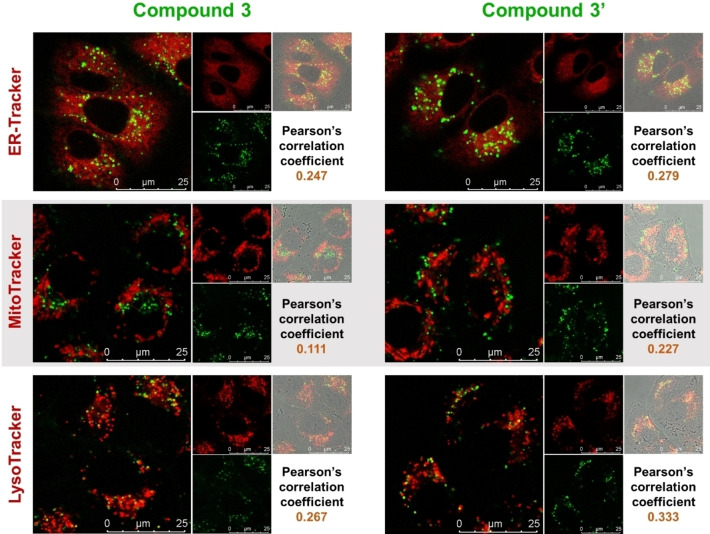
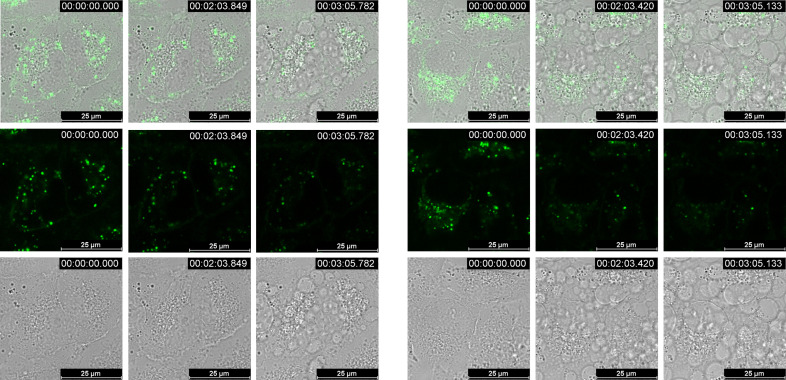
Three novel tetracationic bis-triarylboranes with 3,4-ethylenedioxythiophene (EDOT) linkers, and their neutral precursors, showed significant red-shifted absorption and emission compared to their thiophene-containing analogues, with one of the EDOT-derivatives emitting in the NIR region. Only the EDOT-linked trixylylborane tetracation was stable in aqueous solution, indicating that direct attachment of a thiophene or even 3-methylthiophene to the boron atom is insufficient to provide hydrolytic stability in aqueous solution. Further comparative analysis of the EDOT-linked trixylylborane tetracation and its bis-thiophene analogue revealed efficient photo-induced singlet oxygen production, with the consequent biological implications. Thus, both analogues bind strongly to ds-DNA and BSA, very efficiently enter living human cells, accumulate in several different cytoplasmic organelles with no toxic effect but, under intense visible light irradiation, they exhibit almost instantaneous and very strong cytotoxic effects, presumably attributed to singlet oxygen production. Thus, both compounds are intriguing theranostic agents, whose intracellular and probably intra-tissue location can be monitored by strong fluorescence, allowing switching on of the strong bioactivity by well-focused visible light.

Keywords: DNA/RNA sensors; boranes; fluorescent probes; singlet oxygen; theranostics.


Conflict of interest statement

The authors declare no conflict of interest.

Figures

Figure 1
Figure 1
General structure of our water‐soluble A‐π‐A chromophores with different aromatic linkers including the target molecules 1, 2, and 3 of this study.
Scheme 1
Scheme 1
Synthesis of compounds 1N, 2N, 3N, 1, 2, and 3. a) n‐BuLi, THF, −78 °C to r. t.; b) NBS, CH2Cl2, −15 °C; c) Pd2(dba)3⋅CHCl3, SPhos, CsCO3, toluene/H2O (2/1), 85 °C; d) MeOTf, CH2Cl2, r. t.; d)* excess MeOTf, unidentified impurity in the compound, see Discussion for further information.
Figure 2
Figure 2
Absorption (solid line) and emission (dashed line) spectra of a) 1N, b) 2N, and c) 3N in various solvents.
Figure 3
Figure 3
Orbitals relevant to the S1←S0 transition in toluene for compounds 1N, 2N, and 3N calculated by TD‐DFT at the CAM−B3LYP/6‐31G+(d,p) level of theory.
Figure 4
Figure 4
Absorption (solid line) and emission (dashed line) spectra of a) 1, b) 2, and c) 3 in various solvents.
Figure 5
Figure 5
Orbitals relevant to the S1←S0 transition in MeCN for compounds 1, 2, and 3 calculated by TD‐DFT at the CAM−B3LYP/6‐31G+(d,p) level of theory.
Figure 6
Figure 6
UV/Vis spectra of solutions of a) 1, b) 2 and c) 3 over a period of 48 h in water. Preparation of stock solutions with the same concentrations of 1, 2, and 3 was not possible, as the dilution takes time and a measurement of absorption spectra at t=0 min would, thus, not be possible.
Figure 7
Figure 7
Emission spectrum of singlet oxygen generated from sensitization of a perinaphthenone standard (black) vs. that generated by sensitization by compound 3’ (red) excited at 404 nm in MeCN.
Figure 8
Figure 8
Emission spectrum of compound 3 in MeCN; insert: enlarged section from the spectrum, showing detectable emission until ca. 1360 nm.
Figure 9
Figure 9
Nanosecond transient absorption spectra of a) 3’ and b) 3 in degassed MeCN solutions.
Figure 10
Figure 10
a) Comparison of the last titration points in fluorescence titrations of 3 (c=5.0×10⁻⁸ M) with ct‐DNA (c=6.7×10⁻⁶ M), BSA (c=1.3×10⁻⁵ M) and pApU (c=1.4×10⁻⁵ M) at λ exc=471 nm. b) Changes in fluorescence of 3 (λ exc=471 nm, c=5.00×10⁻⁸ M) upon addition of polynucleotides and BSA. All measurements were made at pH 7.0 in sodium cacodylate buffer, I=0.05 M.
Figure 11
Figure 11
CD titrations of ct‐DNA (c=2×10⁻⁵ M) at various ratios r [dye]/[polynucleotide] with 3 (bottom). UV‐Vis spectum of 3 (c=1.8×10⁻⁶ M) (top). Done at pH 7.0 in sodium cacodylate buffer, I=0.05 M.
Figure 12
Figure 12
Cell survival of A549 cells exposed to compounds 3 (top) and 3’ (bottom), with or without exposure to visible light irradiation. Irradiation occurred in a Luzchem reactor with visible light range 90 min after addition of dye (400–700 nm, 8 lamps, in total 56 W, Dose 50.6 mw m−2), 18 cm lamp to cell‐plate, for 10, 30, or 60 min, and then left in the incubator overnight (37 °C, 5 % CO2). Irradiation was performed for three subsequent days at the same time point each day. Data are presented as mean±SD made in four replicates, relative to the control samples (DMSO). Representative data from three independent experiments yielding similar results are shown.
Figure 13
Figure 13
Intracellular localization of 3 or 3’ (shown in green; λ exc=457 nm, λ em=500–600 nm) at concentrations of 10 μM for 90 min at 37 °C in A549 cells. Colocalization with endoplasmic reticulum (ER‐Tracker), mitochondria (MitoTracker) or lysosomes (LysoTracker), all shown in red, was monitored by confocal microscopy. Merged signals with white field are shown in gray.
Figure 14
Figure 14
Confocal time‐lapse imaging of A549 cells treated with 3 (left) or 3’ (right) and irradiated at λ exc=457 nm by maximum power of the laser (Leica TCS SP8X, 50 mW), monitored at bright field and fluorescence during 3 min (real time movie in the Supporting Information).

References

    1. Entwistle C. D., Marder T. B., Angew. Chem. Int. Ed. 2002, 41, 2927–2931; - PubMed
    2. Angew. Chem. 2002, 114, 3051–3056.
    1. Entwistle C. D., Marder T. B., Chem. Mater. 2004, 16, 4574–4585.
    1. Yamaguchi S., Wakamiya A., Pure Appl. Chem. 2006, 78, 1413–1424.
    1. Jäkle F., Coord. Chem. Rev. 2006, 250, 1107–1121.
    1. Elbing M., Bazan G. C., Angew. Chem. Int. Ed. 2008, 47, 834–838; - PubMed
    2. Angew. Chem. 2008, 120, 846–850.

LinkOut - more resources