. 2022 Jul 18;82(14):2640-2655.
doi: 10.1158/0008-5472.CAN-21-4052.

Intracellular Acetyl CoA Potentiates the Therapeutic Efficacy of Antitumor CD8+ T Cells

Affiliations

Intracellular Acetyl CoA Potentiates the Therapeutic Efficacy of Antitumor CD8+ T Cells

Snehanshu Chowdhury et al. Cancer Res. .

Abstract

Effector CD8+ T cells rely primarily on glucose metabolism to meet their biosynthetic and functional needs. However, nutritional limitations in the tumor microenvironment can cause T-cell hyporesponsiveness. Therefore, T cells must acquire metabolic traits enabling sustained effector function at the tumor site to elicit a robust antitumor immune response. Here, we report that IL12-stimulated CD8+ T cells have elevated intracellular acetyl CoA levels and can maintain IFNγ levels in nutrient-deprived, tumor-conditioned media (TCM). Pharmacological and metabolic analyses demonstrated an active glucose-citrate-acetyl CoA circuit in IL12-stimulated CD8+ T cells supporting an intracellular pool of acetyl CoA in an ATP-citrate lyase (ACLY)-dependent manner. Intracellular acetyl CoA levels enhanced histone acetylation, lipid synthesis, and IFNγ production, improving the metabolic and functional fitness of CD8+ T cells in tumors. Pharmacological inhibition or genetic knockdown of ACLY severely impaired IFNγ production and viability of CD8+ T cells in nutrient-restricted conditions. Furthermore, CD8+ T cells cultured in high pyruvate-containing media in vitro acquired critical metabolic features of IL12-stimulated CD8+ T cells and displayed improved antitumor potential upon adoptive transfer in murine lymphoma and melanoma models. Overall, this study delineates the metabolic configuration of CD8+ T cells required for stable effector function in tumors and presents an affordable approach to promote the efficacy of CD8+ T cells for adoptive T-cell therapy.

Significance: IL12-mediated metabolic reprogramming increases intracellular acetyl CoA to promote the effector function of CD8+ T cells in nutrient-depleted tumor microenvironments, revealing strategies to potentiate the antitumor efficacy of T cells.


Figures

Figure 1. Sustained IFNγ production by IL12-stimulated CD8+ T cells in TCM. A and B, CD8+ T cells were activated for 3 days, followed by overnight exposure in either 80% TCM or complete media before being assessed for IFNγ production by flow cytometry (A) and ELISA (B). Adjacent scatter plot of A represents the frequency of IFNγ-producing CD8+ T cells. C, Human CD8+ T cells were activated for 3 days before being exposed overnight in 80% ascitic fluid (obtained from ovarian tumor-bearing patients)–containing media. Adjacent scatter plot represents the frequency of IFNγ-producing CD8+ T cells. D, Flow cytometry–based evaluation of the frequency of CD8+ T cells expressing CD39 and CD73. Adjacent bar diagram represents the cumulative data from three independent experiments. E, Intracellular expression of T-bet in IL2- and IL12-stimulated CD8+ T cells with or without overnight exposure in 80% TCM. Adjacent bar diagram represents the cumulative data of mean fluorescence intensity (MFI). F, Intracellular IFNγ production by IL2-stimulated CD8+ T cells cultured overnight either in complete RPMI, or 3.5kDa dialyzed TCM or undialized TCM. Adjacent bar diagram represents the frequency of IFNγ-producing CD8+ T cells. G–I, Biochemical measurement of glucose (Glu; G), glutamine (Gln; H), and lactate (I) levels in TCM, EL-4 tumor interstitial fluid, and complete RPMI. J, Assessment of intracellular IFNγ production by IL2-stimulated CD8+ T cells either in complete RPMI, or 80% TCM, or 80% TCM supplemented with the indicated concentration of glucose and glutamine. Data are representative of eight (A), four (B), three (C, E, F, G, H, I, and J), and five independent experiments (D). *, P < 0.05; **, P < 0.01; ***, P < 0.005; ****, P < 0.0001; ns, nonsignificant.
Figure 1.
Sustained IFNγ production by IL12-stimulated CD8+ T cells in TCM. A and B, CD8+ T cells were activated for 3 days, followed by overnight exposure in either 80% TCM or complete media before being assessed for IFNγ production by flow cytometry (A) and ELISA (B). Adjacent scatter plot of A represents the frequency of IFNγ-producing CD8+ T cells. C, Human CD8+ T cells were activated for 3 days before being exposed overnight in 80% ascitic fluid (obtained from ovarian tumor-bearing patients)–containing media. Adjacent scatter plot represents the frequency of IFNγ-producing CD8+ T cells. D, Flow cytometry–based evaluation of the frequency of CD8+ T cells expressing CD39 and CD73. Adjacent bar diagram represents the cumulative data from three independent experiments. E, Intracellular expression of T-bet in IL2- and IL12-stimulated CD8+ T cells with or without overnight exposure in 80% TCM. Adjacent bar diagram represents the cumulative data of mean fluorescence intensity (MFI). F, Intracellular IFNγ production by IL2-stimulated CD8+ T cells cultured overnight either in complete RPMI, or 3.5kDa dialyzed TCM or undialized TCM. Adjacent bar diagram represents the frequency of IFNγ-producing CD8+ T cells. G–I, Biochemical measurement of glucose (Glu; G), glutamine (Gln; H), and lactate (I) levels in TCM, EL-4 tumor interstitial fluid, and complete RPMI. J, Assessment of intracellular IFNγ production by IL2-stimulated CD8+ T cells either in complete RPMI, or 80% TCM, or 80% TCM supplemented with the indicated concentration of glucose and glutamine. Data are representative of eight (A), four (B), three (C, E, F, G, H, I, and J), and five independent experiments (D). *, P < 0.05; **, P < 0.01; ***, P < 0.005; ****, P < 0.0001; ns, nonsignificant.
Figure 2. Distinct transcriptional profile of IL2- and IL12-stimulated CD8+ T cells exposed overnight in either complete media or 80% TCM. A, PCA plot depicting the distribution of the gene profile of each sample from four different groups. B, Venn diagram showing the overlap of upregulated DEGs between each group (Padj <0.05). C, Heatmap showing the expression of selected genes from 292 upregulated DEGs common between IL2 versus IL12 and IL2 TCM versus IL12 TCM. D, Heatmap showing the expression of selected genes from 183 upregulated DEGs common between IL2 versus IL12, IL2 versus IL12 TCM, and IL12 versus IL12 TCM. Fold change represents fold change on a log2 scale, whereas Padj represents the adjusted P value.
Figure 2.
Distinct transcriptional profile of IL2- and IL12-stimulated CD8+ T cells exposed overnight in either complete media or 80% TCM. A, PCA plot depicting the distribution of the gene profile of each sample from four different groups. B, Venn diagram showing the overlap of upregulated DEGs between each group (Padj <0.05). C, Heatmap showing the expression of selected genes from 292 upregulated DEGs common between IL2 versus IL12 and IL2 TCM versus IL12 TCM. D, Heatmap showing the expression of selected genes from 183 upregulated DEGs common between IL2 versus IL12, IL2 versus IL12 TCM, and IL12 versus IL12 TCM. Fold change represents fold change on a log2 scale, whereas Padj represents the adjusted P value.
Figure 3. Increased glucose catabolism through glycolysis sustains IFNγ production by IL12-stimulated CD8+ T cells in TCM. A, Glucose uptake by 2-NBDG. Adjacent scatter plot represents the cumulative data of mean fluorescence intensity (MFI) from three independent experiments. B–E, Activated CD8+ T cells cultured overnight either in 80% TCM or complete media were evaluated for ECAR time course in response to glucose, oligomycin (Oligo), and 2DG (B); ECAR level after glucose addition (C); glycolytic capacity of the cells (D); qPCR analysis of glycolysis associated genes (E); OCR under basal condition and in response to indicated inhibitors (F); and spare respiratory capacity (SRC; G). H, Schematic representation of the glucose metabolism pathway and targets of the indicated inhibitors. I and J, CD8+ T cells were activated with IL12 in the presence or absence of glycolytic inhibitors (2DG, 1 mmol/L; IAA, 5 μmol/L; oxalate, 20 μmol/L; I) or mitochondrial pyruvate transporter inhibitor (UK5099, 20 μmol/L) in combination with gluconeogenesis inhibitor (3MPA, 500 μmol/L; J) before being evaluated for intracellular IFNγ production in 80% TCM. The scatter plot represents the cumulative data from three independent experiments. *, P < 0.05; **, P < 0.01; ***, P < 0.005; ****, P < 0.0001; ns, nonsignificant.
Figure 3.
Increased glucose catabolism through glycolysis sustains IFNγ production by IL12-stimulated CD8+ T cells in TCM. A, Glucose uptake by 2-NBDG. Adjacent scatter plot represents the cumulative data of mean fluorescence intensity (MFI) from three independent experiments. B–E, Activated CD8+ T cells cultured overnight either in 80% TCM or complete media were evaluated for ECAR time course in response to glucose, oligomycin (Oligo), and 2DG (B); ECAR level after glucose addition (C); glycolytic capacity of the cells (D); qPCR analysis of glycolysis associated genes (E); OCR under basal condition and in response to indicated inhibitors (F); and spare respiratory capacity (SRC; G). H, Schematic representation of the glucose metabolism pathway and targets of the indicated inhibitors. I and J, CD8+ T cells were activated with IL12 in the presence or absence of glycolytic inhibitors (2DG, 1 mmol/L; IAA, 5 μmol/L; oxalate, 20 μmol/L; I) or mitochondrial pyruvate transporter inhibitor (UK5099, 20 μmol/L) in combination with gluconeogenesis inhibitor (3MPA, 500 μmol/L; J) before being evaluated for intracellular IFNγ production in 80% TCM. The scatter plot represents the cumulative data from three independent experiments. *, P < 0.05; **, P < 0.01; ***, P < 0.005; ****, P < 0.0001; ns, nonsignificant.
Figure 4. Intracellular acetyl CoA levels regulate the fate and function of IL12-stimulated CD8+ T cells in TCM. A–C, Mass spectrometry-based determination of intracellular metabolite levels of glycolysis (A), PPP (B), and TCA cycle (C). Cumulative data from three biological replicates are shown. D, Intracellular acetyl CoA level in IL2- and IL12-stimulated CD8+ T cells. E, qPCR analysis of Acly expression. F–J, Isotopologue distribution for acetyl CoA (F), citrate (G), fumarate (H), malate (I), and oxaloacetate (J) in CD8+ T cells stimulated either with IL2 or IL12 in a medium containing 13C6 glucose. K–N, ACLY inhibitor BMS303141-treated or empty vector–transduced or Acly shRNA-transduced CD8+ T cells were stimulated with IL12, followed by overnight exposure in 80% TCM and used for evaluation of IFNγ production (K and L) and percentage of viable cells by flow cytometry–based staining of live/dead dye (M and N). Adjacent plots represent the cumulative data from three independent experiments. O and P, CD8+ T cells activated with either IL2 or IL12 were used to evaluate transcript levels of Srebp1 (O), and Fasn and Acaca (P). Q–S, Intracellular lipid content using BODIPY was determined in IL2 and IL12-stimulated CD8+ T cells after 3 days of activation (Q), both the cell types after overnight exposure in 80% TCM (R), and IL12-stimulated CD8+ T cells exposed overnight in 80% TCM ± orlistat (100 μmol/L; S). Data are representative of three independent experiments. MFI, mean fluorescence intensity. T and U, Determination of percentage of viable cells (T) and intracellular ATP level (U) in IL12-stimulated CD8+ T cells exposed overnight in 80% TCM in the presence or absence of orlistat (100 μmol/L). Data are representative of three independent experiments with similar results. V, CD8+ T cells were activated for three days and evaluated for OCR time course in response to different concentrations of etomoxir/media, oligomycin, FCCP and rotenone+antimycin A in glucose-free conditions. *, P < 0.05; **, P < 0.01; ***, P < 0.005; ****, P < 0.0001; ns, nonsignificant.
Figure 4.
Intracellular acetyl CoA levels regulate the fate and function of IL12-stimulated CD8+ T cells in TCM. A–C, Mass spectrometry-based determination of intracellular metabolite levels of glycolysis (A), PPP (B), and TCA cycle (C). Cumulative data from three biological replicates are shown. D, Intracellular acetyl CoA level in IL2- and IL12-stimulated CD8+ T cells. E, qPCR analysis of Acly expression. F–J, Isotopologue distribution for acetyl CoA (F), citrate (G), fumarate (H), malate (I), and oxaloacetate (J) in CD8+ T cells stimulated either with IL2 or IL12 in a medium containing 13C6 glucose. K–N, ACLY inhibitor BMS303141-treated or empty vector–transduced or Acly shRNA-transduced CD8+ T cells were stimulated with IL12, followed by overnight exposure in 80% TCM and used for evaluation of IFNγ production (K and L) and percentage of viable cells by flow cytometry–based staining of live/dead dye (M and N). Adjacent plots represent the cumulative data from three independent experiments. O and P, CD8+ T cells activated with either IL2 or IL12 were used to evaluate transcript levels of Srebp1 (O), and Fasn and Acaca (P). Q–S, Intracellular lipid content using BODIPY was determined in IL2 and IL12-stimulated CD8+ T cells after 3 days of activation (Q), both the cell types after overnight exposure in 80% TCM (R), and IL12-stimulated CD8+ T cells exposed overnight in 80% TCM ± orlistat (100 μmol/L; S). Data are representative of three independent experiments. MFI, mean fluorescence intensity. T and U, Determination of percentage of viable cells (T) and intracellular ATP level (U) in IL12-stimulated CD8+ T cells exposed overnight in 80% TCM in the presence or absence of orlistat (100 μmol/L). Data are representative of three independent experiments with similar results. V, CD8+ T cells were activated for three days and evaluated for OCR time course in response to different concentrations of etomoxir/media, oligomycin, FCCP and rotenone+antimycin A in glucose-free conditions. *, P < 0.05; **, P < 0.01; ***, P < 0.005; ****, P < 0.0001; ns, nonsignificant.
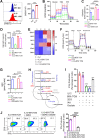
Figure 5. Activation of CD8+ T cells in high pyruvate–containing media possesses the metabolic traits of IL12-stimulated CD8+ T cells. A, CD8+ T cells were activated either in complete media or high pyruvate (5 mmol/L)–containing media (without glucose) and levels of acetyl CoA were measured. Data are representative of three independent experiments with similar results. B–E, G, and H, CD8+ T cells were activated either in complete media or high pyruvate (5 mmol/L)–containing media (without glucose) ± BMS303141 and evaluated for H3K9Ac level (B and D), H3K27Ac level (C and E), intracellular IFNγ production (G and H) either in complete media or 80% TCM. Adjacent plots represent the cumulative data from three (B–E and H) and four (G) independent experiments. F and I-K, CD8+ T cells activated either in complete media or high pyruvate–containing media (without glucose) were assessed for transcript level Acly (F), determination of glucose uptake by 2NBDG (I), mRNA expression of various glycolytic genes (J), and transcript levels of Srebp1, Fasn, and Acaca (K). L, Intracellular ATP levels in IL2 Py cells exposed overnight to 80% TCM in the presence or absence of orlistat. Data are representative of three (F and I–L) independent experiments with similar results. *, P < 0.05; **, P < 0.01; ***, P < 0.005; ****, P < 0.0001. MFI, mean fluorescence intensity.
Figure 5.
Activation of CD8+ T cells in high pyruvate–containing media possesses the metabolic traits of IL12-stimulated CD8+ T cells. A, CD8+ T cells were activated either in complete media or high pyruvate (5 mmol/L)–containing media (without glucose) and levels of acetyl CoA were measured. Data are representative of three independent experiments with similar results. B–E, G, and H, CD8+ T cells were activated either in complete media or high pyruvate (5 mmol/L)–containing media (without glucose) ± BMS303141 and evaluated for H3K9Ac level (B and D), H3K27Ac level (C and E), intracellular IFNγ production (G and H) either in complete media or 80% TCM. Adjacent plots represent the cumulative data from three (B–E and H) and four (G) independent experiments. F and I-K, CD8+ T cells activated either in complete media or high pyruvate–containing media (without glucose) were assessed for transcript level Acly (F), determination of glucose uptake by 2NBDG (I), mRNA expression of various glycolytic genes (J), and transcript levels of Srebp1, Fasn, and Acaca (K). L, Intracellular ATP levels in IL2 Py cells exposed overnight to 80% TCM in the presence or absence of orlistat. Data are representative of three (F and I–L) independent experiments with similar results. *, P < 0.05; **, P < 0.01; ***, P < 0.005; ****, P < 0.0001. MFI, mean fluorescence intensity.
Figure 6. IL12 and IL2 Py cells exhibit enhanced antitumor response in vivo. A, Illustration of experimental strategy. B, C57BL/6 mice (n = 5 mice/group) with 9 days subcutaneously established EL4-OVA tumor were either kept untreated or treated by adoptively transferring (intravenously) 0.5 × 10⁶ OT-1 CD8+ T cells. Tumor growth was measured using a digital caliper every third day. Data in figure demonstrate the mean tumor volume at each time point. C, Kaplan–Meier curves for time-to-sacrifice for experimental conditions are shown. D, Flow cytometric evaluation of EL4-OVA–specific OT-1 T cells (vβ5.1+CD8+ T cells) in the peripheral blood of tumor-bearing mice after 14 days following T-cell transfer. Adjacent bar diagram representing the cumulative data of the percentage of tumor specific OT-1 T cells from tumor-bearing mice (n = 5/group). E, frequency of adoptively transferred OT1 T cells present at the tumor site (top) and IFNγ production by intratumoral OT1 T cells following restimulation with PMA and ionomycin (bottom). F–K, C57BL/6 mice (n = 4 mice/group) with subcutaneously established EL4-OVA tumor were adoptively transferred with OT-1 CD8+ T cells stimulated either with IL12 ± BMS303141 or IL2 Py ± BMS303141. F and G, tumor growth was measured using a digital caliper every third day and the mean tumor volume at each time point is presented. H and I, Kaplan–Meier curves for time-to-sacrifice for experimental conditions are shown. J and K, Frequency of adoptively transferred OT1 T cells present at the tumor site (top), and IFNγ production by intratumoral OT1 T cells following restimulation with PMA and ionomycin (bottom) are shown. *, P < 0.05; **, P < 0.01; ****, P < 0.0001; ns, nonsignificant.
Figure 6.
IL12 and IL2 Py cells exhibit enhanced antitumor response in vivo.A, Illustration of experimental strategy. B, C57BL/6 mice (n = 5 mice/group) with 9 days subcutaneously established EL4-OVA tumor were either kept untreated or treated by adoptively transferring (intravenously) 0.5 × 10⁶ OT-1 CD8+ T cells. Tumor growth was measured using a digital caliper every third day. Data in figure demonstrate the mean tumor volume at each time point. C, Kaplan–Meier curves for time-to-sacrifice for experimental conditions are shown. D, Flow cytometric evaluation of EL4-OVA–specific OT-1 T cells (vβ5.1+CD8+ T cells) in the peripheral blood of tumor-bearing mice after 14 days following T-cell transfer. Adjacent bar diagram representing the cumulative data of the percentage of tumor specific OT-1 T cells from tumor-bearing mice (n = 5/group). E, frequency of adoptively transferred OT1 T cells present at the tumor site (top) and IFNγ production by intratumoral OT1 T cells following restimulation with PMA and ionomycin (bottom). F–K, C57BL/6 mice (n = 4 mice/group) with subcutaneously established EL4-OVA tumor were adoptively transferred with OT-1 CD8+ T cells stimulated either with IL12 ± BMS303141 or IL2 Py ± BMS303141. F and G, tumor growth was measured using a digital caliper every third day and the mean tumor volume at each time point is presented. H and I, Kaplan–Meier curves for time-to-sacrifice for experimental conditions are shown. J and K, Frequency of adoptively transferred OT1 T cells present at the tumor site (top), and IFNγ production by intratumoral OT1 T cells following restimulation with PMA and ionomycin (bottom) are shown. *, P < 0.05; **, P < 0.01; ****, P < 0.0001; ns, nonsignificant.

References

    1. Wei SC, Duffy CR, Allison JP. Fundamental mechanisms of immune checkpoint blockade therapy. Cancer Discov 2018;8:1069–86. - PubMed
    1. Morotti M, Albukhari A, Alsaadi A, Artibani M, Brenton JD, Curbishley SM, et al. . Promises and challenges of adoptive T-cell therapies for solid tumours. Br J Cancer 2021;124:1759–76. - PMC - PubMed
    1. Sharma P, Allison JP. The future of immune checkpoint therapy. Science 2015;348:56–61. - PubMed
    1. Zarour HM. Reversing T-cell dysfunction and exhaustion in cancer. Clin Cancer Res 2016;22:1856–64. - PMC - PubMed
    1. DePeaux K, Delgoffe GM. Metabolic barriers to cancer immunotherapy. Nat Rev Immunol 2021;21:785–97. - PMC - PubMed

Publication types