. 2022 Nov;112(5):1089-1104.
doi: 10.1002/JLB.3A0122-075RR. Epub 2022 Jun 1.

BRAF-V600E utilizes posttranscriptional mechanisms to amplify LPS-induced TNFα production in dendritic cells in a mouse model of Langerhans cell histiocytosis

Affiliations

BRAF-V600E utilizes posttranscriptional mechanisms to amplify LPS-induced TNFα production in dendritic cells in a mouse model of Langerhans cell histiocytosis

Danielle Minichino et al. J Leukoc Biol. 2022 Nov.

Abstract

Langerhans cell histiocytosis (LCH) is an inflammatory disease characterized by abnormal dendritic cells (DCs) with hyperactive ERK signaling, called "LCH cells." Since DCs rely on ERK signaling to produce inflammatory molecules in response to pathogenic cues, we hypothesized that hyperactive ERK enhances DCs inflammatory responses. We specifically investigated TLR4-induced TNFα production in LCH cells by utilizing the BRAF-V600Efl/+ :CD11c-Cre mouse model of LCH, which hyperactivates ERK in DCs. We measured LPS-induced TNFα production both in vivo and in vitro using splenic CD11c+ cells and bone marrow-derived DCs with or without pharmacologic BRAFV600E inhibition. We observed a reversible increase in secreted TNFα and a partially reversible increase in TNFα protein per cell, despite a decrease in TLR4 signaling and Tnfa transcripts compared with controls. We examined ERK-driven, posttranscriptional mechanisms that contribute to TNFα production and secretion using biochemical and cellular assays. We identified a reversible increase in TACE activation, the enzyme required for TNFα secretion, and most strikingly, an increase in protein translation, including TNFα. Defining the translatome through polysome-bound RNA sequencing revealed up-regulated translation of the LPS-response program. These data suggest hyperactive ERK signaling utilizes multiple posttranscriptional mechanisms to amplify inflammatory responses in DCs, advancing our understanding of LCH and basic DC biology.

Keywords: cancer; dendritic cell; herbal medicines; immunosurveillance; innate immunity; signaling; translation.


Conflict of interest statement

DISCLOSURE

The authors declare that there is no conflict of interest that could be perceived as prejudicing the impartiality of the research reported.

Figures
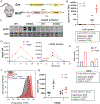
FIGURE 1
FIGURE 1
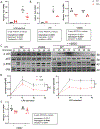
BRAFV600E expression increases the LPS-induced TNFa response in vivo and in vitro. (A) Schematic diagram of the LCH mouse model. (B) Circulating TNFα levels measured by ELISA from serum 2 h after i.p. injection of LPS (2 mg/kg) or PBS. (C) BMDCs from WT (V600Efl/+, Cre-negative) and LCH (V600Efl/+, CD11c-Cre1) mice were treated with V600E-inhibitor for 1 h before whole cell lysates were immunoblotted for total and phosphorylated levels of ERK1/2 (n = 3). (D–E) BMDCs were stimulated with LPS (100 ng/ml) for the indicated time points with (right) or without (left) V600E-inhibitor pretreatment (PLX7904, 0.5 μM). TNFα in the cell supernatant was measured by ELISA (n = 3) (D) and the area under the curve was plotted (n = 3) (E). (F and G) BMDCs stimulated with LPS (100 ng/ml, 120 min) ± V600E-inhibitor pretreatment (PLX7904, 0.5 μM, 1 h) in the presence of BrefeldinA (5 μg/ml). (D) Intracellular levels of TNFα in CD11c+MHCII+ population were measured by flow-cytometry and a representative histogram of TNFa is shown. (E) The median fluorescent intensities ± sem was plotted. All data are representative of 3 independent experiments. All data were analyzed using a 2-way ANOVA
FIGURE 2
FIGURE 2
BRAFV600E-DCs have reduced LPS-mediated TLR4 signaling and Tnfa transcription. (A) The spleens from the mice used in Figure 1(B) were subjected to magnetic bead isolation of CD11c+ cells and RNA was used for qPCR of Tnfa. A representative plot of mean ± sem from 1 of 3 independent experiments (n = 3–5) was analyzed by a 2-way ANOVA. (B) Tnfa qPCR of LPS or PBS-stimulated BMDCs (100 ng/ml, 3 h) (left), or LPS-stimulated ± V600E-inhibitor pretreatment (PLX7904, 0.5 μM, 1 h) (right). Representative plots of mean ± sem from 1 of 3 independent experiments (n = 3–5) was analyzed by a 2-way ANOVA. (C and D) BMDCs were stimulated with LPS (100 ng/ml) for the indicated time points with (right) or without (left) V600E-inhibitor pretreatment (PLX7904, 0.5 μM). Whole cell lysates were immunoblotted for total and phosphorylated levels of p65 and ERK. Representative blots (C) and normalized quantifications (D) are shown from 1 of 3 repeat experiments (n = 3). Symbols are mean ± sem. Area under the curve was calculated and p values from an unpaired t-test are indicated on the plots in (D) (ns p > 0.05; *p < 0.05). (E) Tlr4 qPCR from unstimulated BMDCs ± V600E inhibition (PLX7904, 0.5 μM, 1 h). Data plotted and analyzed as in (B)
FIGURE 3
FIGURE 3
BRAFV600E increases TACE activity in DCs. (A) BMDCs were pretreated with (right) or without (middle or left) V600E-inhibitor (PLX7904, 0.5 μM) for 1 h prior to a 2-h stimulation with or without LPS (100 ng/ml). Cells were then subjected to a TACE-activity fluorescent-based assay over time. The fold-change was calculated for each sample and the mean ± sem of data from 2 independent experiments (n = 3–4) were plotted and analyzed using a simple linear regression (comparison of slopes; ns p > 0.05; **p < 0.01). (B) qPCR analysis of Adam17 from BMDCs stimulated with LPS (100 ng/ml) for 3 h ± V600E-inhibitor pretreatment (PLX7904, 0.5 μM). A representative plot of mean ± sem from 3 indpenedent experiments (n = 3) is shown and analyzed by a 2-way ANOVA. (C) BMDCs stimulated with LPS (100 ng/ml) for 1 h were subjected to a generic MMP-activity assay over time (n = 3) and mean ± sem was plotted and analyzed using a simple linear regression (ns p > 0.05). (D) BMDCs were treated with 5 ng/ml of recombinant murine TNFa. After 4 h, the remaining TNFa in the supernatant was measured by ELISA and normalized to a no-cell control. The mean ± sem of % of TNF uptake was plotted from 3 independent experiments (n = 2–3) and tested with a 2-way ANOVA (interactive p value indicated in the top left corner of the plot; ns p > 0.05)
FIGURE 4
FIGURE 4
BRAFV600E-BMDCs increase translation initiation and elongation. (A–E) BMDCs were stimulated with LPS (100 ng/ml) for 3 h ± V600E-inhibitor pretreatment for 1 h (PLX7904, 0.5 μM). (A) BMDCs were then treated with cycloheximide (CHX) + Brefeldin A (5 μg/ml) for indicated time points. TNF from 40 μg of whole cell lysates was measured by ELISA. Mean ± sem of fold-changes from 3 repeat experiments (n = 3) were plotted and fit by nonlinear regression (comparison of K values; ns p > 0.05). (B and C) BMDCs were subjected to polysome profiling. (B) A representative plot of RNA concentrations per fraction. (C) qPCR analysis of tnfa from isolated total and pooled-polysomal RNA (≥2 polysomes) was used to calculate the ratio of polysomal-bound tnfa mRNA. Mean ± sem of fold changes were plotted from 1 of 2 independent experiments (n = 2–3) and analyzed by a 2-way ANOVA and Sidak’s multiple comparison test (adj p value for V600E; **p < 0.01). (D) Concentration of ribosomal subunits was measured from total RNA using a BioAnalyzer and the per-cell number of 18S and 28S subunits from a representative experiment of 3 repeats (n = 2–3) was plotted and analyzed by a 2-way ANOVA (interaction p value; ns p > 0.05). (E) Whole cell lysates were immunoblotted for total and phosphorylated eEF2. A representative blot is shown (top) and quantified mean ± sem from 1 of 2 repeat experiments (n = 3–5) was plotted (bottom) and a mixed-effects analysis was applied (interaction p values; *p < 0.05; **p < 0.01). (F and G) BMDCs pretreated with or without V600E-inhibitor (PLX7904, 0.5 μM) were treated with harringtonine (2 μg/ml) for the indicated times before the addition of puromycin (10 μg/ml, 10 min). Cells were subjected to flow cytometry and gated on CD11c+MHCII+. (F) Representative puromycin histograms from 1 of 3 repeat experiments (n = 3). (G) Combined puromycin MFIs from 3 independent experiments were plotted and fit by nonlinear regression analysis (comparison of k values; **p < 0.01)
FIGURE 5
FIGURE 5
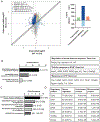
BRAFV600E promotes translation of inflammatory mediators by selective and irreversible polysome binding (A) Scatter plot of log2 fold changes for polysome-associated mRNA (Y-axis) versus total mRNA (X-axis). Colors designate differentially regulated transcripts through translation, buffering, or abundance according to the anota2seq analysis of the inhibited contrast and is quantified in the bar graph (bottom). Unchanged mRNAs are shown in grey (n = 3). (B and C) Translationally up-regulated genes from the uninhibited and inhibited contrasts were combined and submitted for GO term (biologic process) enrichment analysis through DAVID. An FDR cutoff of 5% was applied before plotting the fold enrichment. [count, FDR]. For (B), genes from the “translation up” list that are associated with the GO terms are displayed to the right. (D) The translationally up-regulated gene list was uploaded to the AURA2 “batch mode” online mouse database using the “regulatory element enrichment” analysis mode. The resulting list was plotted after a 1% FDR cutoff was applied

Similar articles

References

    1. Favara BE, Feller AC, Pauli M, Jaffe ES, Weiss LM, Arico M, et al. Contemporary classification of histiocytic disorders. Med Pediatr Oncol. 1997;29:157–66. - PubMed
    1. van Furth R, Zanvil C. Origin and kinetics of mononuclear phagocytes. Ann N Y Acad Sci. 1976;278:161–75. - PubMed
    1. Morimoto A, Oh Y, Shioda Y, Kudo K, Imamura T. Recent advances in Langerhans cell histiocytosis. Pediatr Int. 2014;56:451–61. - PubMed
    1. Stålemark H, Laurencikas E, Karis J, Gavhed D, Fadeel B, Henter J-I. Incidence of langerhans cell histiocytosis in children: a population-based study helen. Pediatr Blood Cancer. 2008;50:1018–25. - PubMed
    1. Guyot-Goubin A, Donadieu J, Barkaoui M, Bellec S, Thomas C, Clavel J. Descriptive epidemiology of childhood langerhans cell histiocytosis in france, 2000–2004. Pediatr Blood Cancer. 2008;51:71–5. - PubMed

MeSH terms

Substances