. 2022 Jun 1;18(6):e1010235.
doi: 10.1371/journal.pgen.1010235. eCollection 2022 Jun.

Enhanced transcriptional heterogeneity mediated by NF-κB super-enhancers

Affiliations

Enhanced transcriptional heterogeneity mediated by NF-κB super-enhancers

Johannes N Wibisana et al. PLoS Genet. .

Abstract

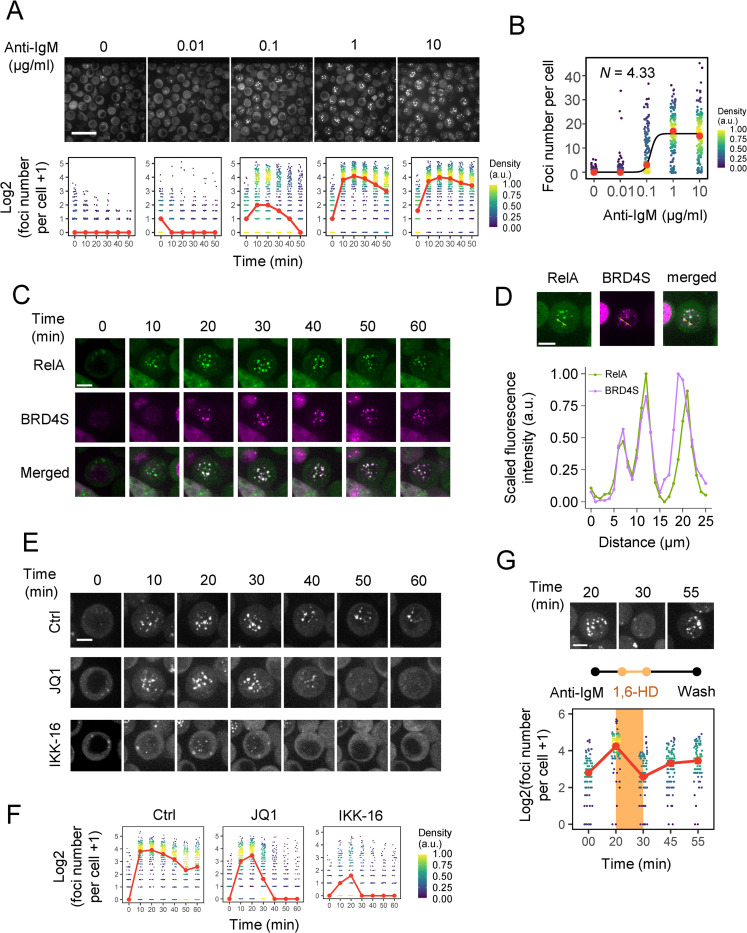
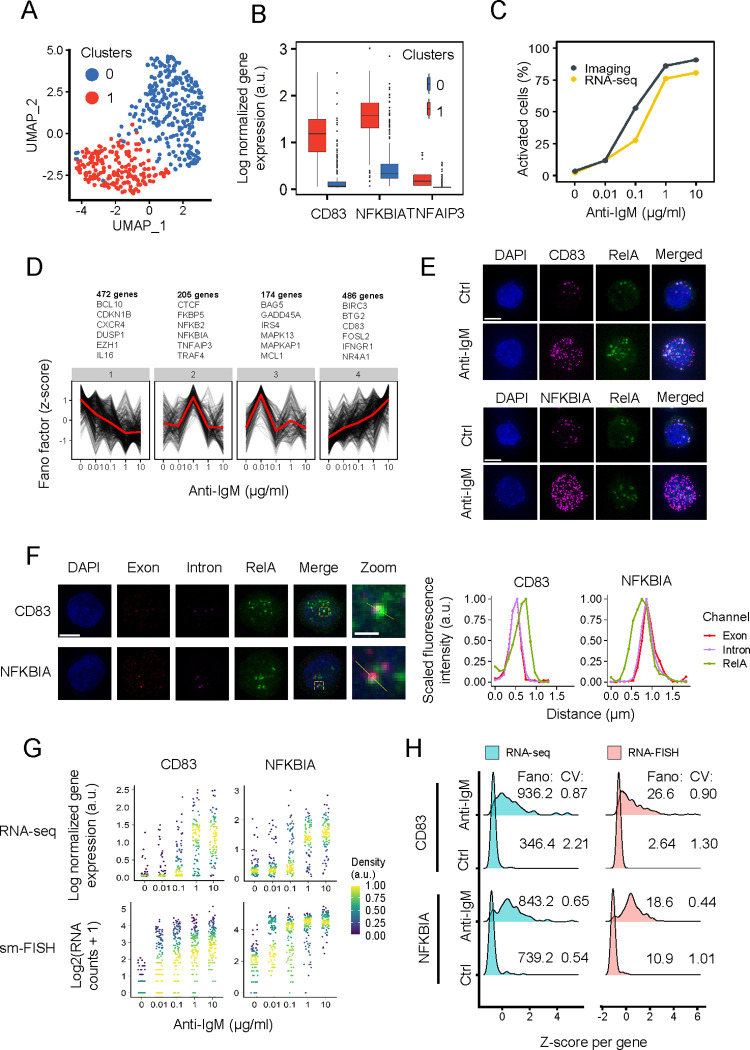
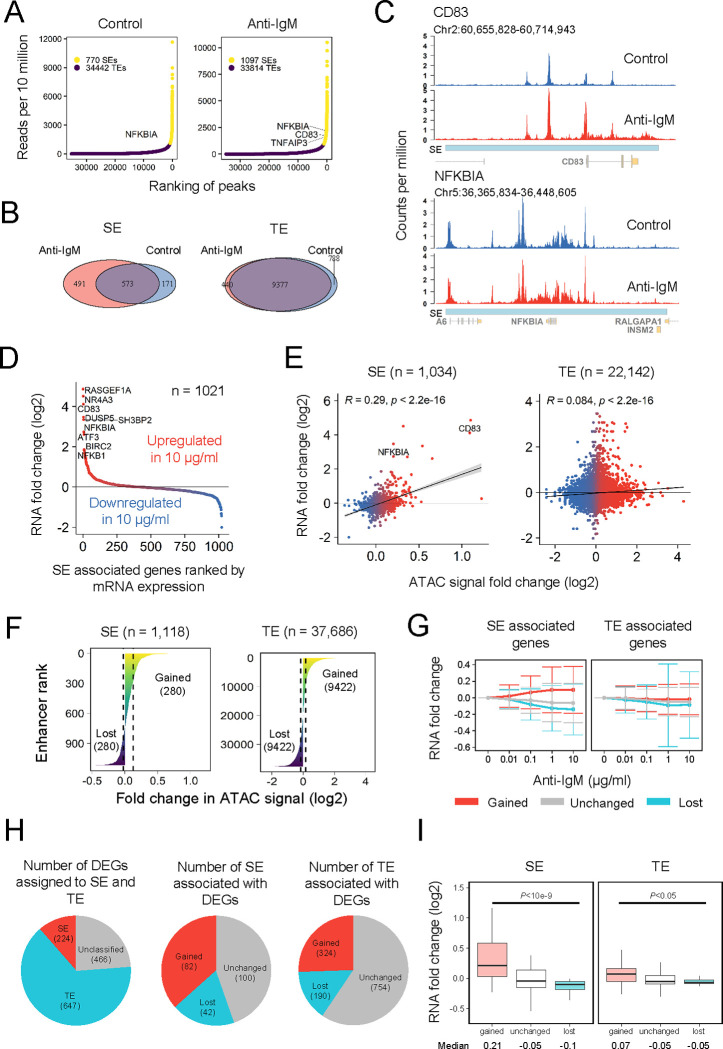
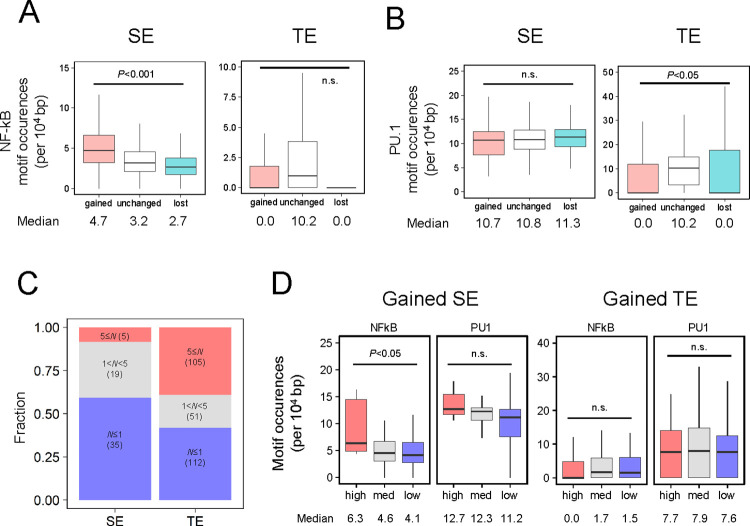
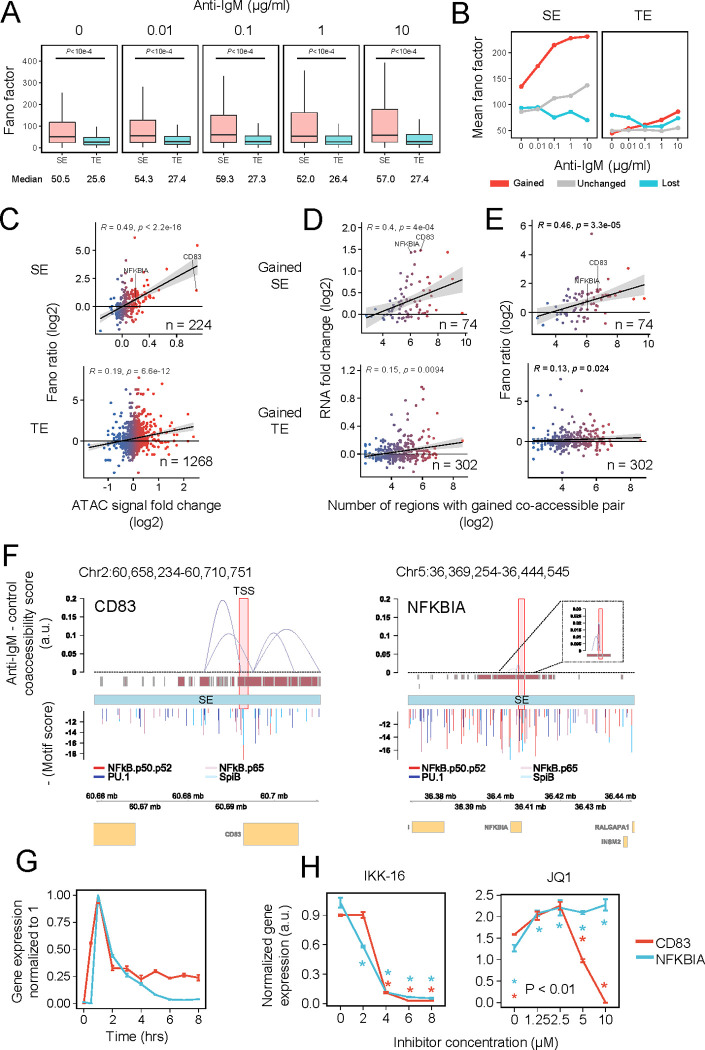
The transcription factor NF-κB, which plays an important role in cell fate determination, is involved in the activation of super-enhancers (SEs). However, the biological functions of the NF-κB SEs in gene control are not fully elucidated. We investigated the characteristics of NF-κB-mediated SE activity using fluorescence imaging of RelA, single-cell transcriptome and chromatin accessibility analyses in anti-IgM-stimulated B cells. The formation of cell stimulation-induced nuclear RelA foci was abolished in the presence of hexanediol, suggesting an underlying process of liquid-liquid phase separation. The gained SEs induced a switch-like expression and enhanced cell-to-cell variability in transcriptional response. These properties were correlated with the number of gained cis-regulatory interactions, while switch-like gene induction was associated with the number of NF-κB binding sites in SE. Our study suggests that NF-κB SEs have an important role in the transcriptional regulation of B cells possibly through liquid condensate formation consisting of macromolecular interactions.


Conflict of interest statement

The authors have declared that no competing interests exist.

Figures

Fig 1
Fig 1. RelA foci demonstrate SE-like properties.
(A) Representative real-time fluorescence micrographs of an individual RelA-GFP-expressing DT40 cell upon stimulation with 10 μg/mL anti-IgM (scale bar, 25 μm) and the quantification of the number of foci per cell across various anti-IgM doses (red points represent the median). (B) Quantification of the number of foci per cell after 20 min of various doses of anti-IgM stimulation (red dots represent the median). The median value was fitted to the Hill equation, resulting in a Hill coefficient of 4.33. (C) Time-lapse fluorescence micrograph of DT40 cells co-expressing mKate2-BRD4S and RelA-GFP upon stimulation with 10 μg/mL anti-IgM (scale bar, 5 μm). (D) Quantification of the co-localization of mKate2-BRD4S and RelA-GFP 20 min after anti-IgM stimulation. (E) Representative fluorescence micrographs of RelA-GFP-expressing DT40 cells pre-treated with 5 μM JQ1 for 60 min or 4 μM IKK-16 for 60 min. (F) Quantification of RelA foci from (E). (G) Quantification of RelA-GFP foci before treatment, after 1,6-hexanediol treatment and washing. The threshold of foci detection was lowered to compensate for the low fluorescence intensities of the recovering foci.
Fig 2
Fig 2. NF-κB SE-regulated genes demonstrate SE-like dynamics.
(A) UMAP projection of the dimensionality reduction and clustering results of 453 cells scRNA-seq stimulated with various anti-IgM doses. (B) Box plot of the expression of known marker genes used to identify activated (red) and inactivated (blue) cell clusters. (C) Cell activation ratio from imaging obtained using logistic regression of foci at 20 min compared with the cell activation ratio from RNA-seq. (D) Hierarchical clustering analysis of Fano factors across anti-IgM concentrations for marker genes. The red lines represent the means. (E) Micrograph of CD83 and NFKBIA smRNA-FISH (scale bar, 5 μm). (F) Micrograph of CD83 and NFKBIA intronic smRNA-FISH (scale bar, 5 μm; zoomed scale bar, 1 μm). (G) RNA expression of CD83 (B cell activation marker) and NFKBIA (NF-κB target gene) across dose points obtained from scRNA-seq (upper graph) and smRNA-FISH (lower graph). (H) Density plot of CD83 and NFKBIA single-cell expression obtained from scRNA-seq and smRNA-FISH after stimulation with or without 10 μg/mL anti-IgM.
Fig 3
Fig 3. SE analysis.
(A) Plot of SEs determined using the ROSE algorithm [13] from cells with and without anti-IgM stimulation. (B) Venn diagram showing the number of genes assigned to SEs and TEs obtained from each stimulatory condition. Genes with multiple enhancers were assigned only to one enhancer, whereas gene with both SE and TE were assigned to SE. (C) ATAC-seq track view of NF-κB target genes in B cell CD83 and NFKBIA SEs in control and 10 μg/mL anti-IgM-stimulated DT40 chicken cells. (D) Scatter plot of the mean fold-change of SE-associated genes between 10 μg/mL anti-IgM stimulated and control cells. Genes with multiple SEs were counted once. (E) Correlation plot between TE and SE annotated peaks and the associated genes. Peaks associated with both SE and TE were assigned to SE. Genes with gene expression 0 across all doses were removed. RNA fold change was calculated between the mean of 10 μg/mL anti-IgM stimulated and control cells. (F) Regions with ATAC log2 fold changes signal more than the upper quantile were annotated as gained SEs/TEs and lower than the lower quantile were annotated as lost SEs/TEs. (G) Anti-IgM dose-response of fold change in the RNA level. Fold change was calculated from scRNA-seq by averaging the expression across all cells in the same stimulatory condition compared to dose 0. Number of genes: Gained SE, 260; Unchanged SE, 522; Lost SE, 239; Gained TE, 3598; Unchanged TE, 5384; Lost TE, 520. (H) Pie chart showing the classification of DEGs with SE and TE and TE/SE with DEGs, multiple enhancers might be assigned to a single DEG. (I) Boxplot of RNA log2 fold change between activated cells and inactivated cells for DEGs associated with TE and SE. Number of genes: Gained SE, 82; Unchanged SE, 100; Lost SE, 42; Gained TE, 242; Unchanged TE, 384; Lost TE, 21. P-values were calculated using one-way ANOVA with undersampling (n = 21).
Fig 4
Fig 4. Motif and Hill function analysis.
(A-B) Motif occurrences of (A) NF-κB and (B) PU.1 at SE and TE calculated using the “findMotifsGenome.pl” program with the “-find” option of Homer. Number of peaks: Gained SE, 280; Unchanged SE, 669; Lost SE, 280; Gained TE, 9024; Unchanged TE, 18050; Lost TE, 9021. TE for genes annotated for both SE and TE were removed. P-value was calculated using one-way ANOVA with undersampling (n = 280), n.s.: not significant. (C) Bar plot of the Hill coefficient for mean gene expression across doses. Genes with Hill coefficient > 9 and < 0.3 were removed. (D) Boxplot of motif occurrences for NF-kB and PU.1 at gained SE and gained TE with categorized Hill coefficients. High, 5 ≤ N < 9; Med, 1 < N < 5; Low, N ≤ 1. P-values were calculated using one-way ANOVA with undersampling, except for gained SE in the high category (n = 19), n.s.: not significant.
Fig 5
Fig 5. SE relationship with heterogeneity in gene expression.
(A) Boxplot of Fano factor at various doses for DEGs associated with gained, lost, unchanged TE, and SE. Number of genes: SE, 224; TE, 647. P-value was calculated using Welch’s unpaired t-test with undersampling (n = 224). (B) Line plot of mean Fano factor change across dose for SE and TE associated DEGs. Number of genes: Gained SE, 82; Unchanged SE, 100; Lost SE, 42; Gained TE, 242; Unchanged TE, 384; Lost TE, 21. (C) Correlation plot of Fano factor ratios (10 vs. 0 μg/mL anti-IgM-stimulated cells) against ATAC intensity fold changes at SEs and TEs of DEGs. R = Spearman correlation. (D) Correlation plot of RNA fold changes (activated vs inactivated cells) against numbers of co-accessible pairs. (E) Correlation plot of Fano factor ratios (10 vs 0 μg/mL anti-IgM-stimulated cells) against numbers of co-accessible pairs. (F) Co-accessibility score differences obtained using Cicero between stimulated and unstimulated cells shown between genomic regions interacting with regions ±1 kb around the annotated start site of CD83 (left) and NFKBIA (right). (G) Time-course RT-qPCR of CD83 and NFKBIA upon stimulation with 1 μg/mL anti-IgM. Gene expression was normalized to GAPDH. Error bar = SD. (H) RT-qPCR results of IKK-16 (left) and JQ1 (right) treatment 60 min prior to stimulation with 1 μg/mL anti-IgM for 60 min (n = 3). Gene expression was normalized to GAPDH, and P-values were calculated using Student’s unpaired t-test against dose 0 for each dose point. Error bar = SD.

References

    1. Stanic AK, Bezbradica JS, Park J-J, Matsuki N, Mora AL, Van Kaer L, et al.. NF-κB Controls Cell Fate Specification, Survival, and Molecular Differentiation of Immunoregulatory Natural T Lymphocytes. J Immunol. 2004;172: 2265–2273. doi: 10.4049/jimmunol.172.4.2265 - DOI - PubMed
    1. Hayden MS, Ghosh S. NF-κB, the first quarter-century: Remarkable progress and outstanding questions. Genes Dev. 2012;26: 203–234. doi: 10.1101/gad.183434.111 - DOI - PMC - PubMed
    1. Basak S, Behar M, Hoffmann A. Lessons from mathematically modeling the NF-κB pathway. Immunol Rev. 2012;246: 221–238. doi: 10.1111/j.1600-065X.2011.01092.x - DOI - PMC - PubMed
    1. Kurosaki T. Regulation of B cell fates by BCR signaling components. Curr Opin Immunol. 2002;14: 341–347. doi: 10.1016/s0952-7915(02)00344-8 - DOI - PubMed
    1. Schulze-Luehrmann J, Ghosh S. Antigen-Receptor Signaling to Nuclear Factor κB. Immunity. 2006;25: 701–715. doi: 10.1016/j.immuni.2006.10.010 - DOI - PubMed

Publication types

MeSH terms