. 2022 Jun 1;18(6):e1010241.
doi: 10.1371/journal.pgen.1010241. eCollection 2022 Jun.

Trim41 is required to regulate chromosome axis protein dynamics and meiosis in male mice

Affiliations

Trim41 is required to regulate chromosome axis protein dynamics and meiosis in male mice

Seiya Oura et al. PLoS Genet. .

Abstract

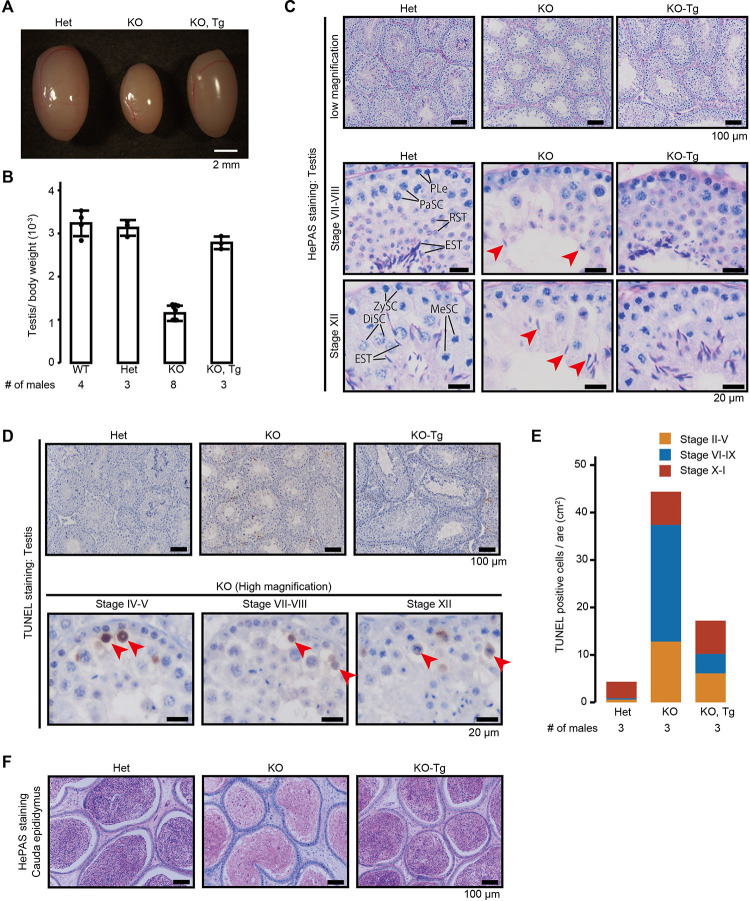
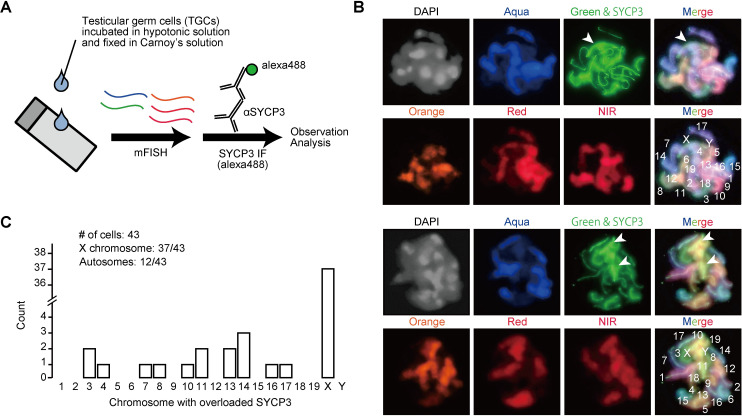
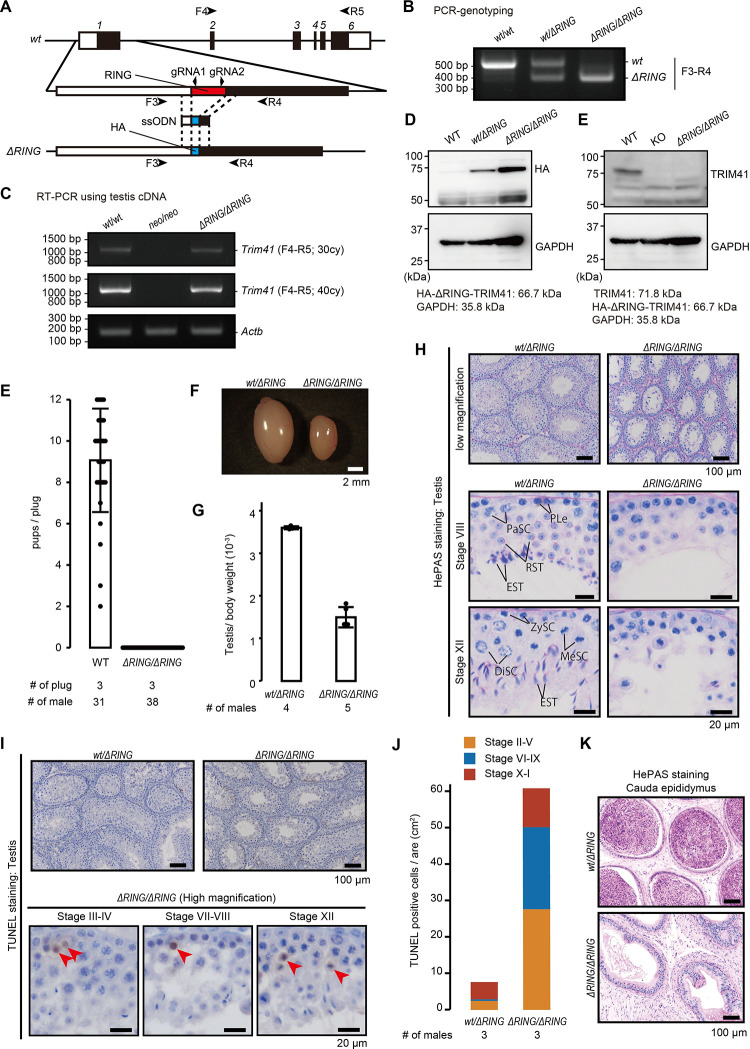
Meiosis is a hallmark event in germ cell development that accompanies sequential events executed by numerous molecules. Therefore, characterization of these factors is one of the best strategies to clarify the mechanism of meiosis. Here, we report tripartite motif-containing 41 (TRIM41), a ubiquitin ligase E3, as an essential factor for proper meiotic progression and fertility in male mice. Trim41 knockout (KO) spermatocytes exhibited synaptonemal complex protein 3 (SYCP3) overloading, especially on the X chromosome. Furthermore, mutant mice lacking the RING domain of TRIM41, required for the ubiquitin ligase E3 activity, phenocopied Trim41 KO mice. We then examined the behavior of mutant TRIM41 (ΔRING-TRIM41) and found that ΔRING-TRIM41 accumulated on the chromosome axes with overloaded SYCP3. This result suggested that TRIM41 exerts its function on the chromosome axes. Our study revealed that Trim41 is essential for preventing SYCP3 overloading, suggesting a TRIM41-mediated mechanism for regulating chromosome axis protein dynamics during male meiotic progression.


Conflict of interest statement

The authors declare that they have no conflict of interest.

Figures

Fig 1
Fig 1. Production of Trim41 KO mice and fertility analysis.
(A) Schematic of TRIM41 protein structure and antigen position. (B) Model of TRIM E3 ubiquitin ligase activity. The RING domain at the N terminus interacts with E2 ubiquitin-conjugating enzyme. The C terminal portion of TRIM recognizes the substrates. (C) Phylogenetic tree constructed by ClustalW with TRIM41 sequences of various mammals. (D) RT-PCR using multi-tissue cDNA. Actb was used as a loading control. (E) RT-PCR using postnatal testis cDNA. Actb was used as a loading control. (F) RT-PCR using embryonic ovary cDNA. Actb was used as a loading control. (G) The Trim41 expression profile between testicular cells based on published single-cell RNA sequencing data, visualized by 10 x genomics Loupe Browser. UMI means Unique Molecular Identifiers. (H) The Trim41 expression profile between embryonic female germ cells based on published single-cell RNA sequencing data. (I) Targeting scheme for Trim41 disruption and a Tg construct. Black and white boxes in the gene map indicate coding and non-coding regions, respectively. Black arrowheads (Primer F1, F2, R1, R2, and R3) indicate primers used for genotyping. (J) An example of genotyping PCR with primer sets in G. (K) The result of mating tests. Pups/plug: 8.9±1.7 [Het]; 0 [KO]; 9.4±1.6 [KO-Tg] (s.d.). Error bars indicate standard deviation. The numerical data are available in S3 Table (L) Pup numbers from mating pairs of Trim41 KO females and Trim41 Het males (7.4±2.3; s.d.). Error bars indicate standard deviation. The numerical data are available in S3 Table.
Fig 2
Fig 2. Histological analysis of Trim41 KO male mice.
(A and B) Testis morphology (A) and testis/bodyweight of WT, Trim41 Het, Trim41 KO, and KO-Tg adult mice (B). Error bars indicate standard deviation. The numerical data are available in S3 Table (C) PAS staining of seminiferous tubules of adult mice. The seminiferous epithelium cycle was determined by germ cell position and nuclear morphology. Red arrows indicate elongated spermatids with abnormal head morphology. PLe: Preleptotene stage spermatocyte; ZySC: Zygotene stage spermatocyte; PaSC: Pachytene stage spermatocyte; DiSC: Diplotene stage spermatocyte; MeSC: metaphase spermatocyte; RST: round spermatid; EST: elongating/elongated spermatid. (D) TUNEL staining of seminiferous tubules of adult mice counterstained with hematoxylin. At least three male mice were analyzed. (E) The stacked bar graph of TUNEL positive cells. The seminiferous epithelial stages were roughly determined by the arrangement and nuclear morphology of the first layer of germ cells (spermatogonia and leptotene/zygotene stage spermatocytes). The numerical data are available in S3 Table (F) PAS staining of cauda epididymis of adult mice. At least three male mice were analyzed.
Fig 3
Fig 3. Cytological analysis of Trim41 KO spermatocytes.
(A and B) The spread nuclei of prophase spermatocytes collected from adult Het (A) and KO (B) male mice were immunostained with anti-SYCP3 and -γH2AX antibodies. XYs in (A) indicate the sex chromosomes encircled by γH2AX signals (i.e. XY body). White arrowheads in (B) indicate intense SYCP3 signals. At least three male mice were analyzed. (C) Additional immunostaining images of KO spermatocytes. The white arrowheads indicate the separate SYCP3 signals in autosomes. The yellow arrowhead indicates the X chromosome with two SYCP3 axes. The red arrowhead shows a tangled SYCP3 signal between the sex chromosome and autosomes (only 17 axes existed other than the tangled SYCP3 signals). (D) The percentage of pachytene stage spermatocytes exhibiting XY body malformation (red bar graph) and SYCP3 overloading (green bar graph). Blue, purple, and yellow-colored boxes show the distribution of chromosomes (i.e., sex chromosome or autosome) exhibiting SYCP3 overloading. The numerical data are available in S3 Table (E) The percentage of each meiotic prophase stage in immunostained spread nuclei samples in A and B. The numerical data is available in S3 Table (F) Immunostaining of metaphase and anaphase spermatocytes squashed from seminiferous tubules after fixation. Blue arrowheads indicate chromosomes connected with the rod-like SYCP3 structures. At least three male mice were analyzed. The numerical data are available in S3 Table (G) Giemsa staining of spread nuclei of metaphase I spermatocytes. Black arrows indicate the chromosomes with a rod-like structure. At least three male mice were analyzed. The numerical data are available in S3 Table.
Fig 4
Fig 4. Cytological analysis of Trim41 KO spermatocytes.
(A) Schematic of multicolor FISH followed by SYCP3 immunostaining. (B) Pachytene stage spermatocytes were subjected to a multicolor FISH protocol shown in A. Green FISH probe and Alexa-488 are detected by the same filter. White arrowheads indicate overloaded SYCP3 signals. (C) The histogram for the chromosome distribution of SYCP3 overloading. Forty-three well-spread cells were analyzed.
Fig 5
Fig 5. Synapsis configuration of SYCP3 overloaded axes.
(A and B) SYCP1 immunostaining of spread nuclei of prophase spermatocytes collected from adult Het (A) and KO (B) male mice. High magnified images for the sex chromosomes are shown in red, green, and blue boxes. The sex chromosomes were identified by their characteristic shape of SYCP3 axes. A white arrowhead indicates a seamless connection of SYCP1 signals between the sex chromosomes and autosomes. Blue arrowheads show SYCP1 signals remaining on the sex chromosomes until the late pachytene stage. At least three male mice were analyzed. (C and D) BRCA1 immunostaining of spread nuclei of prophase spermatocytes collected from adult Het (C) and KO (D) male mice. High magnified images for the sex chromosome were shown in red, green, and blue boxes. Yellow arrowheads indicate BRCA1 missing from the sex chromosome. Green arrowheads show BRCA1 located on autosomes. At least three male mice were analyzed. (E) Quantification data for SYCP1 staining. Red and green bar graphs indicate the percentage of early and late pachytene spermatocytes with SYCP1 signals outside of the pseudoautosomal region of sex chromosomes, respectively. The numerical data is available in S3 Table (F) Quantification data for BRCA1 staining. Red bar graph indicates the percentage of pachytene spermatocytes exhibiting uneven BRCA1 signals on the sex chromosome. Green bar graph shows the percentage of pachytene spermatocytes with BRCA1 signals on the autosomes. The numerical data are available in S3 Table.
Fig 6
Fig 6. Production and phenotypic analysis of Trim41ΔRING/ΔRING mice.
(A) Knock-in scheme for the replacement of the RING domain with the HA tag. Black and white boxes in the gene map indicate coding and non-coding regions, respectively. Black arrowheads (F3, R4, F4, and R5) and arrows (gRNA1 and gRNA2) indicate primers for genotyping and target sequence of gRNAs, respectively. (B) An example of genotyping PCR with primer sets in A (F3 and R4). (C) RT-PCR using testis cDNA and primer sets in A (F4 and R5). Actb was used as a loading control. (D and E) Immunoblotting analysis with anti-HA (D) and -TRIM41 (E) antibodies. Black and red arrows indicate TRIM41 andΔRING-TRIM41, respectively. (F) The result of mating tests. Pups/plug: 9.1±2.5 [WT]; 0 [Trim41ΔRING/ΔRING] (s.d.). Error bars indicate standard deviation. The numerical data are available in S3 Table (G and H) Testis morphology (G) and testis/bodyweight of Trim41wt/ΔRING and Trim41ΔRING/ΔRING adult mice (H). Error bars indicate standard deviation. The numerical data are available in S3 Table (I) PAS staining of seminiferous tubules of adult mice. The seminiferous epithelium cycle was determined by germ cell position and nuclear morphology. PLe: Preleptotene stage spermatocyte; ZySC: Zygotene stage spermatocyte; PaSC: Pachytene stage spermatocyte; DiSC: Diplotene stage spermatocyte; MeSC: metaphase spermatocyte; RST: round spermatid; EST: elongating/elongated spermatid. At least three male mice were analyzed. (J) TUNEL staining of seminiferous tubules of adult mice counterstained with hematoxylin. At least three male mice were analyzed. (K) The stacked bar graph of TUNEL positive cells. The seminiferous epithelial stages were roughly determined by the arrangement and nuclear morphology of the first layer of germ cells (spermatogonia and leptotene/zygotene stage spermatocytes). The numerical data are available in S3 Table (L) PAS staining of cauda epididymis of adult mice counterstained with hematoxylin. At least three male mice were analyzed.
Fig 7
Fig 7. Cytological analysis of Trim41ΔRING/ΔRING spermatocytes.
(A and B) SYCP3/γH2AX immunostaining of pachytene stage spermatocytes from Trim41wt/ΔRING (A) and Trim41ΔRING/ΔRING (B) male mice. At least three male mice were analyzed. (C–F) SYCP3/HA immunostaining of pachytene spermatocytes from Trim41wt/ΔRING (C), Trim41ΔRING/ΔRING (D), Trim41neo/ΔRING (E), and Trim41neo/neo (KO; F) male mice. White and blue arrowheads indicate HA signals on and outside of SYCP3 axes, respectively. High magnified images are shown in red, green, and blue boxes. At least three male mice were analyzed for Trim41wt/ΔRING and Trim41ΔRING/ΔRING. (G) SYCP1/HA immunostaining of surface chromosome spread from Trim41ΔRING/ΔRING testis. Magenta arrowheads indicate HA signals on the SYCP1 positive/negative boundary. High magnified images are shown in red, green, and blue boxes. At least three male mice were analyzed. (H) BRCA1/HA immunostaining of surface chromosome spread from Trim41ΔRING/ΔRING testis. Red arrowheads indicate HA signals on the BRCA1 negative part of the X chromosome axes. A high magnified image was shown in a red box. At least three male mice were analyzed.

Similar articles

Cited by

References

    1. Ozato K, Shin DM, Chang TH, Morse HC 3rd., TRIM family proteins and their emerging roles in innate immunity. Nature reviews Immunology. 2008;8(11):849–60. Epub 2008/10/07. doi: 10.1038/nri2413 ; PubMed Central PMCID: PMC3433745. - DOI - PMC - PubMed
    1. Versteeg GA, Rajsbaum R, Sánchez-Aparicio MT, Maestre AM, Valdiviezo J, Shi M, et al.. The E3-ligase TRIM family of proteins regulates signaling pathways triggered by innate immune pattern-recognition receptors. Immunity. 2013;38(2):384–98. Epub 2013/02/27. doi: 10.1016/j.immuni.2012.11.013 ; PubMed Central PMCID: PMC3584420. - DOI - PMC - PubMed
    1. Rajsbaum R, García-Sastre A, Versteeg GA. TRIMmunity: the roles of the TRIM E3-ubiquitin ligase family in innate antiviral immunity. Journal of molecular biology. 2014;426(6):1265–84. Epub 2013/12/18. doi: 10.1016/j.jmb.2013.12.005 ; PubMed Central PMCID: PMC3945521. - DOI - PMC - PubMed
    1. Hatakeyama S. TRIM Family Proteins: Roles in Autophagy, Immunity, and Carcinogenesis. Trends in biochemical sciences. 2017;42(4):297–311. Epub 2017/01/26. doi: 10.1016/j.tibs.2017.01.002 . - DOI - PubMed
    1. Zhang S, Guo JT, Wu JZ, Yang G. Identification and characterization of multiple TRIM proteins that inhibit hepatitis B virus transcription. PloS one. 2013;8(8):e70001. Epub 2013/08/13. doi: 10.1371/journal.pone.0070001 ; PubMed Central PMCID: PMC3731306 - DOI - PMC - PubMed

Publication types