. 2022 Jun;14(647):eabi8593.
doi: 10.1126/scitranslmed.abi8593. Epub 2022 Jun 1.

Reversal of synapse loss in Alzheimer mouse models by targeting mGluR5 to prevent synaptic tagging by C1Q

Affiliations

Reversal of synapse loss in Alzheimer mouse models by targeting mGluR5 to prevent synaptic tagging by C1Q

Joshua Spurrier et al. Sci Transl Med. 2022 Jun.

Abstract

Microglia-mediated synaptic loss contributes to the development of cognitive impairments in Alzheimer's disease (AD). However, the basis for this immune-mediated attack on synapses remains to be elucidated. Treatment with the metabotropic glutamate receptor 5 (mGluR5) silent allosteric modulator (SAM), BMS-984923, prevents β-amyloid oligomer-induced aberrant synaptic signaling while preserving physiological glutamate response. Here, we show that oral BMS-984923 effectively occupies brain mGluR5 sites visualized by [18F]FPEB positron emission tomography (PET) at doses shown to be safe in rodents and nonhuman primates. In aged mouse models of AD (APPswe/PS1ΔE9 overexpressing transgenic and AppNL-G-F/hMapt double knock-in), SAM treatment fully restored synaptic density as measured by [18F]SynVesT-1 PET for SV2A and by histology, and the therapeutic benefit persisted after drug washout. Phospho-TAU accumulation in double knock-in mice was also reduced by SAM treatment. Single-nuclei transcriptomics demonstrated that SAM treatment in both models normalized expression patterns to a far greater extent in neurons than glia. Last, treatment prevented synaptic localization of the complement component C1Q and synaptic engulfment in AD mice. Thus, selective modulation of mGluR5 reversed neuronal gene expression changes to protect synapses from damage by microglial mediators in rodents.


Figures

Fig. 1.
Fig. 1.. SAM receptor occupancy of mGluR5.
(A) Template MR images (top) and aligned PET images from a typical rhesus brain subject before (middle) and after intravenous dose of SAM (1 mg/kg, bottom), summed from 30 to 45 min after [18F]FPEB injection. Activity is expressed as SUVR, normalized using cerebellum. (B) Relationship between measured SAM plasma concentration and mGluR5 receptor occupancy. Fit shown is two-parameter nonlinear mixed effect (NLME) model. (C) Template MR images (top) and aligned averaged mouse brain PET images after oral dose of either vehicle (middle) or SAM (7.5 mg/kg, bottom), summed from 45 to 60 min after injection of [18F]FPEB. Activity is expressed as SUVR, normalized using cerebellum. (D) Mice were treated with increasing doses of SAM (0 to 7.5 mg/kg) or SAM enantiomer (eSAM; 7.5 to 30 mg/kg) by oral gavage 90 min before receiving PAM (20 mg/kg) by intraperitoneal injection. Graphs depict the normalized severity of seizure activity (based on Racine scale) after PAM administration.
Fig. 2.
Fig. 2.. In vivo and in vitro assessment of synaptic density in APP/PS1 mice.
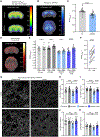
(A) Averaged baseline [18F]SynVesT-1 PET images for WT (top) and APP/PS1 (bottom) mouse brain. Activity is expressed as SUVR-1 (normalized to brain stem). (B) Voxel-wise analysis t value map comparing APP/PS1 to WT mouse brain. Color scale represents decrease in APP/PS1 compared to WT. (C) ROI-based comparison of hippocampal [18F]SynVesT-1 SUVR-1 shows synapse density in APP/PS1 compared to WT mice. (D) Voxel-wise analysis t value map comparing baseline and posttreatment synaptic density in APP/PS1 mice. Color scale represents increase in posttreatment compared to pretreatment mice. (E) ROI-based comparison of hippocampal [18F]SynVesT-1 SUVR-1 from aged WT and APP/PS1 animals at baseline (Pre) and after SAM treatment (Post).(F) Baseline (Pre) and posttreatment (Post) hippocampal [18F]SynVesT-1 SUVR-1 from SAM-treated APP/PS1 animals [seventh and eighth bars in (E)] illustrates individual changes. (G) Representative images of SV2A immunofluorescent staining of DG and CX of APP/PS1 mice after a month-long treatment washout period. Scale bar, 20 μm. Images from SV2A staining in DG and CX of WT animals and from PSD-95 in DG of WT and APP/PS1 animals are shown in fig. S2 (F to H). (H to K) Fractional area of SV2A (H and I) or PSD-95 (J and K) immunoreactive puncta from DG (H and J) or CX (I and K) of post-washout animals treated with vehicle or SAM. In (C), (E), (F), and (H) to (K), each individual mouse is shown as a single dot. In (C), data are presented as means ± SEM from n = 24 mice per group and compared by unpaired t test. In (E), data are presented as means ± SEM from n = 12 mice per group and compared by repeated-measures two-way ANOVA with Holm-Šídák’s multiple comparisons test. In (H) to (K), data are presented as means ± SEM from n = 14 to 24 mice per group and compared by one-way ANOVA with Holm-Šídák’s multiple comparisons test. **P < 0.01, ***P < 0.001, ****P < 0.0001. ns, not significant.
Fig. 3.
Fig. 3.. In vivo and in vitro assessment of synaptic density in dKI mice.
(A) Voxel-wise analysis t value map comparing synaptic density of dKI to WT mice. Color scale represents decrease in dKI compared to WT. (B) ROI-based comparison of hippocampal [18F]SynVesT-1 SUVR-1 in dKI mice compared to WT (WT values are from APP/PS1 cohort presented in Fig. 2C). (C) Voxel-wise analysis t value map comparing synaptic density pre- and posttreatment with SAM. Color scale represents increase in posttreatment compared to pretreatment mice. (D) Paired comparison of ROI-based analysis of hippocampal SUVR-1 between pretreatment and posttreatment dKI mice. (E) Representative images of PSD-95 immunofluorescent staining of DG of WT and dKI mice after treatment with vehicle or SAM. Scale bar, 20 μm. Images from SV2A staining of DG and CX and from PSD-95 staining of CX are shown in fig. S3 (A to C). (F to I) Fractional area of PSD-95 (F and G) or SV2A (H and I) immunoreactive puncta from DG (F and H) or CX (G and I) of WT and dKI animals treated with vehicle or SAM. (J) Representative images of SV2A and PSD-95 immunofluorescent costaining of CA1 of dKI mice after treatment with vehicle or SAM. Scale bar, 2 μm. (K) Quantification of synaptic loci (per cubic micrometer) in CA1 of vehicle- or SAM-treated dKI animals. In (B), (D), (F) to (I), and (K), each individual mouse is shown as single dot. In (B), data are presented as means ± SEM from n = 24 (WT) or 10 (dKI) mice per group and compared by unpaired two-tailed t test. In (D), data are compared by paired two-tailed t test. In (F) to (I), data are presented as means ± SEM from n = 21 to 34 mice per group and compared by one-way ANOVA with Holm-Šídák’s multiple comparisons test. In (K), data are presented as means ± SEM from n = 12 (dKI-veh) or 11 (dKI-SAM) mice per group and compared by unpaired t test. *P < 0.05, **P < 0.01, ****P < 0.0001. ns, not significant.
Fig. 4.
Fig. 4.. In vitro assessment of TAU pathophysiology in dKI mice.
(A) Representative images of AT8 and NEUN immunofluorescent staining of medial CX of WT and dKI mice after treatment with vehicle or SAM. Scale bar, 50 μm. (B) Representative immunoblots of AT8 amounts in cortical tris-buffered saline (TBS) fraction of WT and dKI animals treated with vehicle or SAM; actin was used as loading control. (C) Fractional area of AT8 immunoreactive puncta from medial CX of treated WT and dKI animals, from micrographs as in (A). (D) Quantification of AT8 summed from TBS and Triton X-100 fractions, normalized to actin, from immunoblots as in (B). (E) Representative images of pS396 immunofluorescent staining of medial CX of WT and dKI mice after treatment with vehicle or SAM. Scale bar, 100 μm. (F and G) Fractional area of pS396 immunoreactive puncta from medial CX (F) or hippocampal CA1 (G) of WT and dKI animals treated with vehicle or SAM. (H and I) Fractional area of pT217 immunoreactive puncta from medial CX (H) or hippocampal CA1 (I) of WT and dKI animals treated with vehicle or SAM. In (C) and (D) and (F) to (I), each individual mouse is shown as single dot. Data are presented as means ± SEM from n = 7 to 20 mice per group and compared by one-way ANOVA with Holm-Šídák’s multiple comparisons test. *P < 0.05, **P < 0.01, ****P < 0.0001. ns, not significant.
Fig. 5.
Fig. 5.. snRNA-seq shows SAM-mediated correction of expression changes in neuronal and glia cell populations from amyloidogenic and AD mouse models.
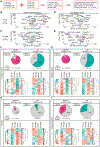
(A) Cerebral CX and HC from WT, APP/PS1, and dKI mice treated with vehicle or SAM (n = 4 mice per group) from 12 to 13 months of age were fractionated to single nuclei and processed by 10X Genomics. (B to E) Volcano plots of DEGs identified in APP/PS1 (B and C) or dKI (D and E) ExN cell populations. Plots show statistical significance (–log10, P value) versus magnitude of gene expression changes (logFC) of AD-veh (B and D) or AD-SAM (C and E) when compared to WT-vehicle–treated mice; vertical dashed line indicates 0.0 logFC, and vertical solid lines indicate +0.1 logFC. A selection of significant, AD-associated DEGs is marked in red, with gene names identified (B and D). DEGs are deemed significant if they exhibit an absolute logFC > 0.1 with P < 0.005 (Wilcoxon rank sum test). The same AD-associated DEGs are marked in green (B and D) if their absolute logFC < 0.1. For full DEG list from all cell types, refer to data file S2. (F to I) Total number of AD-associated DEGs in ExNs (F), InNs (G), microglia (H), and reactive astrocytes (I) from APP/PS1 or dKI samples. Pie charts illustrate percentage of DEGs that are fully corrected by SAM treatment (Fisher’s exact test); the size of the chart is relative to total number of DEGs. Heatmaps show single DEG expression within each cell type. Analyses of remaining cell types are included in fig. S11.
Fig. 6.
Fig. 6.. Transcriptome-wide correction by SAM treatment in neuronal and glial cell types.
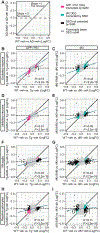
(A) Cell type-specific comparison of AD-associated DEGs and SAM-corrected DEGs in APP/PS1 and dKI samples. LogFC between WT-veh and either APP/PS1-veh or dKI-veh (AD effect) is plotted along the x axis. LogFC between vehicle- and SAM-treated APP/PS1 or dKI samples (SAM effect) is plotted along the y axis. Black points represent genes with logFC > 0.1 and P < 0.005. Colored points (pink = APP/PS1, green = dKI) represent DEGs that were corrected by SAM treatment. Points along the identity line (x = y) represent genes with equivalent differential expression between AD-SAM and WT-veh, relative to AD-veh, indicating complete rescue by SAM. Points along the line “y = 0” reflect genes unaffected by SAM. The regression line (Pearson’s correlations) represents transcriptome-wide effects of SAM treatment. Expression pattern for different cell types is provided for ExNs (B and C), InNs (D and E), microglia (F and G), and reactive astrocytes (H and I). Analyses of remaining cell types are included in fig. S12.
Fig. 7.
Fig. 7.. Synaptic localization of C1Q in amyloidogenic and AD mouse models.
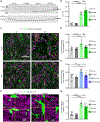
(A) Total C1Q in HC from WT and dKI animals treated with vehicle or SAM were measured by Western blotting; actin was used as loading control. (B) Quantification of immunoblot in (A). C1Q intensity was normalized to actin. Data are means ± SEM from n = 6 mice per group and compared by one-way ANOVA with Holm-Šídák’s multiple comparisons test. (C) Representative images of C1Q and PSD-95 immunofluorescent staining of DG of WT and dKI mice after treatment with vehicle or SAM imaged with Airyscan super-resolution. Scale bar, 5 μm. Yellow arrows highlight C1Q/PSD-95 colocalization. (D and E) Fractional area of PSD-95 immunoreactive puncta overlapping C1Q in DG of dKI (D) or APP/PS1 (E) animals treated with vehicle or SAM. Each individual mouse is shown as a single dot. Data are presented after measurement by Mander’s coefficient as means ± SEM from n = 6 to 10 mice per group and compared by one-way ANOVA with Holm-Šídák’s multiple comparisons test. (F) Representative orthogonal views from different planes (x/y, x/z, or y/z) of SV2A and GFAP immunofluorescent staining of CA1 of dKI mice after treatment with vehicle or SAM. Scale bar, 5 μm. (G) Fractional area of SV2A immunoreactive puncta engulfed in GFAP in CA1 of WT or dKI animals treated with vehicle or SAM. Each individual mouse is shown as a single dot. Data are presented as means ± SEM from n = 8 to 10 mice per group and compared by one-way ANOVA with Holm-Šídák’s multiple comparisons test. *P < 0.05, **P < 0.01, ****P < 0.0001.

Comment in

  • Restoring synapses in AD models.
    Wood H. Wood H. Nat Rev Neurol. 2022 Aug;18(8):453. doi: 10.1038/s41582-022-00691-0. Nat Rev Neurol. 2022. PMID: 35725818 No abstract available.

References

    1. Jack CR Jr., Bennett DA, Blennow K, Carrillo MC, Dunn B, Haeberlein SB, Holtzman DM, Jagust W, Jessen F, Karlawish J, Liu E, Molinuevo JL, Montine T, Phelps C, Rankin KP, Rowe CC, Scheltens P, Siemers E, Snyder HM, Sperling R, NIA-AA Research Framework: Toward a biological definition of Alzheimer's disease. Alzheimers Dement. 14, 535–562 (2018). - PMC - PubMed
    1. Long JM, Holtzman DM, Alzheimer disease: An update on pathobiology and treatment strategies. Cell 179, 312–339 (2019). - PMC - PubMed
    1. De Strooper B, Karran E, The cellular phase of Alzheimer's disease. Cell 164, 603–615 (2016). - PubMed
    1. Pimenova AA, Raj T, Goate AM, Untangling genetic risk for Alzheimer's disease. Biol. Psychiatry 83, 300–310 (2018). - PMC - PubMed
    1. McDade E, Wang G, Gordon BA, Hassenstab J, Benzinger TLS, Buckles V, Fagan AM, Holtzman DM, Cairns NJ, Goate AM, Marcus DS, Morris JC, Paumier K, Xiong C, Allegri R, Berman SB, Klunk W, Noble J, Ringman J, Ghetti B, Farlow M, Sperling RA, Chhatwal J, Salloway S, Graff-Radford NR, Schofield PR, Masters C, Rossor MN, Fox NC, Levin J, Jucker M, Bateman RJ; Dominantly Inherited Alzheimer Network, Longitudinal cognitive and biomarker changes in dominantly inherited Alzheimer disease. Neurology 91, e1295–e1306 (2018). - PMC - PubMed

Publication types

MeSH terms

Substances