. 2022 May 31;39(9):110900.
doi: 10.1016/j.celrep.2022.110900.

Synergistic autoinhibition and activation mechanisms control kinesin-1 motor activity

Affiliations

Synergistic autoinhibition and activation mechanisms control kinesin-1 motor activity

Kyoko Chiba et al. Cell Rep. .

Erratum in

Abstract

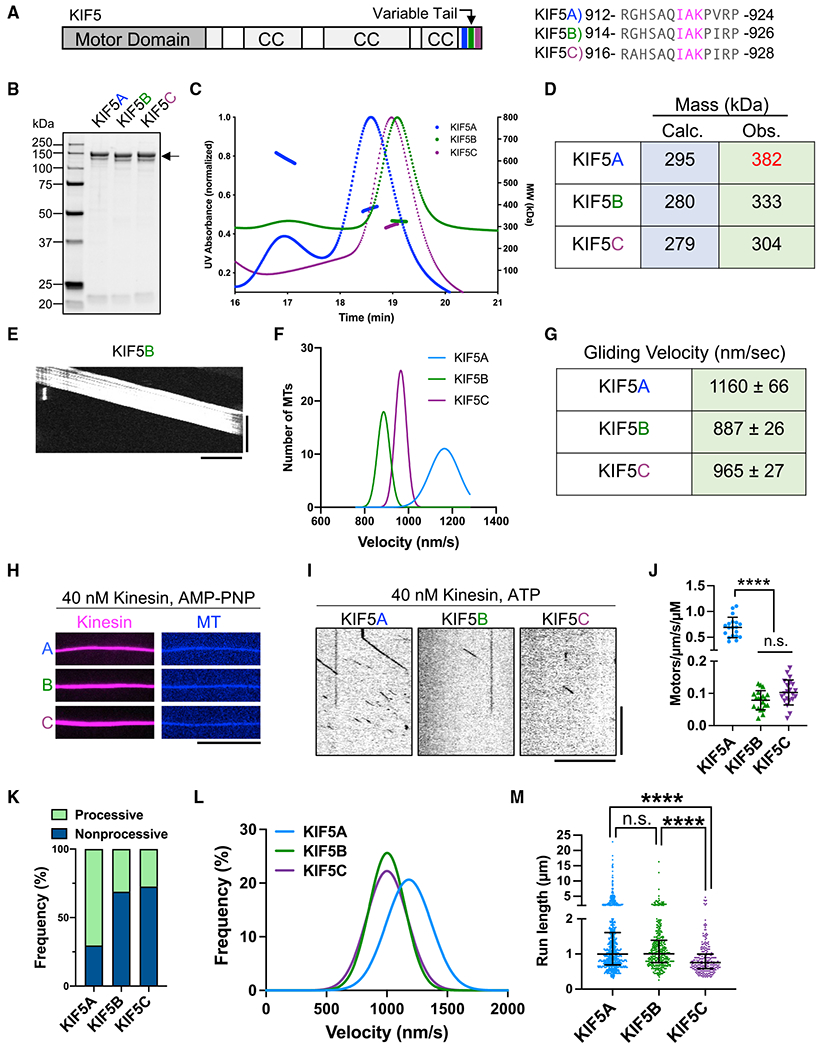
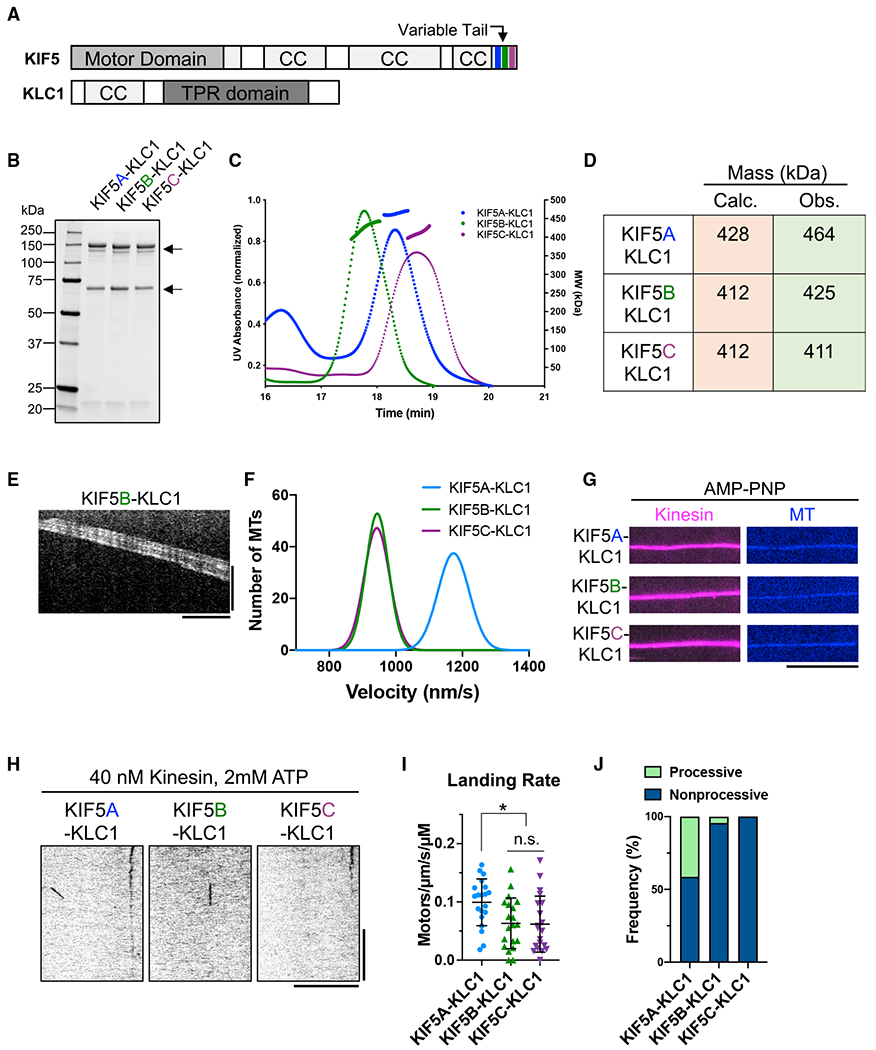
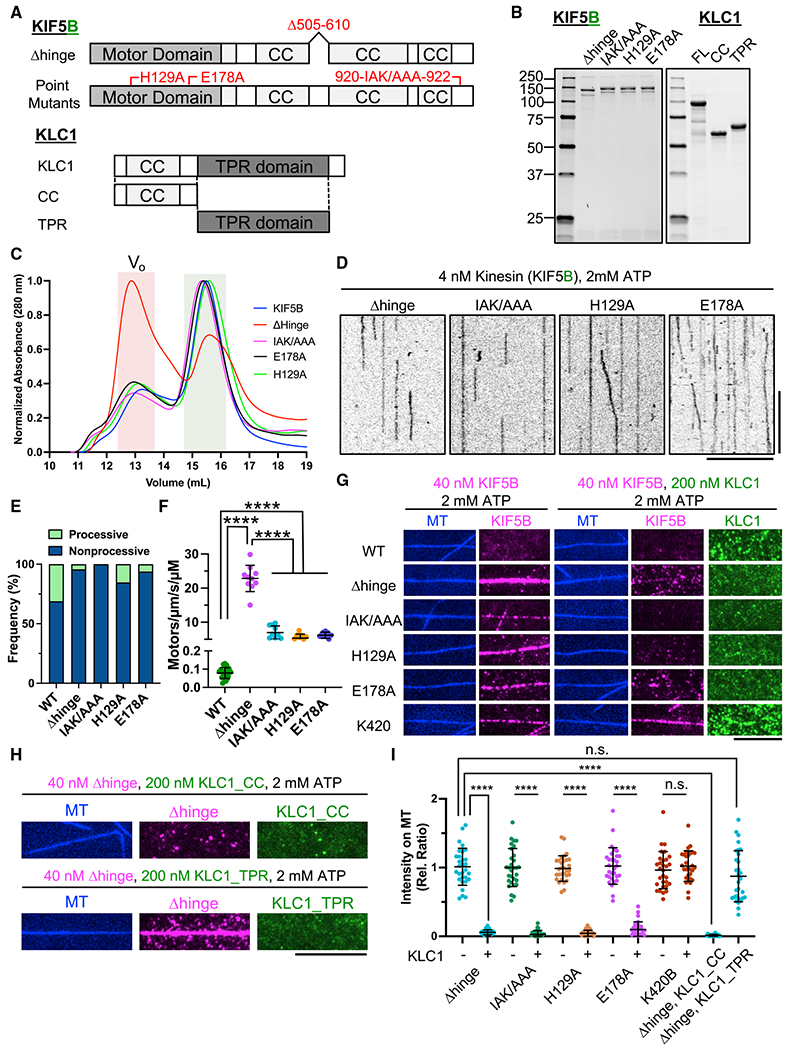
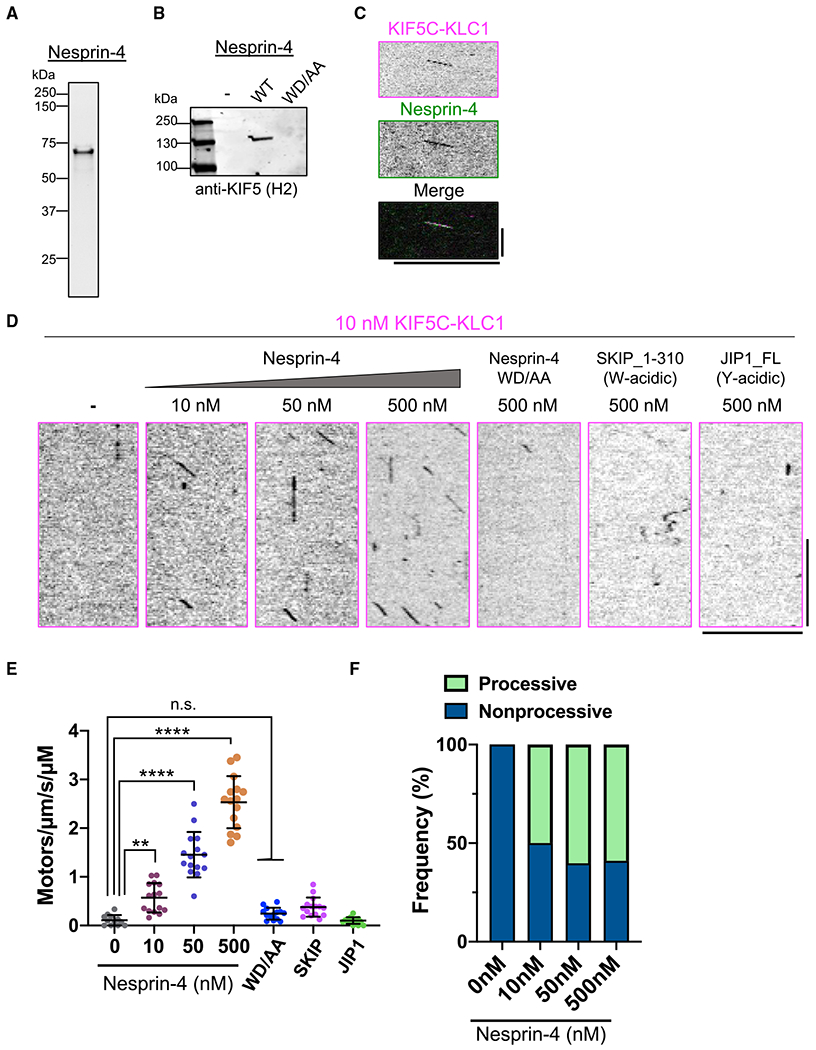
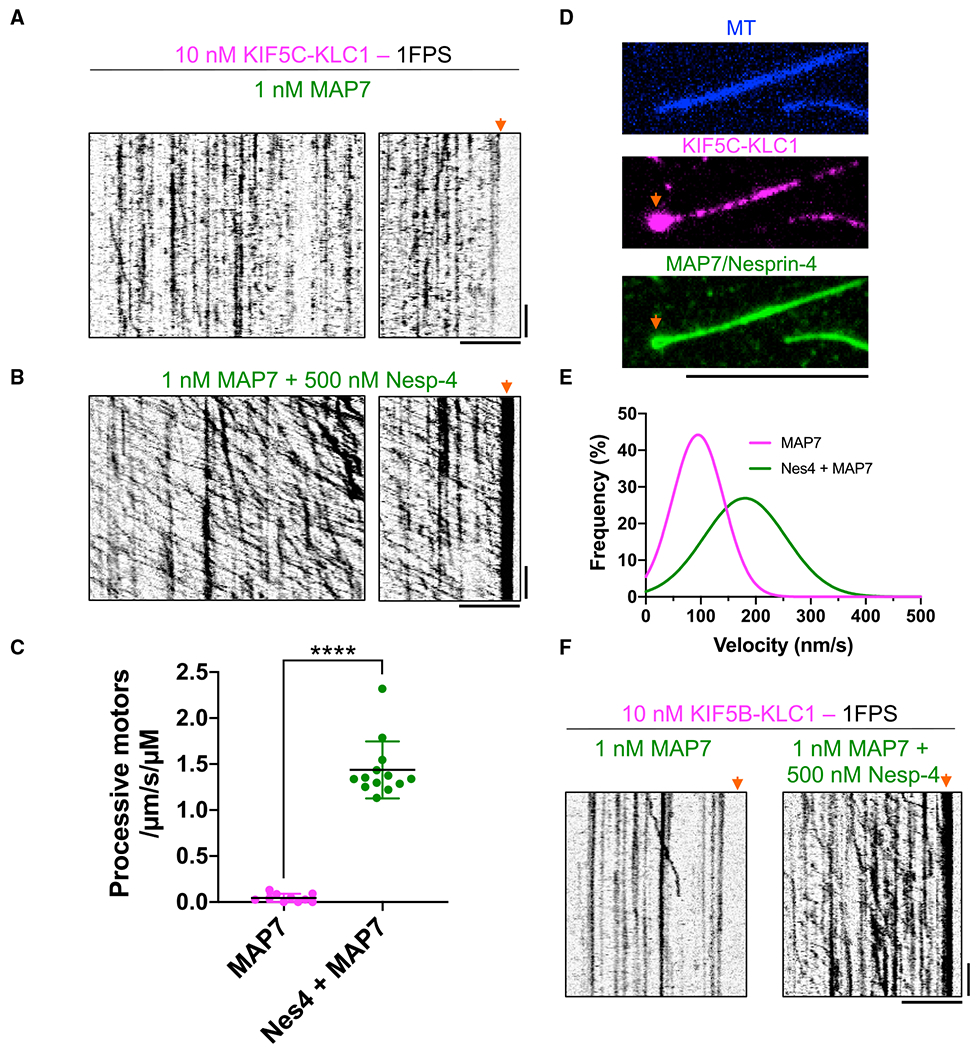
Kinesin-1 activity is regulated by autoinhibition. Intramolecular interactions within the kinesin heavy chain (KHC) are proposed to be one facet of motor regulation. The KHC also binds to the kinesin light chain (KLC), which has been implicated in both autoinhibition and activation of the motor. We show that the KLC inhibits the kinesin-microtubule interaction independently from the proposed intramolecular interaction within KHC. Cargo-adaptor proteins that bind the KLC stimulated processive movement, but the landing rate of activated kinesin complexes remained low. Mitogen-activated protein 7 (MAP7) enhanced motility by increasing the landing rate and run length of the activated kinesin motors. Our results support a model whereby the motor activity of the kinesin is regulated by synergistic inhibition mechanisms and that cargo-adaptor binding to the KLC releases both mechanisms. However, a non-motor MAP is required for robust microtubule association of the activated motor. Thus, human kinesin is regulated by synergistic autoinhibition and activation mechanisms.

Keywords: CP: Molecular biology; dynein; kinesin; microtubule; motor protein.


Conflict of interest statement

Declaration of interests The authors declare no competing interests.

Figures

Figure 1.
Figure 1.. Characterization of full-length human KIF5 isotypes
(A) Schematic of full-length KIF5 and alignment of the conserved IAK motif (magenta). CC, coiled coil. (B) Coomassie-blue-stained gel showing purified KIF5s (arrow). (C) Chromatogram and MALS fitting of KIF5A (blue), KIF5B (green), and KIF5C (purple). Normalized UV absorbance (dotted lines) and molar masses are plotted. (D) Table summarizing the calculated and the observed masses for each motor. (E) Kymograph of MT gliding with KIF5B. Scale bars: 20 s (vertical) and 5 μm (horizontal). (F) Gaussian fits of the KIF5 velocities from the gliding assay: 1,160 ± 66 (KIF5A), 887 ± 26 (KIF5B), and 965 ± 27 (KIF5C) nm/s; mean ± SD. N = 2; n = 90, 70, and 90 MTs. (G) Table summarizing the average gliding velocities of KIF5A-C. (H) TIRF images of KIF5A–C motors (magenta) bound to MTs (blue) in the presence of AMP-PNP. Scale bar: 10 μm. (I) Kymographs of KIF5A–C motors moving along MTs in the presence of ATP. Scale bars: 10 s (vertical) and 10 μm (horizontal). (J) Landing rates of KIF5A–C. Lines show mean ± SD: 0.69 ± 0.20 (KIF5A), 0.08 ± 0.03 (KIF5B), and 0.10 ± 0.04 (KIF5C)/μm/s/μM. N = 2; n = 19, 20, and 21 MTs. One-way ANOVA followed by Tukey’s multiple comparison test. ****adjusted p < 0.0001; ns, not significant. (K) Frequency of processive and non-processive (static or diffusive) events. Processive runs: 70%(KIF5A), 31% (KIF5B), and 27% (KIF5C). N = 2; n = 1,165, 1,209, and 901 molecules. (L) Gaussian fits of KIF5 velocities from single-molecule assay: 1,182 ± 187 (KIF5A), 1,002 ± 149 (KIF5B), and 1,001 ± 170 (KIF5C) nm/s; mean ± SD. N = 2; n = 820, 376, and 247 molecules. (M) Scatterplots showing the run length of KIF5A–C. Lines show median with quartile: 1.00 (0.69–1.61) μm (KIF5A), 1.00 (0.76–1.39) μm (KIF5B), and 0.76 (0.59–1.00) μm (KIF5C). Kruskal-Wallis test followed by Dunn’s multiple comparison test. ****adjusted p < 0.0001. See also Figure S2C and Table 1.
Figure 2.
Figure 2.. Characterization of the human KIF5-KLC heterotetramers
(A) Schematic of full-length KIF5 and KLC1. (B) Coomassie-blue-stained gel showing purified heterotetramers (arrows). (C) Chromatogram and MALS fitting of KIF5A-KLC1 (blue), KIF5B-KLC1 (green), and KIF5C-KLC1 (purple). Normalized UV absorbance (dotted lines) and molar masses are plotted. (D) Table summarizing the calculated theoretical and the observed masses for each motor. (E) Kymograph of MT gliding with KIF5B-KLC1. Scale bars: 20 s (vertical) and 5 μm (horizontal). (F) Gaussian fits of the velocity histograms for KIF5A-KLC1 (blue), KIF5B-KLC1 (green), and KIF5C-KLC1 (purple) from the MT gliding assay: 1176 ± 47 (KIF5A-KLC1), 943 ± 33 (KIF5B-KLC1), and 944 ± 36 (KIF5C-KLC1) nm/s; mean ± SD. N = 2; n = 90 MTs, respectively. (G) TIRF images of KIF5-KLC1 (magenta) on MTs (blue) in the presence of AMP-PNP. Scale bar: 10 μm. (H) Kymographs of KIF5-KLC1 on MTs in the presence of ATP. Scale bars: 10 s (vertical) and 10 μm (horizontal). (I) Landing rates of KIF5-KLC1. Lines show mean ± SD: 0.10 ± 0.04 (KIF5A-KLC1), 0.06 ± 0.04 (KIF5B-KLC1), and 0.06 ± 0.05 (KIF5C-KLC1)/μm/s/μM. N = 2; n = 20 MTs, respectively. One-way ANOVA followed by Tukey’s multiple comparison test. *adjusted p < 0.05. (J) Frequency of processive and non-processive (static or diffusive) events. Processive runs: 41% (KIF5A-KLC1), 4% (KIF5B-KLC1), and 0% (KIF5C-KLC1). n = 290, 91, and 89 molecules. See also Table 1.
Figure 3.
Figure 3.. The KLC inhibits KIF5 independently of the tail-inhibition mechanism
(A) Schematic of KIF5B-Δhinge, IAK/AAA, H129A, and E178A mutants and KLC1 and fragments used. KIF5B-Δhinge lacks amino acids (aas) 505–610. KLC1-CC or KLC1-TPR comprises aas 1–200 or aas 201–500 of KLC1. (B) Coomassie-blue-stained gel showing purified KIF5-mScarlet mutants and sfGFP-KLC1. (C) Normalized SEC chromatogram showing all KIF5B mutants and the wild-type (WT) protein. Red shade: void volume (Vo) of the column; green shade: fractions of motors used for TIRF assays. (D) Kymographs of KIF5 mutants (in the absence of KLC) on MTs in the presence of ATP. Scale bars: 10 s (vertical) and 10 μm (horizontal). (E) Frequency of processive and non-processive (static or diffusive) events. Processive runs: 31% (WT), 4% (KIF5B-Δhinge), 0% (KIF5B-IAK/AAA), 15% (KIF5B-H129A), and 6% (KIF5B-E178A). N = 2; n = 20 MTs; n = 280, 325, 367, and 645 molecules. Data for KIF5B-WT are replotted from Figure 1K. (F) Landing rates of KIF5 mutants. Lines show mean ± SD: 0.08 ± 0.03 (KIF5B-WT; data are replotted from Figure 1J), 22.8 ± 3.8 (KIF5B-Δhinge), 7.0 ± 2.0 (KIF5B-IAK/AAA), 5.4 ± 1.2 (KIF5B-H129A), and 6.2 ± 0.9 (KIF5B-E178A)/μm/s/μM. N = 2; n = 20 MTs, respectively. One-way ANOVA followed by Tukey’s multiple comparison test. ****adjusted p < 0.0001. (G) TIRF images of 40 nM KIF5B (magenta) on MTs (blue) with or without 200 nM recombinant full-length KLC1 (green) in the presence of ATP. Scale bar: 10 μm. (H) TIRF images of 40 nM KIF5B-Δhinge (magenta) on MTs (blue) with 200 nM recombinant KLC1 (KLC1-CC or KLC1-TPR) in the presence of ATP. Scale bar: 10 μm. (I) Relative fluorescence intensity showing the effect of KLC1 on MT binding of KIF5B shown in G and H. Lines: mean ± SD. N = 2; n = 30 MTs. A two-tailed unpaired Student’s t test (KIF5B-IAK/AAA, KIF5B-H129A, KIF5B-E178A, and K420B in the presence or absence of KLC1) or one-way ANOVA followed by Tukey’s multiple comparison test (KIF5B-Δhinge alone and KIF5B-Δhinge with KLC1, KLC1_CC, and KLC1_TPR). ****p < 0.0001.
Figure 4.
Figure 4.. Nesprin-4 activates the autoinhibited KIF5-KLC heterotetramer
(A) Coomassie-blue-stained gel showing purified sfGFP-tagged cytosolic domain of nesprin-4. (B) Immunoblot showing that KIF5 is coprecipitated with recombinant nesprin-4, but not its WD/AA mutant from brain lysate. (C) Kymograph showing co-movement of KIF5C-KLC1-mScarlet (magenta) with sfGFP-nesprin-4 (green) on MTs in the presence of ATP. Ten nanomolars of each protein was used. Individual fluorescent channels (top and middle) and the merged channel (bottom) are shown. Scale bars: 10 s (vertical) and 10 μm (horizontal). (D) Kymographs showing the motility of KIF5C-KLC1 mixed with indicated proteins in the presence of ATP. Scale bars: 10 s (vertical) and 10 μm (horizontal). (E) Landing rates of KIF5-KLC1. Lines show mean ± SD: 0.1 ± 0.1 (note, data for 10 nM KIF5C-KLC1 are replotted from Figure 2I), 0.6 ± 0.3 (10 nM KIF5C-KLC1 + 10 nM nesprin-4), 1.5 ± 0.5 (10 nM KIF5C-KLC1 + 50 nM nesprin-4), 2.5 ± 0.5 (10 nM KIF5C-KLC1 + 500 nM nesprin-4), 0.2 ± 0.1 (10 nM KIF5C-KLC1 + 500 nM nesprin-4_WDAA), 0.4 ± 0.2 (10 nM KIF5C-KLC1 + 500 nM SKIP_1–310), 0.1 ± 0.1 (10 nM KIF5C-KLC1 + 500 nM JIP1)/μm/s/μM. N = 2; n = 12, 15, 15, 15, 14, 15, and 15 MTs. One-way ANOVA followed by Dunnett’s multiple comparison test. **adjusted p < 0.01; ****adjusted p < 0.0001. (F) Frequency of processive and non-processive (static or diffusive) events. Processive runs: 0%, 24%, 50%, and 60% for 10 nM KIF5C-KLC1 with 0, 10, 50, and 500 nM nesprin-4, respectively. n = 89, 17, 112, and 221 molecules. Data for 0 nM nesprin-4 are replotted from Figure 2J.
Figure 5.
Figure 5.. Synergistic activation of kinesin heterotetramers by nesprin-4 and MAP7
(A) Kymographs of KIF5C-KLC1 on MAP7-coated MTs. Note the lack of processive movement. Arrow highlights no accumulation of motors at the MT ends. Scale bars: 30 s (vertical) and 5 μm (horizontal). (B) Kymographs of KIF5C-KLC1 on MAP7-coated MTs in the presence of nesprin-4. Note the highly processive movement. Arrow highlights strong accumulation of processive motors at one end of the MT. Scale bars: 30 s (vertical) and 5 μm (horizontal). (C) Landing rates of processive KIF5C-KLC1 motors in the absence or presence of MAP7. Only processive molecules were counted in this analysis. Lines: mean ± SD: 0.045 ± 0.045 (KIF5C-KLC1 with MAP7) and 1.4 ± 0.31 (KIF5C-KLC1 with MAP7 and nesprin-4)/μm/s/μM. N = 2; n = 10 or 13 MTs. A two-tailed Student’s t test. ****p < 0.0001. (D) TIRF images of KIF5C-KLC1 (magenta, middle) accumulation at one MT end (arrows) in the presence of MAP7 and nesprin-4 (both green, bottom). Note nesprin-4 accumulation at the MT end is presumably nesprin-4 transported there by kinesin. Scale bar: 10 μm. (E) Gaussian fits of KIF5C-KLC1 velocities distributions in the presence of MAP7 or MAP7 + nesprin-4. Mean ± SD: 95 ± 47 nm/s (MAP7, magenta) and 180 ± 75 nm/s (MAP7 + nesprin-4, green). N = 2; n = 21 or 706 molecules. (F) Kymographs of KIF5B-KLC1 on MAP7-coated MTs with (right) or without (left) nesprin-4. Arrows indicate MT ends. Note accumulation of processive motors at MT ends only in the presence of MAP7 and nesprin-4. Scale bars: 30 s (vertical) and 5 μm (horizontal).

Similar articles

Cited by

References

    1. Blasius TL, Cai D, Jih GT, Toret CP, and Verhey KJ (2007). Two binding partners cooperate to activate the molecular motor Kinesin-1. J. Cell Biol 176, 11–17. 10.1083/jcb.200605099. - DOI - PMC - PubMed
    1. Cai D, Hoppe AD, Swanson JA, and Verhey KJ (2007). Kinesin-1 structural organization and conformational changes revealed by FRET stoichiometry in live cells. J. Cell Biol 176, 51–63. 10.1083/jcb.200605097. - DOI - PMC - PubMed
    1. Carter AP, Garbarino JE, Wilson-Kubalek EM, Shipley WE, Cho C, Milligan RA, Vale RD, and Gibbons IR (2008). Structure and functional role of dynein’s microtubule-binding domain. Science 322, 1691–1695. 10.1126/science.1164424. - DOI - PMC - PubMed
    1. Coy DL, Hancock WO, Wagenbach M, and Howard J (1999). Kinesin’s tail domain is an inhibitory regulator of the motor domain. Nat. Cell Biol 1, 288–292. 10.1038/13001. - DOI - PubMed
    1. Crimella C, Baschirotto C, Arnoldi A, Tonelli A, Tenderini E, Airoldi G, Martinuzzi A, Trabacca A, Losito L, Scarlato M, et al. (2012). Mutations in the motor and stalk domains of KIF5A in spastic paraplegia type 10 and in axonal Charcot-Marie-Tooth type 2. Clin. Genet 82, 157–164. 10.1111/j.1399-0004.2011.01717.x. - DOI - PubMed

Publication types