. 2022 May 31;39(9):110878.
doi: 10.1016/j.celrep.2022.110878.

Sequential transmission of task-relevant information in cortical neuronal networks

Affiliations

Sequential transmission of task-relevant information in cortical neuronal networks

Nikolas A Francis et al. Cell Rep. .

Abstract

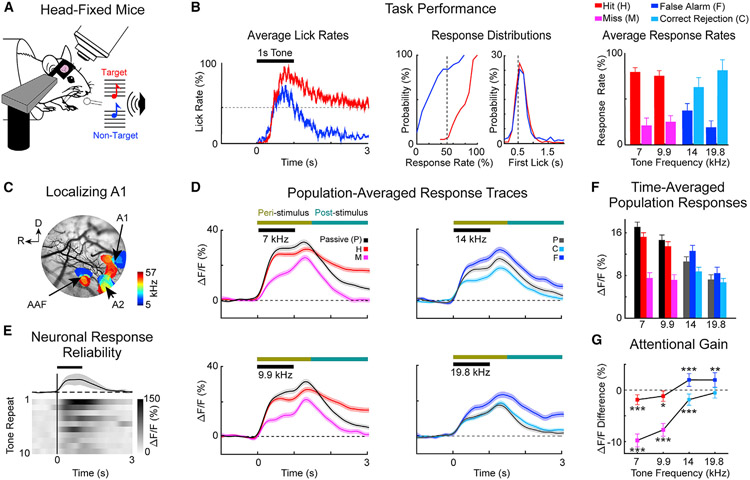
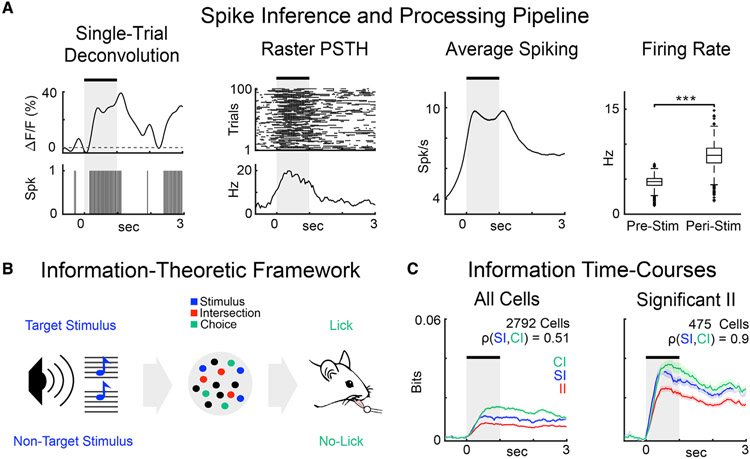
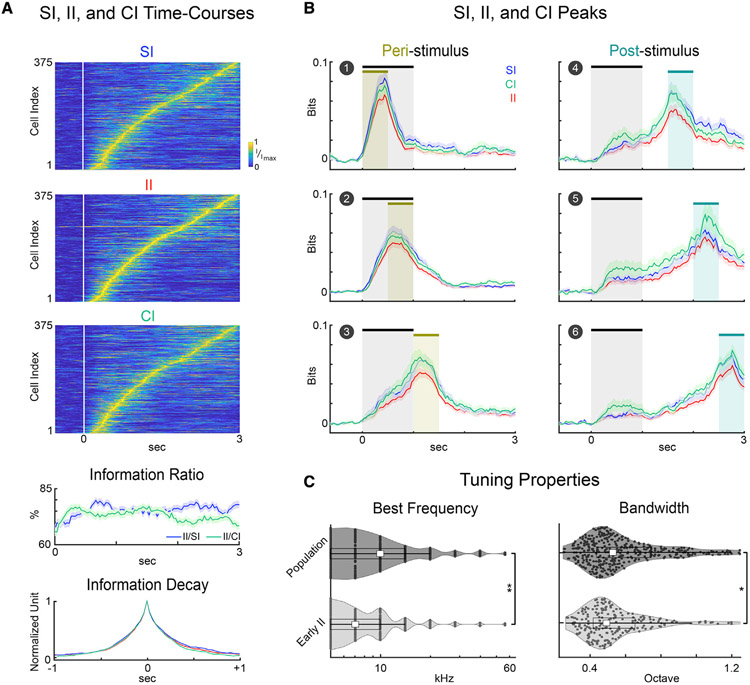
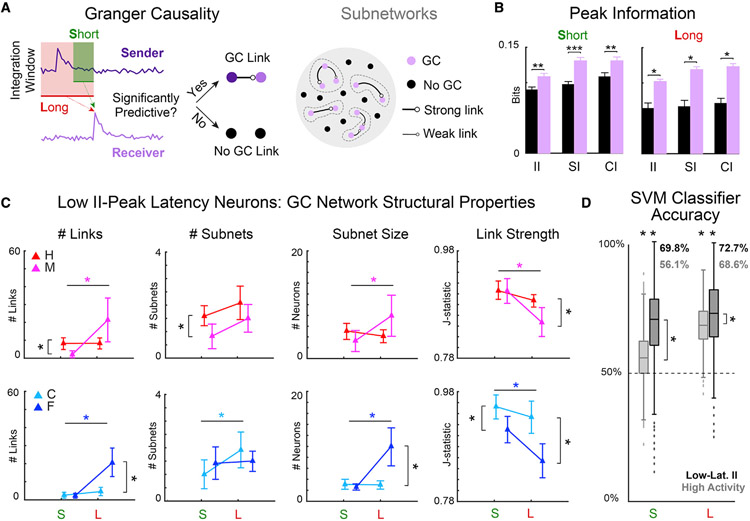
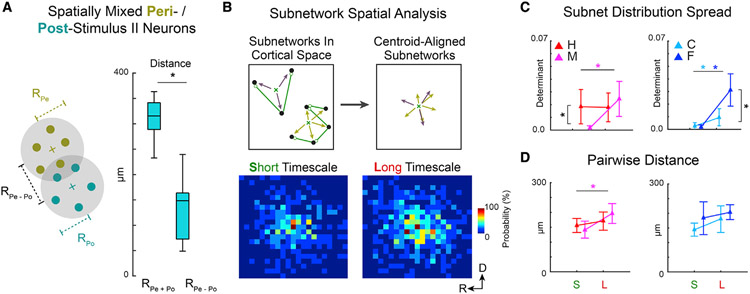
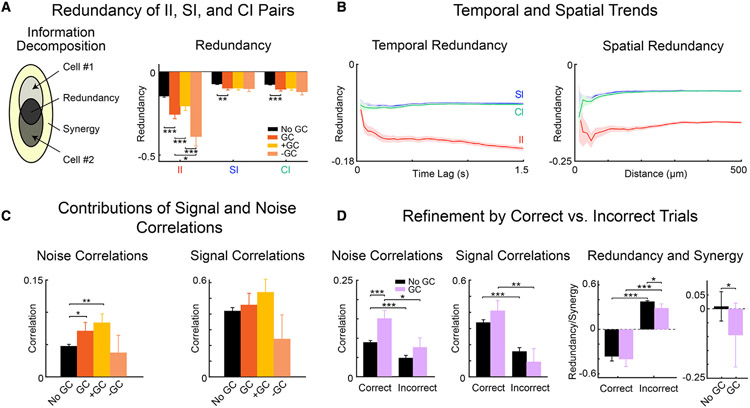
Cortical processing of task-relevant information enables recognition of behaviorally meaningful sensory events. It is unclear how task-related information is represented within cortical networks by the activity of individual neurons and their functional interactions. Here, we use two-photon imaging to record neuronal activity from the primary auditory cortex of mice during a pure-tone discrimination task. We find that a subset of neurons transiently encode sensory information used to inform behavioral choice. Using Granger causality analysis, we show that these neurons form functional networks in which information transmits sequentially. Network structures differ for target versus non-target tones, encode behavioral choice, and differ between correct versus incorrect behavioral choices. Correct behavioral choices are associated with shorter communication timescales, larger functional correlations, and greater information redundancy. In summary, specialized neurons in primary auditory cortex integrate task-related information and form functional networks whose structures encode both sensory input and behavioral choice.

Keywords: CP: Neuroscience; Granger causality; auditory cortex; behavior; imaging; information; mouse; networks; noise correlations; short-term memory; two-photon.


Conflict of interest statement

Declaration of interests The authors declare no competing interests.

Figures

Figure 1.
Figure 1.. Two-photon imaging in awake-behaving mice shows neural responses modulated by behavioral choice
(A) Head-fixed mice were trained to discriminate low-frequency target tones (red) versus high-frequency non-target tones (blue). (B) Average lick rates within a trial during task performance (left panel). The horizontal black bar shows the tone presentation. The red trace and blue traces show the lick rate for hits (H) and false alarms (F), respectively. The dotted line illustrates chance performance, where licking is not timed to tone presentation, but rather it is evenly distributed across a given trial. Cumulative distribution functions across experiments for hit (red) and false alarm (blue) response rates and latencies (middle panels). Average behavioral choice rates, i.e., hit (red), miss (pink), false alarm (blue), and correct rejection (cyan), for each presented tone (right panel). Error bars show 2 SEM (n = 34 experiments). (C) Primary auditory cortex (A1) was localized within a craniotomy by using widefield imaging to visualize tonotopy in auditory cortex. (D) Average neuronal population response traces in A1 layer 2/3 (L2/3) (n = 2,792 neurons) color coded for behavioral choice as in (B). Each trace shows the response to the indicated tone. Shading shows 2 SEM. The horizontal colored bars show the peri- and post-stimulus windows, respectively, used for later analyses. (E) Neurons in A1 L2/3 responded transiently, with jittered amplitude and timing in response to repeated identical tones. (F) Neuronal response amplitude varied with both task performance and tone frequency. Error bars show 2 SEM. (G) Attentional gain was defined as the difference between neural responses during behavioral versus passive trials for the same tone. Error bars show 2 SEM, and asterisks indicate statistically significant differences based on bootstrap t test (*p < 0.05, **p < 0.01, ***p < 0.001).
Figure 2.
Figure 2.. Processing pipeline and information-theoretic framework
(A) Examples of deconvolution of the ΔF/F response traces (first panel); trial-by-trial spiking activity and peri-stimulus time histogram for a single neuron (second panel); average firing rate across neurons is higher in the post-stimulus interval than pre-stimulus (rightmost panel; p < 0.001, Wilcoxon rank-sum test). (B) Stimulus encoding and behavioral readout during auditory task performance. Blue, green, and red circles, respectively, represent neurons with stimulus information (SI) only, choice information (CI) only, and intersection information (II). II accounts for the part of sensory and choice information used to perform the task. (C) Time courses of information types (SI, CI, and II) in different groups of neurons. Solid lines represent the mean and shaded areas represent the SEM across all neurons in each group.
Figure 3.
Figure 3.. A1 L2/3 neurons transiently carried SI, CI, and II
(A) Information time courses were normalized to the peak of each neuron’s information and sorted by peak time of II. Information ratio was first computed for each neuron and then averaged across neurons. Transiency of SI, CI, and II shown by the peak-aligned information decay within ±1 s from the peak (bottom panel). Error bars show 1 SEM. (B) Time course of SI, CI, and II averaged over neurons. We quantified the SI, CI, and II in six separate stages of the behavioral task, which account for the peri-stimulus (0–1.5 s) and the post-stimulus intervals (1.5–3 s) shown by the shaded regions. Error bars show 1 SEM. (C) Violin plots of the estimated best frequency (BF) (left) and tuning bandwidth (BW) (right) of neurons with early II versus overall population. Early II neurons had significantly lower BFs (p < 0.01, Wilcoxon rank-sum test) and narrower BWs (p < 0.05, Wilcoxon rank-sum test) compared with the overall population.
Figure 4.
Figure 4.. Behavioral choice was encoded in the network structure of low II-peak latency neurons
(A) Functional networks of short (S)- and long (L)-timescale interactions among low II-peak latency neurons were estimated using Granger causality (GC) analysis for each behavioral choice: hit (H), miss (M), correct rejection (C), and false alarm (F). Disjoint sets of interlinked neurons constituted subnetworks (dashed gray boundaries). (B) GC-linked neurons, for both S- and L-timescales, had more information than GC-unlinked neurons (*p < 0.05, **p < 0.01, ***p < 0.001). (C) Four GC network statistics were analyzed: number of links, number of subnetworks, size of subnetworks, and statistical strength of links. Error bars show 2 SEM. Statistically significant differences, indicated by asterisks, were identified by Wilcoxon’s signed rank test (p < 0.05). See also Table S1. (D) Network statistics were used to train a support vector machine (SVM) to classify behavioral responses into correct or incorrect decisions. Across timescale and selection of neurons, decisions were predicted significantly better than chance (p < 0.001). S-timescale network structure of low II-peak latency neurons was better decoded than highly responsive neurons (p < 0.001). L-timescale network structures had high decoding accuracy, but low II-peak latency networks were better decoded than highly responsive neurons (p < 0.001). Two-sample t tests (p < 0.05) were used to compare distributions and a one-sample t test (p < 0.05) to compare with chance performance.
Figure 5.
Figure 5.. Subnetwork dispersion varied less by timescale during correct behavioral choices
(A) Neurons with peri- (Pe) and post-stimulus (Po) II peaks were spatially intermingled. The sum of average distances of Pe neurons to their centroid (RPe) and of Po neurons to theirs (RPo), denoted as RPe + Po, was smaller than the distance between centroids (RPe − Po) (p < 0.001, two-sample t test). (B) Subnetwork spatial distributions. Low II-peak latency neurons (black) that are linked (green) in groups isolated from others constitute subnetworks (top left). Relative locations of subnetworked neurons were aggregated over all subnetworks (top right). The distributions of relative locations are shown as 2D histograms (25 × 25 μm bins) for S- and L-timescales (bottom left and right). (C) Determinant of spatial distribution covariance matrix. L-timescale C, M, and F subnetworks were more spatially dispersed than S-timescale subnetworks (M: p < 0.001; F: p = 0.002; C: p = 0.014). For S-timescales, H versus M subnetworks were more dispersed (p = 0.002), as were F versus C subnetworks for L-timescales (p = 0.003). (D) Pairwise distances between linked neurons remained similar for S- versus L-timescales, except for M trials (p = 0.047). (C) and (D) show mean ±2 SEM. Asterisks indicate statistically significant differences based on Wilcoxon’s signed rank test (p < 0.05).
Figure 6.
Figure 6.. Redundancy and correlations increase during correct behavioral choice
(A) Left panel: decomposition of joint information of pairs of neurons into synergistic, cell-unique, and redundant components. Right panel: normalized time-lagged redundancy computed for GC-linked neurons (red), either positive (orange) or negative (salmon), and GC-unlinked pairs of neurons (black). GC-linked neurons carried more redundant information than GC-unlinked neurons (II, SI, CI). Pairs of neurons connected with negative GC links carried more redundant information related to II. (B) Normalized redundancy across time-lagged neuronal activity (left panel), and versus the Euclidean distance (right panel) between pairs of both GC-linked and GC-unlinked neurons. (C) Pairwise time-lagged signal and noise correlations between pairs of neurons at the peak of intersection information. Noise correlations were higher in GC-linked than GC-unlinked neurons, while signal correlations are distributed similarly. (D) Noise and signal correlations in correct versus incorrect trials (two leftmost panels); normalized time-lagged redundancy in correct versus incorrect trials (center-right panel); difference between the redundancy in correct versus incorrect trials for GC-linked and GC-unlinked neurons (rightmost panel). Statistical comparisons were made with a two-sample t test (*p < 0.05, **p < 0.01, ***p < 0.001).

References

    1. Alonso J-M, Usrey WM, and Reid RC (1996). Precisely correlated firing in cells of the lateral geniculate nucleus. Nature 383, 815–819. 10.1038/383815a0. - DOI - PubMed
    1. Atencio CA, and Schreiner CE (2010). Columnar connectivity and laminar processing in cat primary auditory cortex. PLoS One 5, e9521. 10.1371/journal.pone.0009521. - DOI - PMC - PubMed
    1. Attneave F (1954). Some informational aspects ofvisual perception. Psychol. Rev 61, 183–193. 10.1037/h0054663. - DOI - PubMed
    1. Atzori M, Lei S, Evans DIP, Kanold PO, Phillips-Tansey E, Mcintyre O, and Mcbain CJ (2001). Differential synaptic processing separates stationary from transient inputs to the auditory cortex. Nat. Neurosci 4, 1230–1237. 10.1038/nn760. - DOI - PubMed
    1. Bagur S, Averseng M, Elgueda D, David S, Fritz J, Yin P, Shamma S, Boubenec Y, and Ostojic S (2018). Go/No-Go task engagement enhances population representation of target stimuli in primary auditory cortex. Nat. Commun 3, 2529. 10.1038/s41467-018-04839-9. - DOI - PMC - PubMed

Publication types

LinkOut - more resources