. 2022 Jul 18;23(4):bbac202.
doi: 10.1093/bib/bbac202.

KLFDAPC: a supervised machine learning approach for spatial genetic structure analysis

Affiliations

KLFDAPC: a supervised machine learning approach for spatial genetic structure analysis

Xinghu Qin et al. Brief Bioinform. .

Abstract

Geographic patterns of human genetic variation provide important insights into human evolution and disease. A commonly used tool to detect and describe them is principal component analysis (PCA) or the supervised linear discriminant analysis of principal components (DAPC). However, genetic features produced from both approaches could fail to correctly characterize population structure for complex scenarios involving admixture. In this study, we introduce Kernel Local Fisher Discriminant Analysis of Principal Components (KLFDAPC), a supervised non-linear approach for inferring individual geographic genetic structure that could rectify the limitations of these approaches by preserving the multimodal space of samples. We tested the power of KLFDAPC to infer population structure and to predict individual geographic origin using neural networks. Simulation results showed that KLFDAPC has higher discriminatory power than PCA and DAPC. The application of our method to empirical European and East Asian genome-wide genetic datasets indicated that the first two reduced features of KLFDAPC correctly recapitulated the geography of individuals and significantly improved the accuracy of predicting individual geographic origin when compared to PCA and DAPC. Therefore, KLFDAPC can be useful for geographic ancestry inference, design of genome scans and correction for spatial stratification in GWAS that link genes to adaptation or disease susceptibility.

Keywords: individual geographic origin; machine learning; population structure.


Figures

Figure 1
Figure 1
A neural network model for assigning individual membership and predicting the individual geographic coordinates. This framework is based on training a supervised neural network on the reduced genetic features from a dimensionality reduction technique (such as PCA, DAPC and KLFDAPC) given population labels or individual geographic coordinates. The reduced feature matrix (nd, n is sample size and d is the number of reduced features) obtained from the genetic data are used as the predictor variables (A). If the population labels are provided (B), they are used as the response variable to carry out classification training through neural network (C). The individuals are assigned to the corresponding populations with an optimal neural network model. If the individual geographic coordinates are provided (B), the geographic coordinates are used as the response variable to carry out the regression training with neural network (C). An optimal neural network model is found and trained to predict the individual geographic coordinates. Finally, the accuracy of the reduced features for assigning individuals to correct populations or for predicting individual geographic coordinates is assessed (D) from the optimal neural network model.
Figure 2
Figure 2
Analyses of simulated data under four spatial scenarios (A, E, I: island model; B, F, J: hierarchical island model; C, G, K: stepping stone model; D, H, L: hierarchical stepping stone model) using PCA, DAPC and KLFDAPC. (AD) Genetic structures of four spatial scenarios inferred from PCA; (EH) genetic structures of four spatial scenarios inferred from DAPC; (IL) genetic structures of four spatial scenarios inferred from KLFDAPC, with σ = 0.5. The first 20 PCs were used in DAPC and KLFDAPC analyses. The same colour in the scatter plots represents the same region. Individuals are grouped by population names.
Figure 3
Figure 3
Discriminatory power of three approaches using the first three reduced features as the explanatory variables to distinguish populations. (A) Island model, (B) hierarchical island model, (C) stepping stone model and (D) hierarchical stepping stone model. Accuracy and Kappa were estimated after ‘10-fold-10-repeats’ adaptive cross-validation. Comparison between models was tested using a pairwise t-test based on results of 100 cross-validation resamples. Different letters indicate the statistical significance at the 0.05 level. P-value adjustment: Bonferroni.
Figure 4
Figure 4
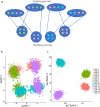
Population structure inference when sampled regions are genetic mixtures. (A) Graphical representation where each blue circle represents a region consisting of four breeding grounds. Each blue oval represents a feeding ground composed of individuals from two different regions. Small circles represent populations and are coloured according to the region they belong to. (B) Results obtained with DAPC; (C) results obtained with KLFDAPC.
Figure 5
Figure 5
Genetic structure of POPRES dataset represented by the first two reduced features from PCA (A), DAPC (B) and KLFDAPC (C), and projected individual geographic locations within Europe based on PCA (D), DAPC (E) and KLFDAPC, with σ = 5 (F). The solid circles are the centroid of individuals from the same country. Country abbreviations: AL, Albania; AT, Austria; BA, Bosnia-Herzegovina; BE, Belgium; BG, Bulgaria; CH, Switzerland; CY, Cyprus; CZ, Czech Republic; DE, Germany; ES, Spain; FR, France; GB, United Kingdom; GR, Greece; HR, Croatia; HU, Hungary; IE, Ireland; IT, Italy; KS, Kosovo; MK, Macedonia; NO, Norway; NL, Netherlands; PL, Poland; PT, Portugal; RO, Romania; RS, Serbia and Montenegro; RU, Russia; Sct, Scotland; SE, Sweden; TR, Turkey; YG, Yugoslavia.
Figure 6
Figure 6
Genetic structure of Han Chinese people from the CONVERGE dataset represented by the first two reduced features from PCA (A), DAPC (B) and KLFDAPC (C), and projected individual geographic locations within China based on PCA (D), DAPC (E) and KLFDAPC, with σ = 0.5 (F). The solid circles represent the centroid of individuals from the same province. Province abbreviations: Shanghai, SH; Liaoning, LN; Zhejiang, ZJ; Tianjin, TJ; Hunan, HUN; Sichuan, SC; Shaanxi, SAX; Heilongjiang, HLJ; Jiangsu, JS; Shandong, SD; Henan, HEN; Hebei, HEB; Beijing, BJ; Guangdong, GD; Jiangxi, JX; Shanxi, SX; Hubei, HUB; Guangxi Zhuangzu, GX; Chongqing, CQ; Fujian, FJ; Gansu, GS; Jilin, JL; Anhui, AH; Hainan, HAN.

References

    1. Barbujani G, Excoffier LGL. The history and geography of human genetic diversity. In: Stearns, Stephen C. (Ed.). Evolution in health and disease. Oxford: Oxford University Press, 1999. https://archive-ouverte.unige.ch/unige:93149.
    1. Manica A, Prugnolle F, Balloux F. Geography is a better determinant of human genetic differentiation than ethnicity. Hum Genet 2005;118:366–71. - PMC - PubMed
    1. Labonte R, Polanyi M, Muhajarine N, et al. Beyond the divides: towards critical population health research. Crit Public Health 2005;15:5–17.
    1. Parsons T. Societies: Evolutionary and Comparative Perspectives. Englewood Cliffs, NJ: Prentice-Hall, 1966.
    1. Root M. How we divide the world. Philos Sci 2000;67:S628–39.

Publication types