. 2022 Jul 8;3(7):481-518.e14.
doi: 10.1016/j.medj.2022.05.002. Epub 2022 May 31.

Cross-tissue, single-cell stromal atlas identifies shared pathological fibroblast phenotypes in four chronic inflammatory diseases

Affiliations

Cross-tissue, single-cell stromal atlas identifies shared pathological fibroblast phenotypes in four chronic inflammatory diseases

Ilya Korsunsky et al. Med. .

Abstract

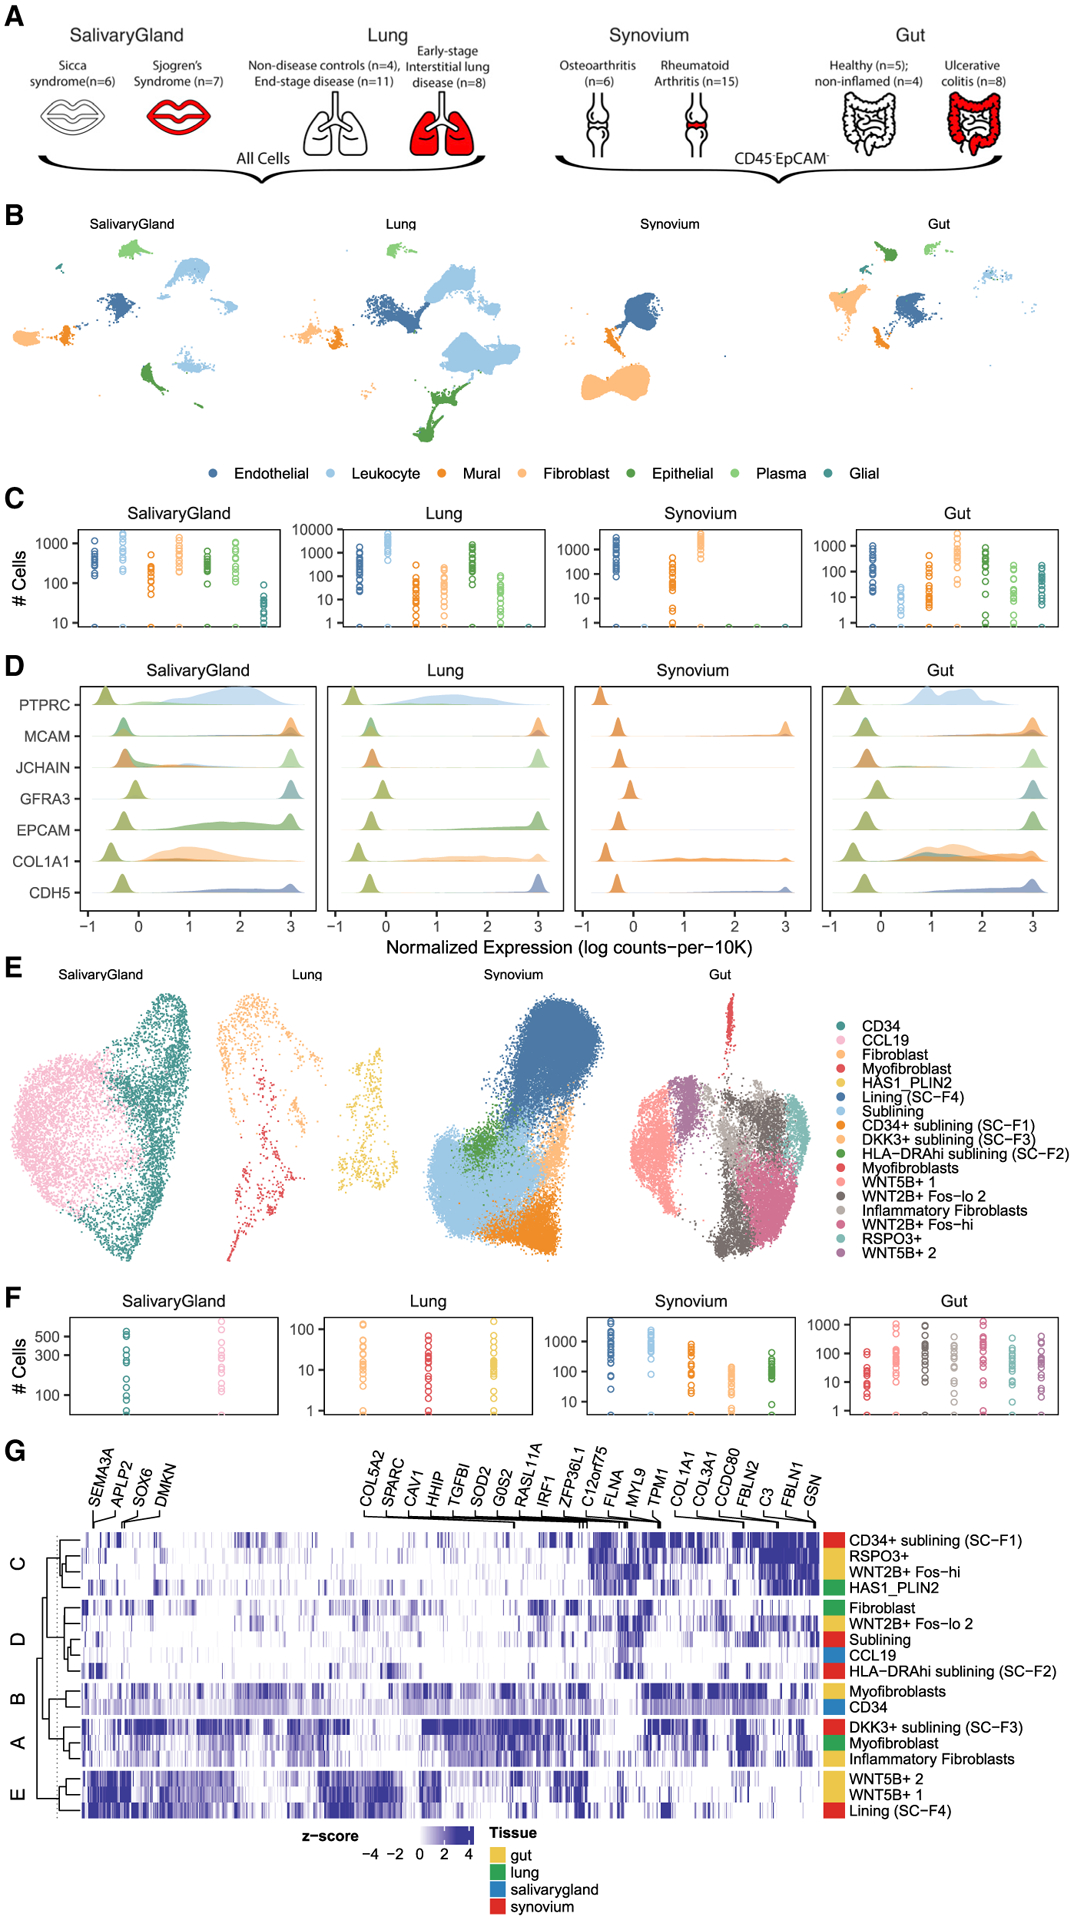
Background: Pro-inflammatory fibroblasts are critical for pathogenesis in rheumatoid arthritis, inflammatory bowel disease, interstitial lung disease, and Sjögren's syndrome and represent a novel therapeutic target for chronic inflammatory disease. However, the heterogeneity of fibroblast phenotypes, exacerbated by the lack of a common cross-tissue taxonomy, has limited our understanding of which pathways are shared by multiple diseases.

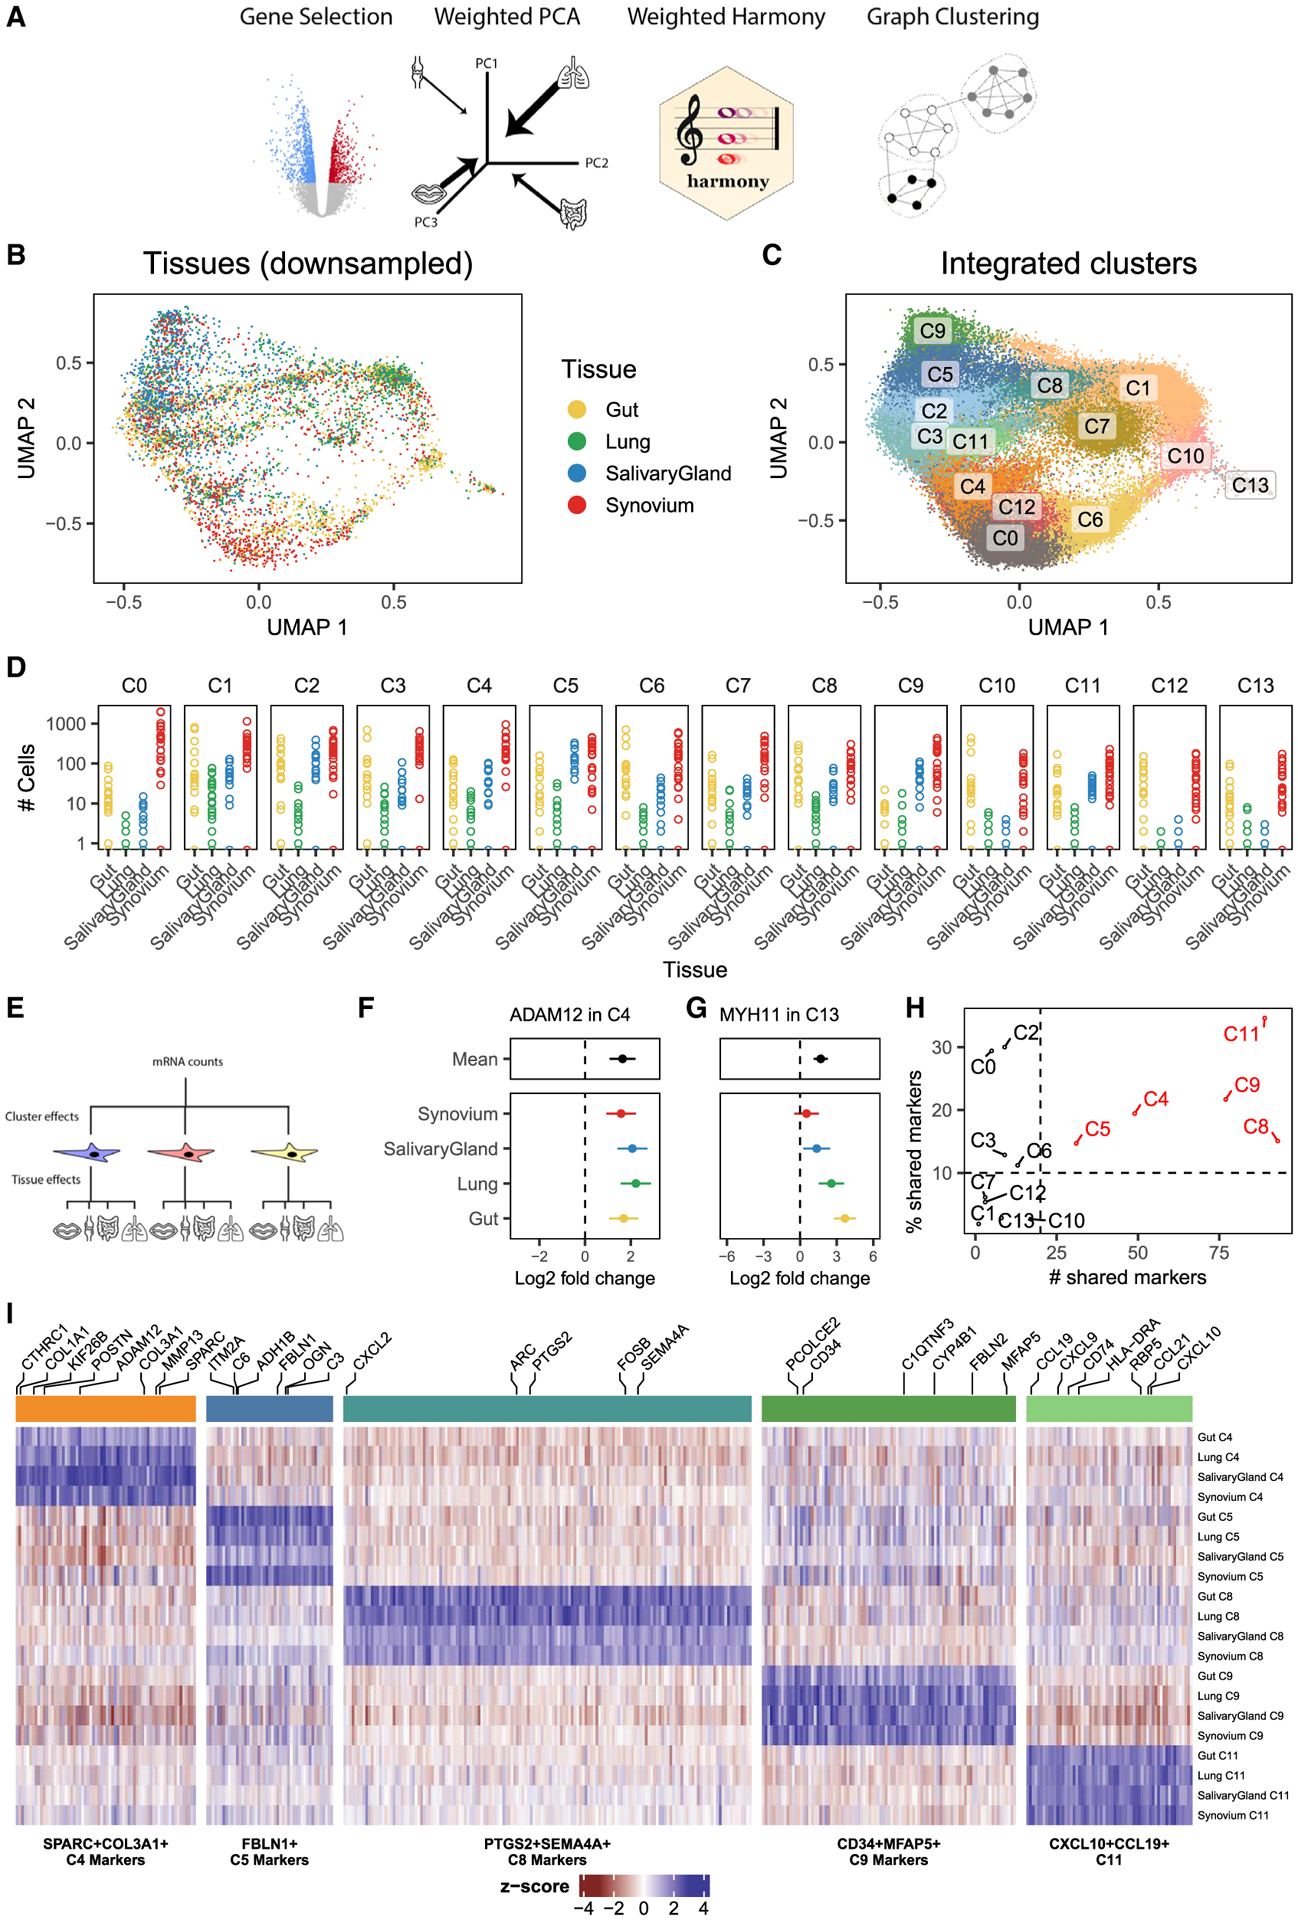
Methods: We profiled fibroblasts derived from inflamed and non-inflamed synovium, intestine, lungs, and salivary glands from affected individuals with single-cell RNA sequencing. We integrated all fibroblasts into a multi-tissue atlas to characterize shared and tissue-specific phenotypes.

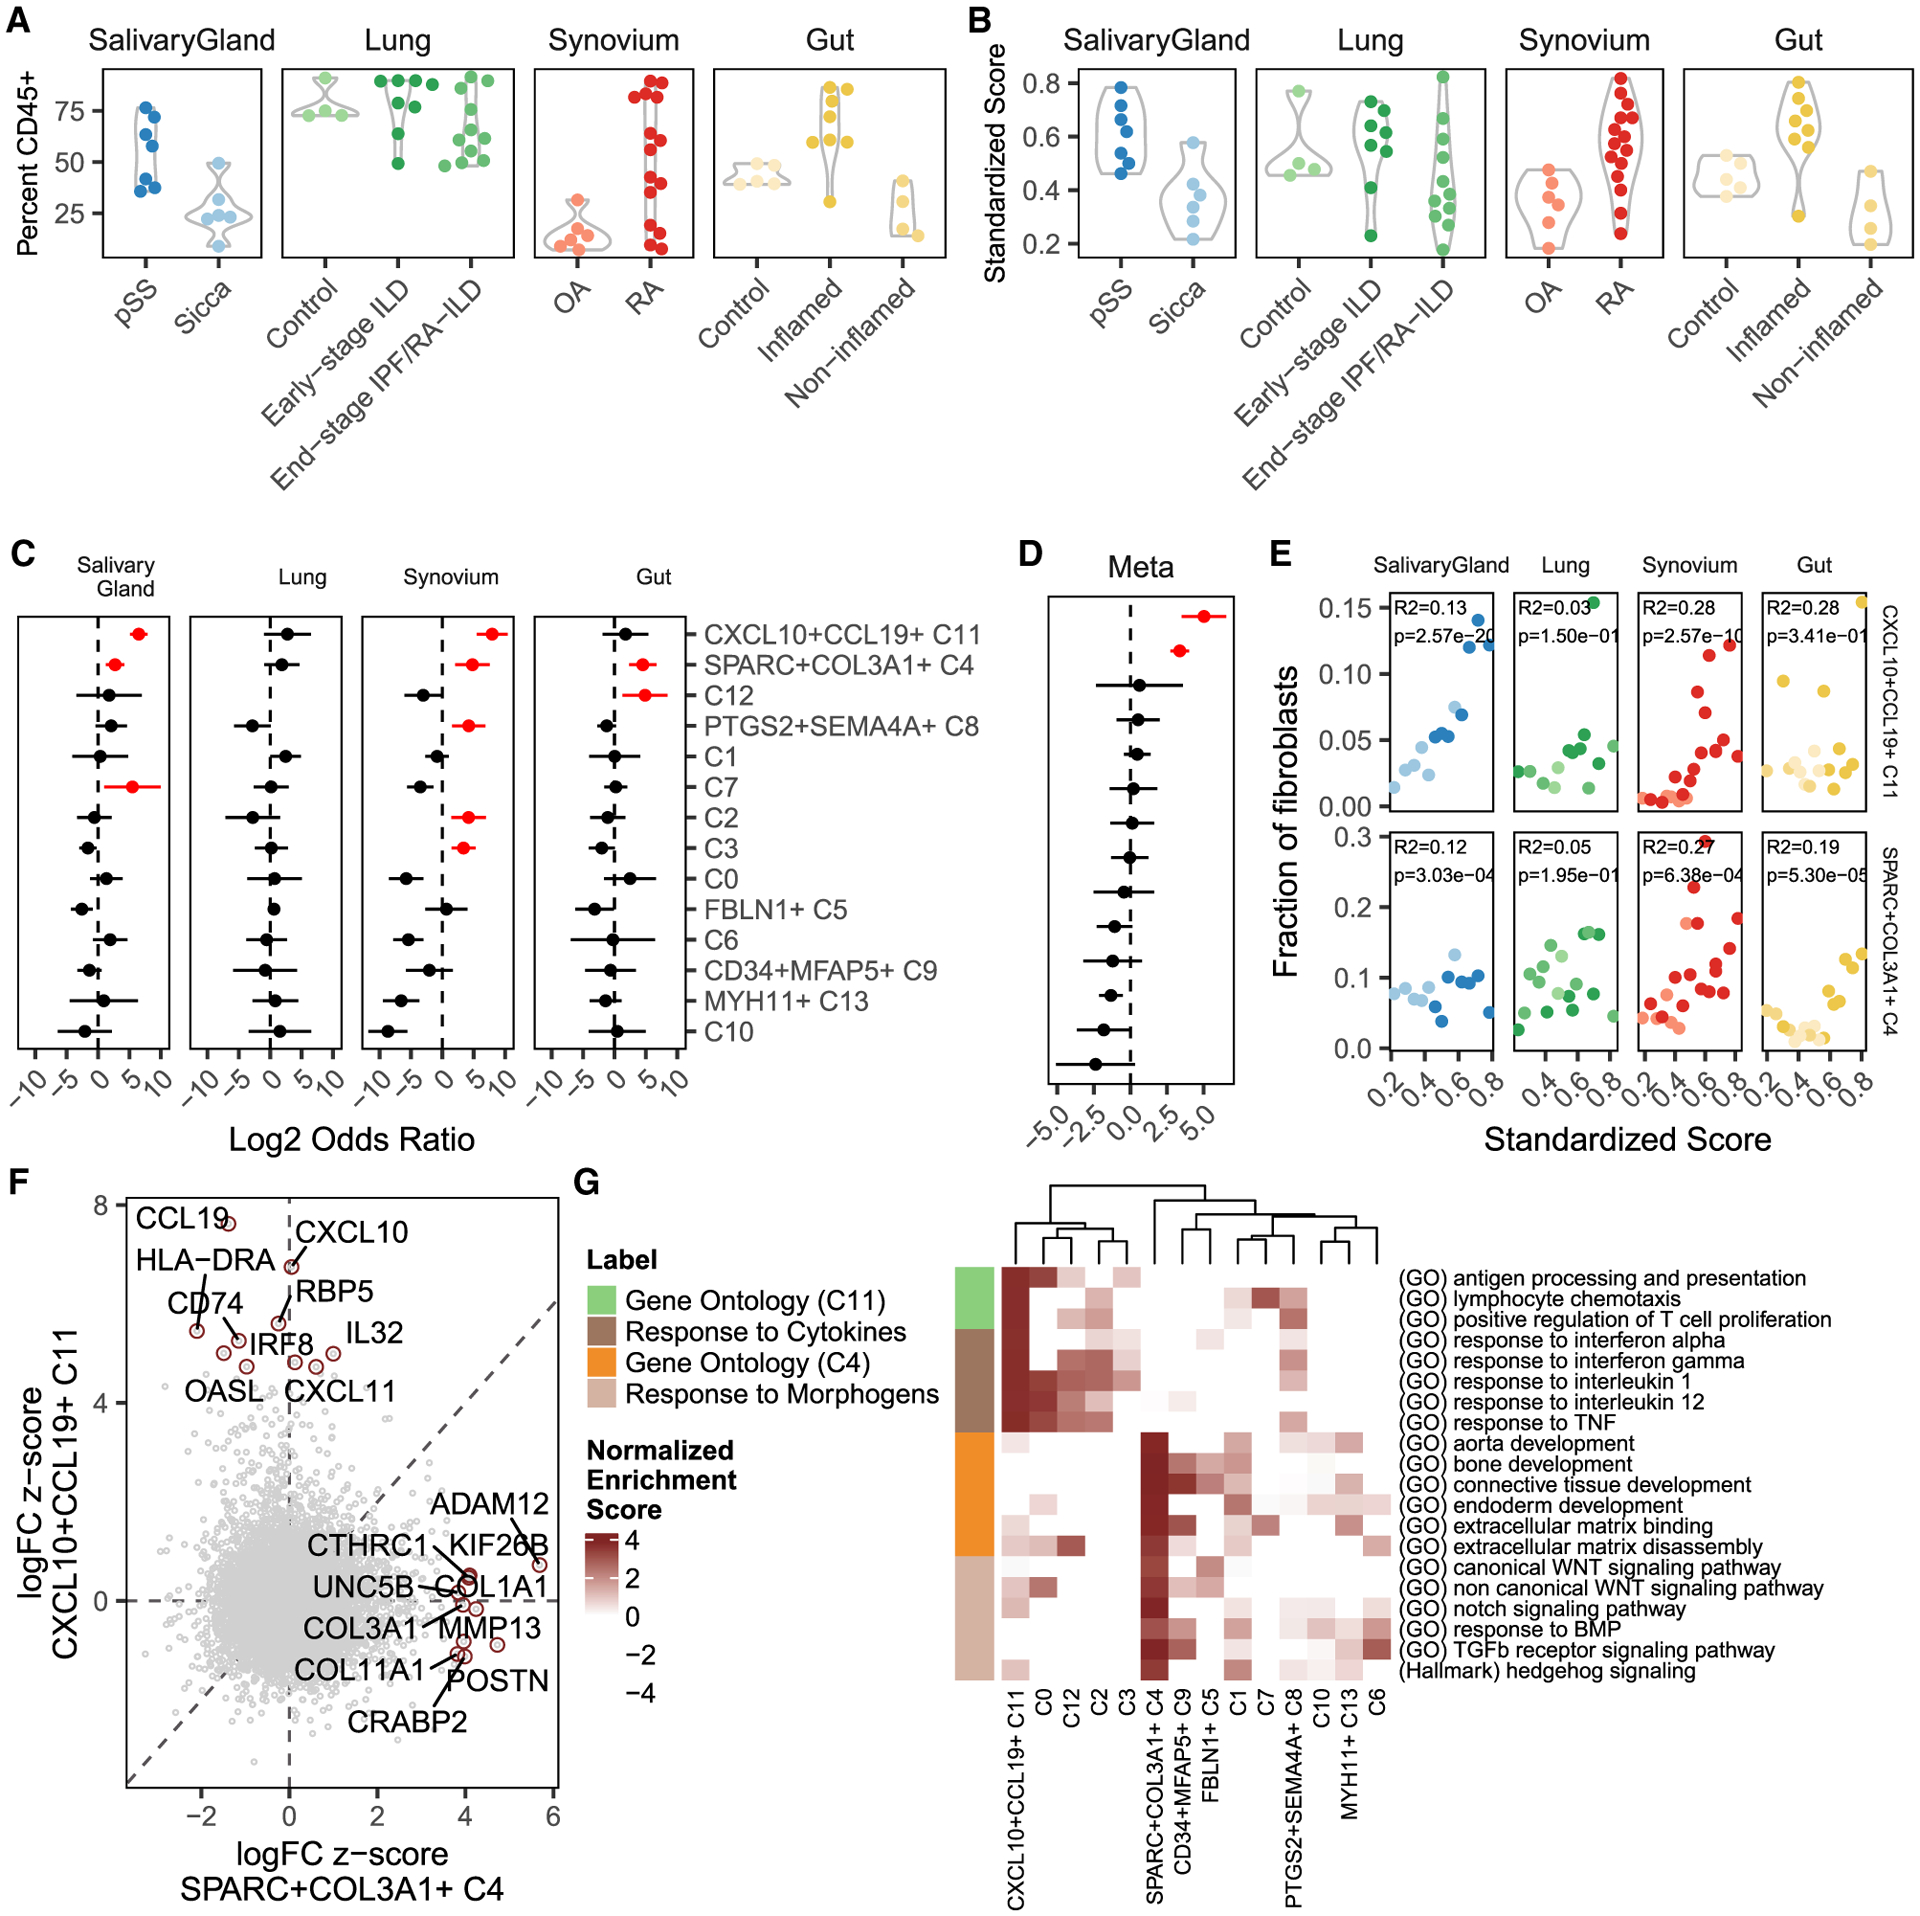
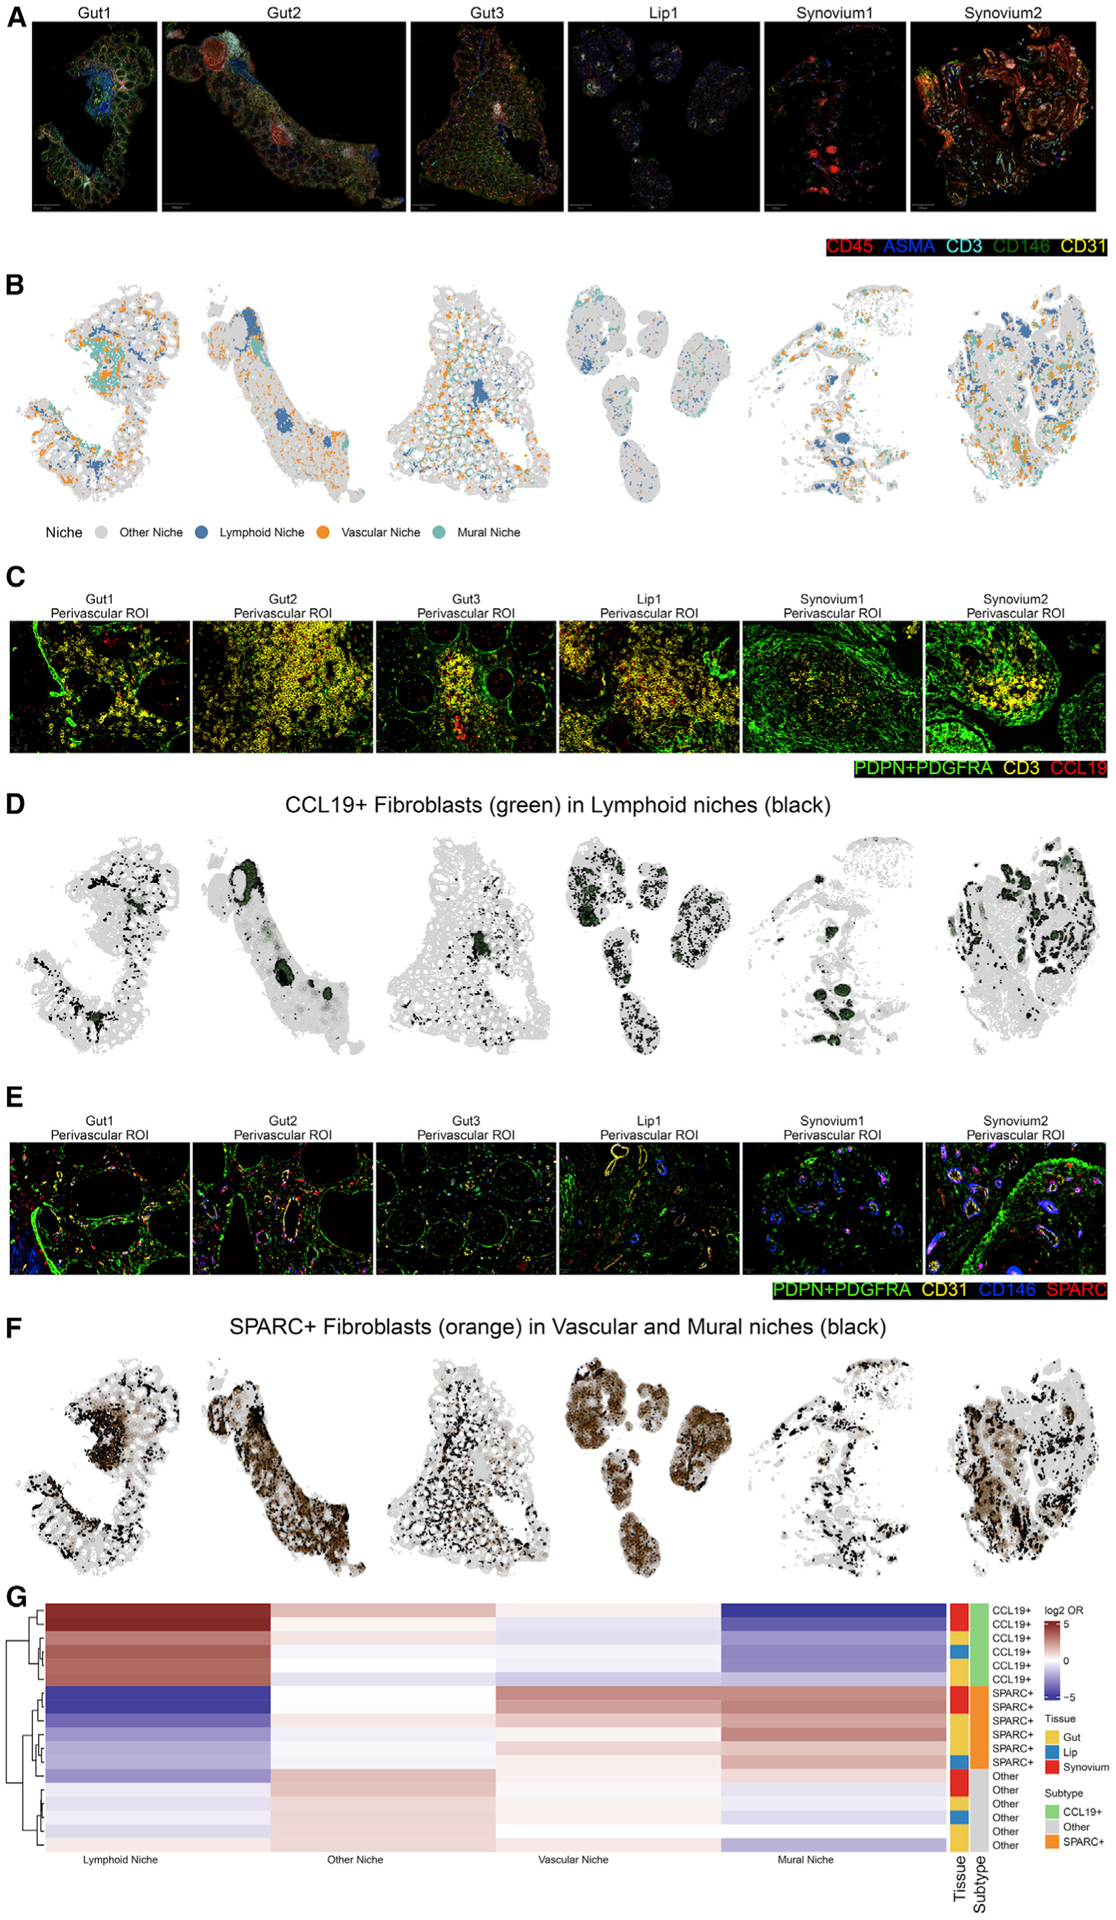
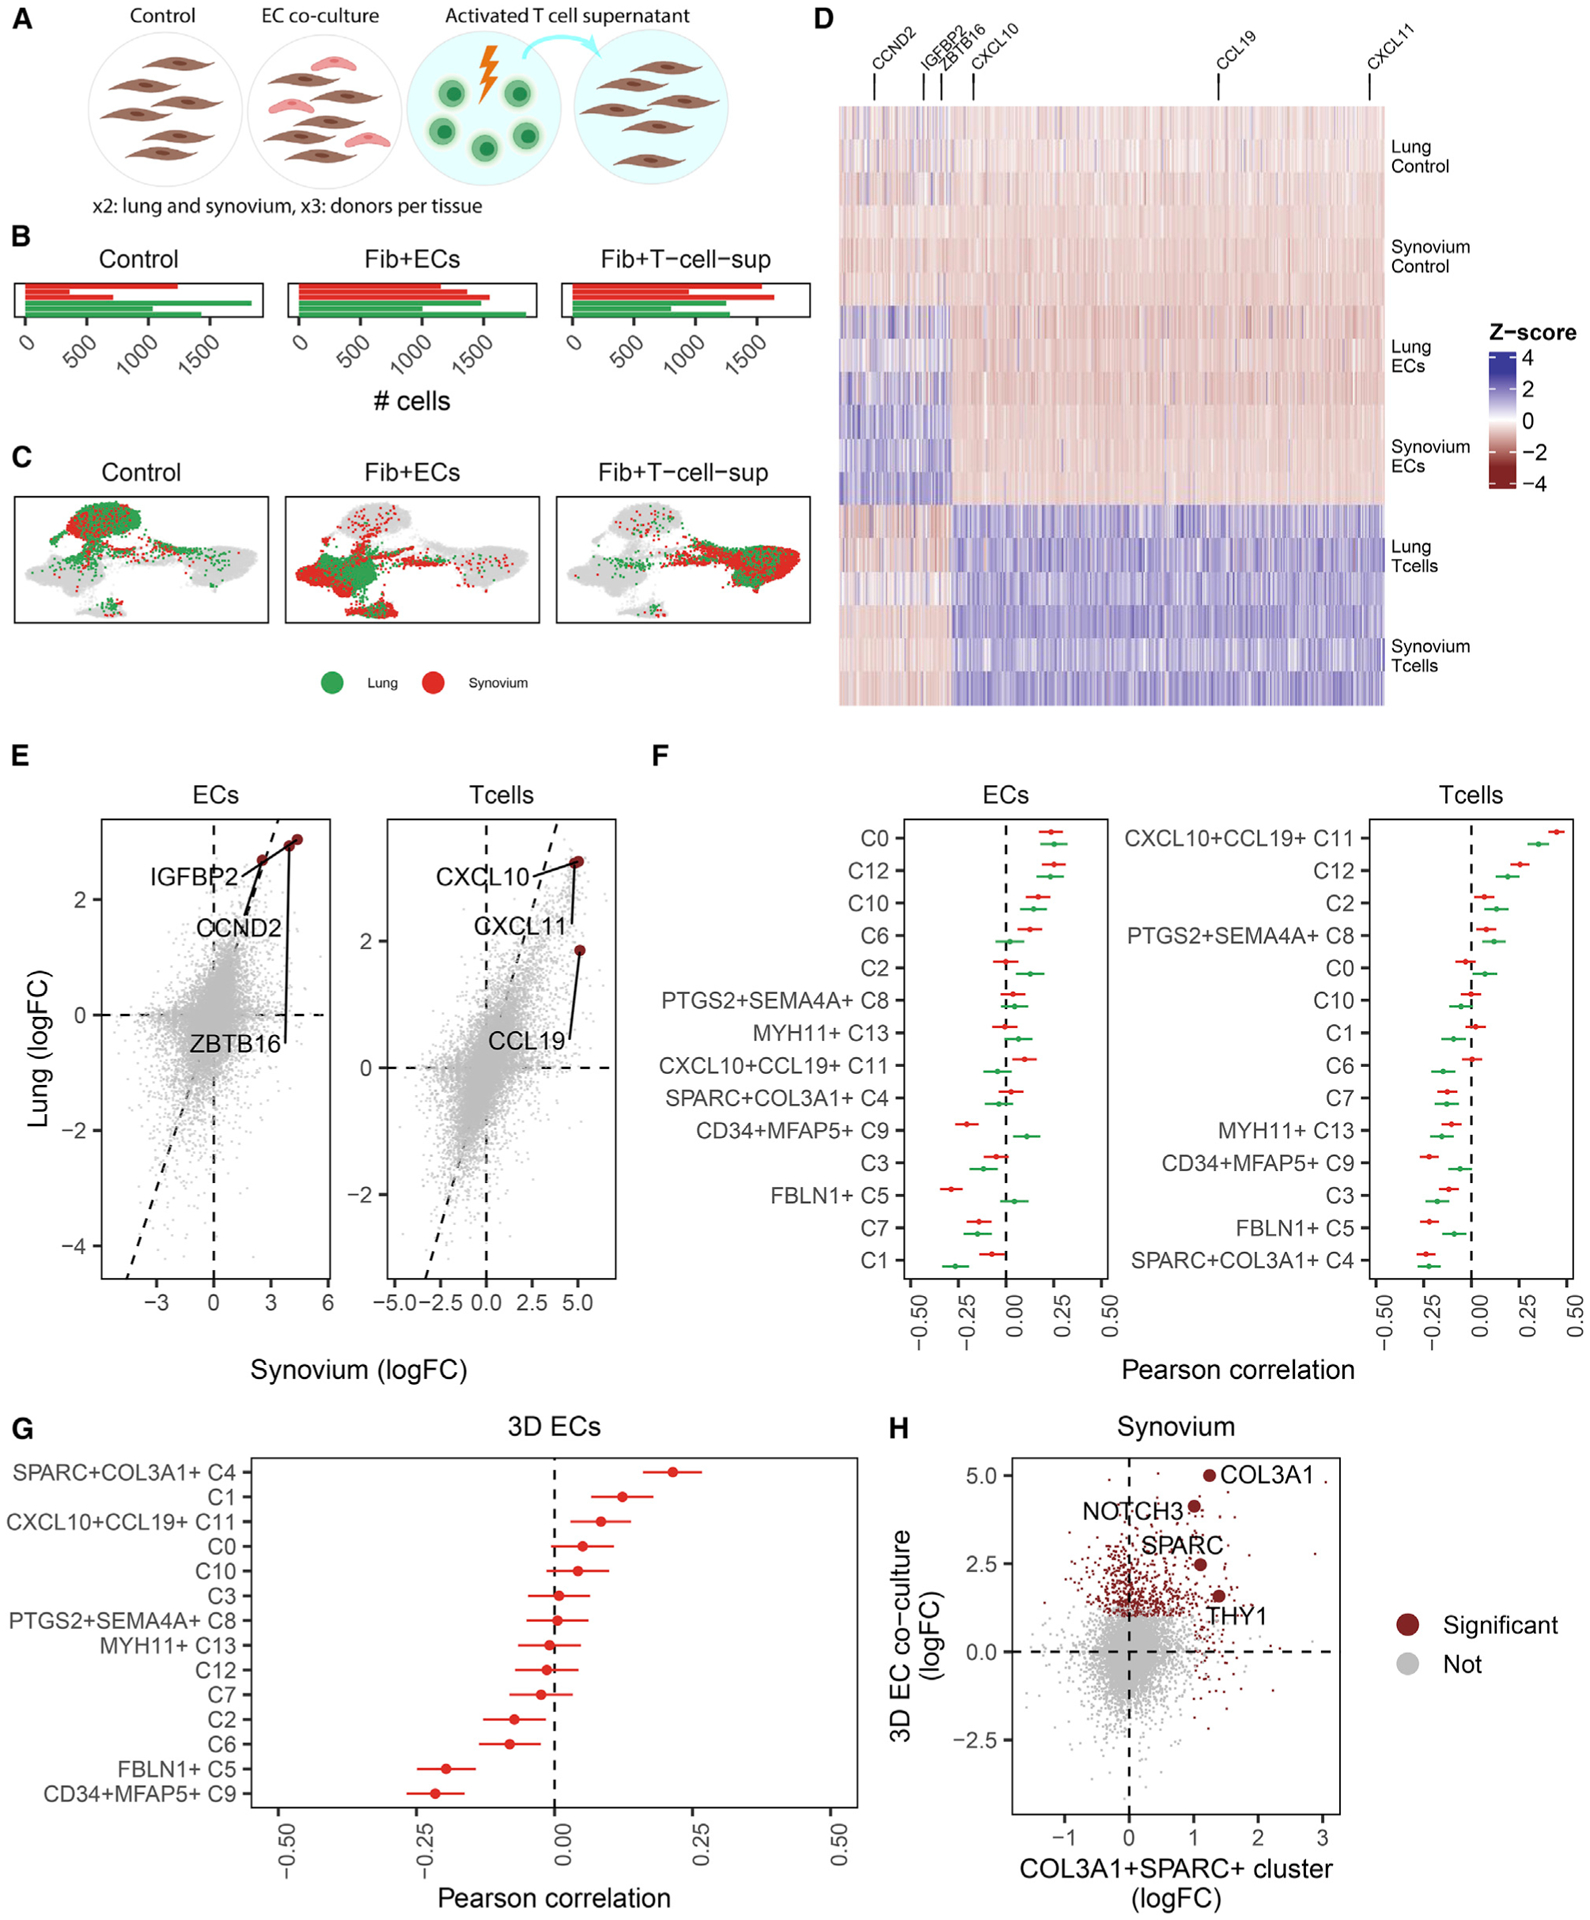
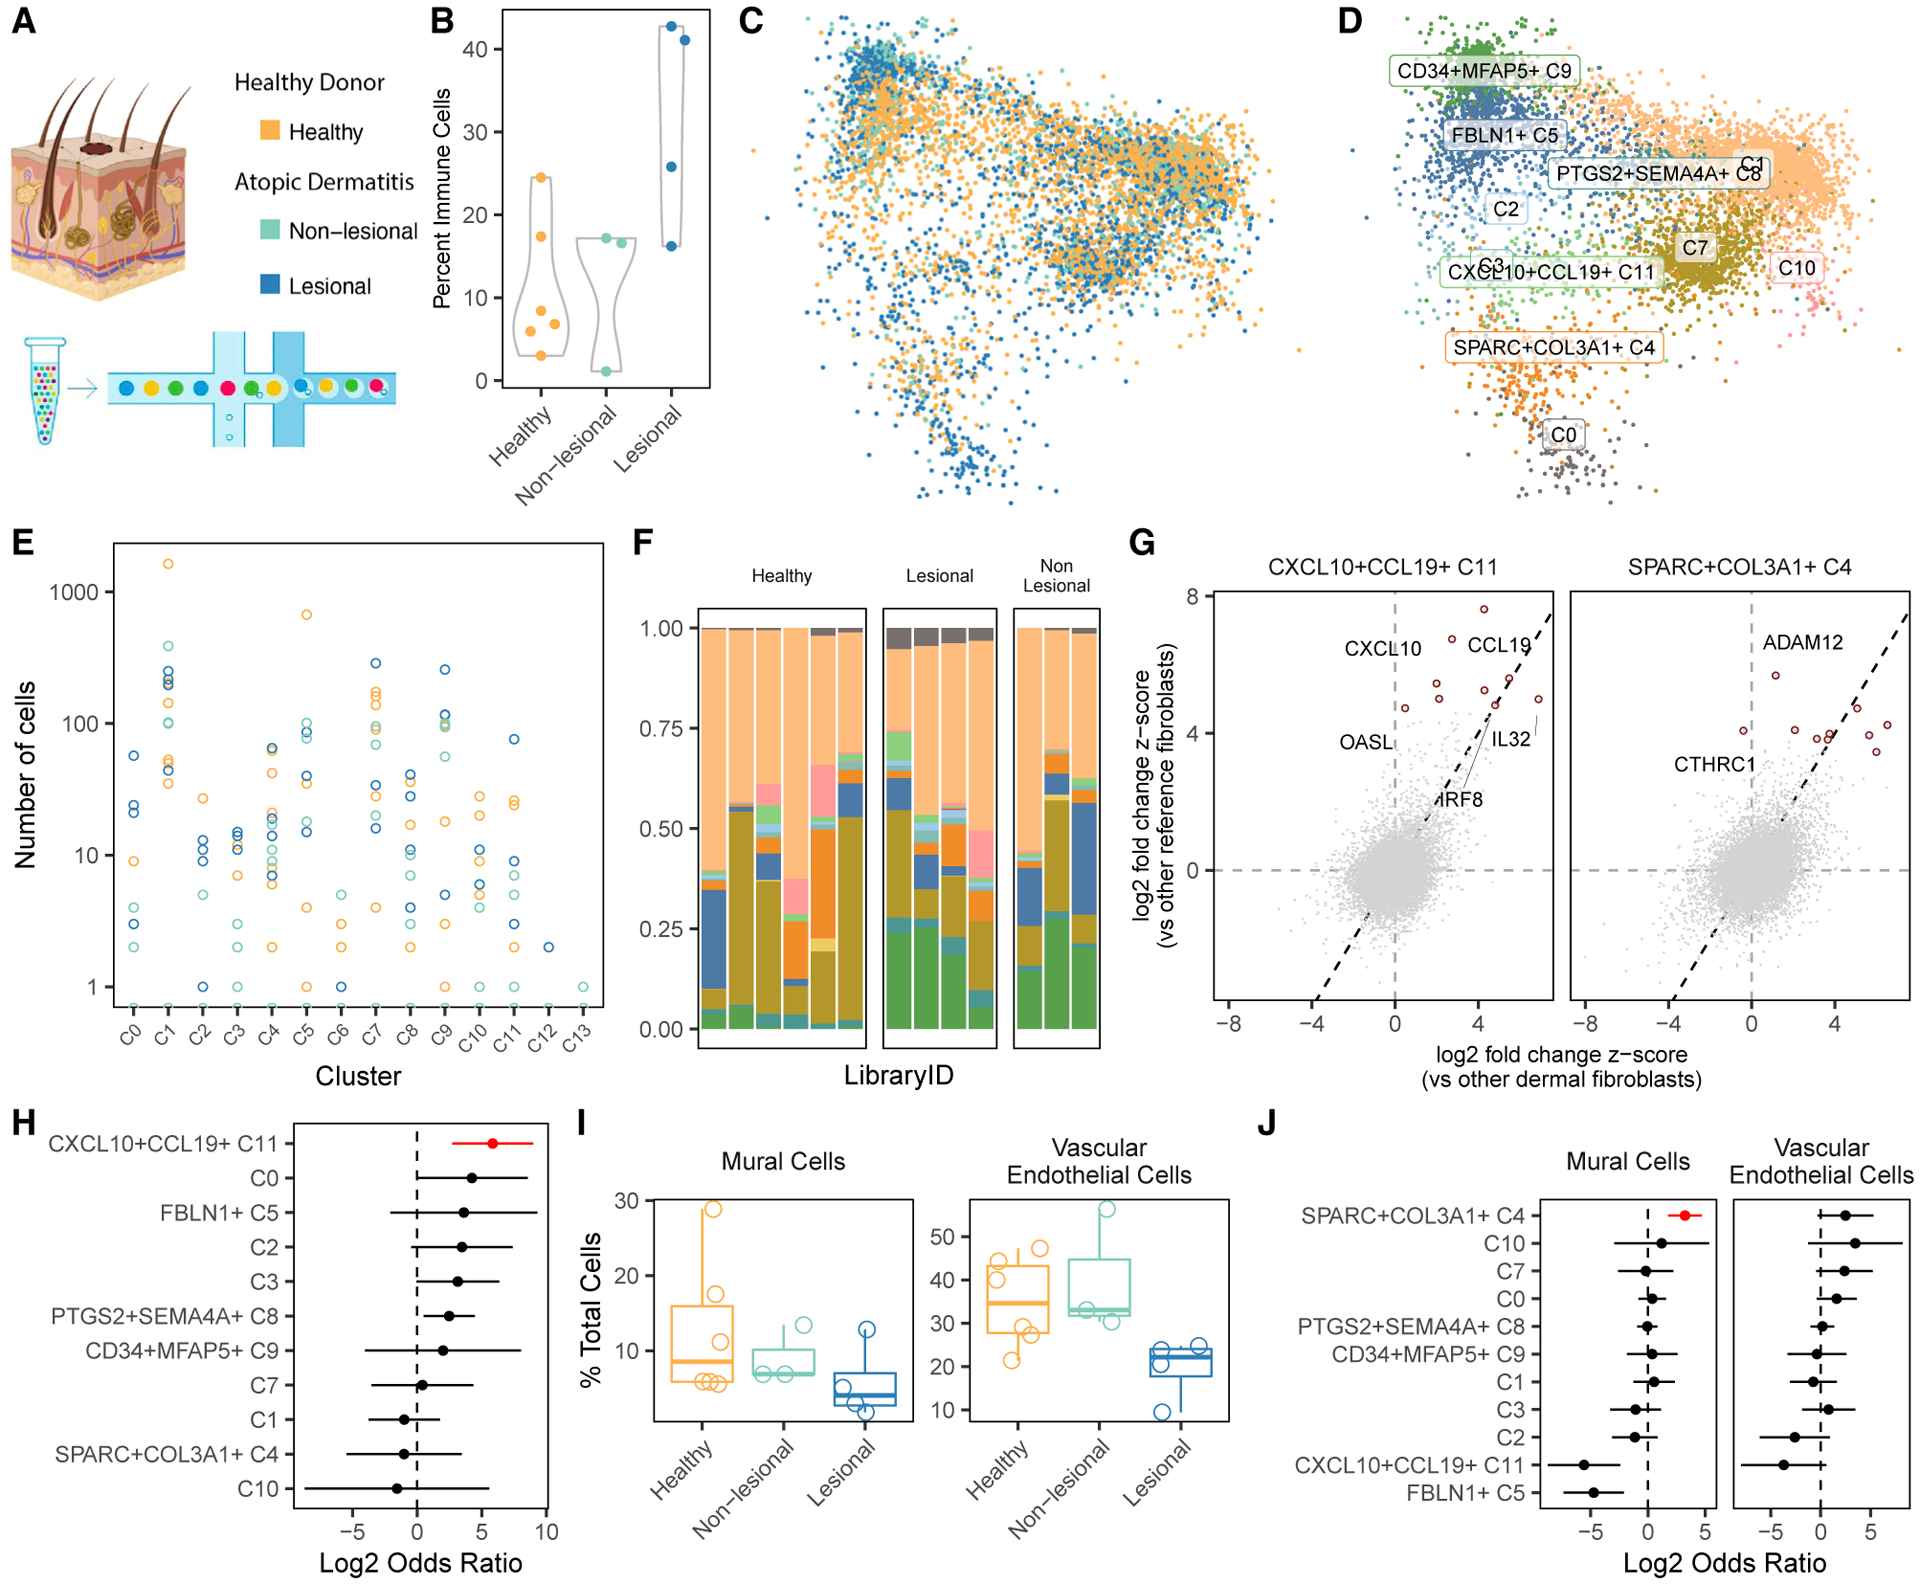
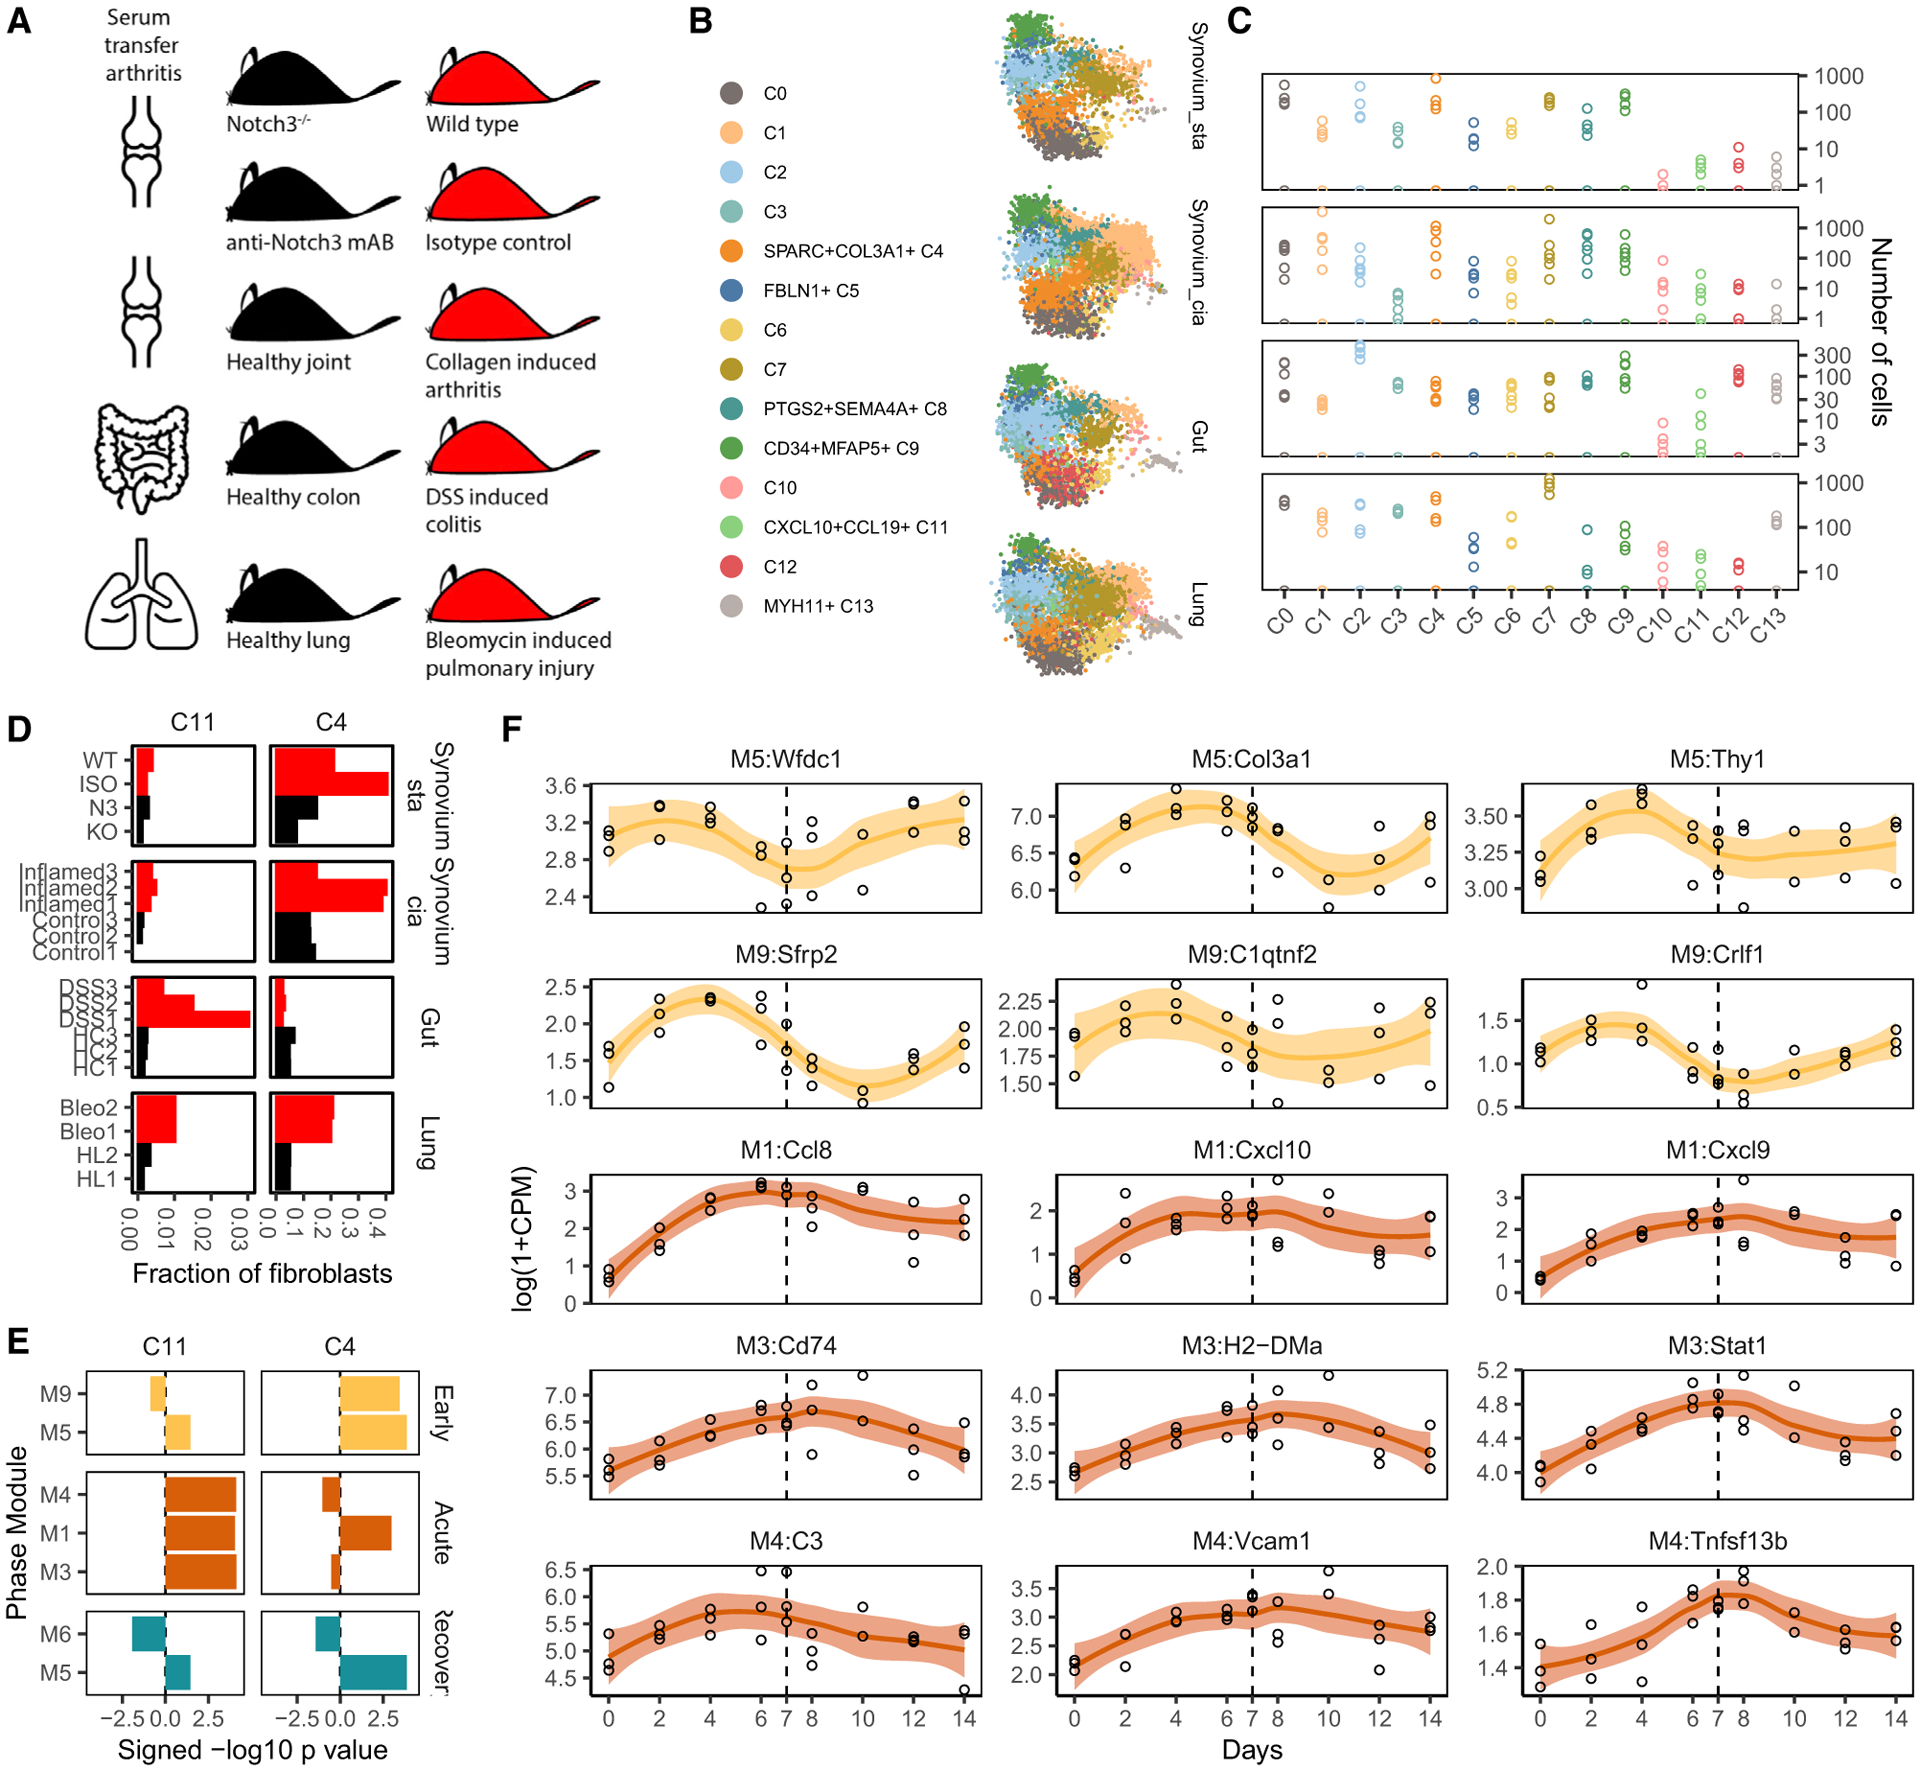
Findings: Two shared clusters, CXCL10+CCL19+ immune-interacting and SPARC+COL3A1+ vascular-interacting fibroblasts, were expanded in all inflamed tissues and mapped to dermal analogs in a public atopic dermatitis atlas. We confirmed these human pro-inflammatory fibroblasts in animal models of lung, joint, and intestinal inflammation.

Conclusions: This work represents a thorough investigation into fibroblasts across organ systems, individual donors, and disease states that reveals shared pathogenic activation states across four chronic inflammatory diseases.

Funding: Grant from F. Hoffmann-La Roche (Roche) AG.

Keywords: Foundational research; Sjögren's syndrome; atlas; fibroblasts; inflammation; integration; interstitial lung disease; rheumatoid arthritis; scRNA-seq; stromal; ulcerative colitis.


Conflict of interest statement

Declaration of interests E.Y.K. is a member of the advisory board for Cell Reports Medicine. In disclosures unrelated to this work, E.Y.K. is a member of the Steering Committees for and receives no financial renumeration from NCT04409834 (Prevention of arteriovenous thrombotic events in critically ill COVID-19 patients, TIMI group) and REMAP-CAP ACE2 renin-angiotensin system (RAS) modulation domain. E.Y.K. receives unrelated research funding from Bayer AG. In the past, E.Y.K. received unrelated research funding from Windtree Therapeutics. T.T. receives unrelated support from the Zoll Foundation. K.W. is a consultant to Mestag and Gilead Sciences and reports grant support from Gilead Sciences. S.R. is a scientific advisor for Rheos Medicines, Janssen, and Pfizer and a founder of Mestag, Inc. Y.J. and H.A. receive unrelated support from Bayer AG. M.B.B. is a consultant to GSK and 4FO Ventures and a founder of Mestag Therapeutics. M.L.S. receives unrelated research funding and institution consulting fees from Genentech, institution consulting fees from Lilly, research funding from Bristol Myers Squibb, and personal consulting fees from GV20 Therapeutics. M.C. is a co-founder of Mestag Therapeutics and obtains grant funding from and has consulted for Hoffman La-Roche. S.B. has provided paid consultancy services regarding Sjögren’s syndrome clinical trial design for the following companies in the past 3 years: Abbvie, AstraZeneca, BMS, Galapagos, Novartis, and Resolve Pharma. A.F. has received personal renumerations from Abbvie, Roche, and Janssen in the last 2 years and institutional research funding from Roche, UCB, Nascient, Mestag, GSK, and Janssen. A.P.F. and K.G.L. reported being employees of F. Hoffmann-La Roche (Roche) AG.

Figures

Figure 1.
Figure 1.. scRNA-seq profiles of and fibroblast heterogeneity within intestine, lung, salivary gland, and synovium
(A and B) Surgical samples were collected from intestine, lung, salivary gland, and synovium from individuals with inflammatory disease and appropriate controls (A). After tissue disaggregation, all cells from lung and salivary gland and CD45EpCAM cells from synovium and intestine were profiled with scRNA-seq and (B) analyzed to identify fibroblasts and other major cell types. (C) Total cell numbers per donor per major cell type in log scale. (D) Cell type annotation was performed with known markers for each major population. (E) Fine-grained clustering within fibroblasts was performed for each tissue and plotted with tissue-specific UMAP projections. (F) Total cell numbers per donor per fibroblast cluster in log scale. (G) All (n = 894) genes upregulated in a group and shared among tissue clusters in that group were plotted in a heatmap. Color denotes the log fold change, normalized by estimated standard deviation, of a gene in a cluster (versus other clusters in that tissue). The top five genes for each cluster are named above the heatmap. Each row denotes a fibroblast cluster, colored according to the tissue in which it was identified. Rows are clustered into five groups to highlight the similarity of tissue-defined clusters across tissues.
Figure 2.
Figure 2.. Integrative clustering and differential expression across tissues
(A) We developed a pipeline to integrate samples from multiple donors and multiple tissues with unbalanced cell numbers. The pipeline starts with gene selection, pooling genes that were informative in single-tissue analyses. With these genes, we performed weighted PCA, reweighting cells to computationally account for the unbalanced dataset sizes among the tissues. These principal components are adjusted with a novel formulation of the Harmony integration algorithm and used to perform graph-based clustering. We applied this pipeline to all fibroblasts across tissues. (B) The integrated UMAP projection shows cells from all tissues mixed in one space. For clarity, we down-sampled each tissue to the smallest tissue, the lung, choosing 1,442 random fibroblasts from intestine, synovium, and salivary gland. (C) Graph-based clustering proposed 14 fibroblast clusters in the integrated embedding. (D) Total cell numbers per donor per integrated cluster in log scale. (E–G) Gene-level analysis to find upregulated marker genes for clusters was done with hierarchical regression to model complex interactions between clusters and tissues (E). This strategy distinguishes cluster marker genes that are (F) shared among tissues, such as ADAM12 in C4, from those that are (G) tissue-specific, such as MYH11 in C13. Points denote log fold change (cluster versus other fibroblast), and error bars mark the 95% CI for the fold change estimate. (H) The number of shared genes (x axis) as well as the percentage of shared over total marker genes (y axis) for each cluster, ranked from most to least, prioritizes clusters with large evidence of shared gene expression (red) from those with little evidence (black). (I) Marker genes for the 5 shared clusters plotted in a heatmap. Each block represents the (differential) gene expression of a gene (column) in a cluster for a tissue (row).
Figure 3.
Figure 3.. Identification of inflammation-associated clusters
(A) We computed the relative abundance of CD45+ immune cells among all cells in each sample. (B) We standardized these frequencies across tissues into an inflammation score that ranges from 0–1 and removes distributional differences. (C) Association analysis results between fibroblast cluster abundance and standardized inflammation scores. Each point represents the log fold change in fibroblast cluster abundance with increasing inflammation, and the line represents that point’s 95% CI. Red denotes estimates with one-tailed FDR < 5%. (D) The tissue-specific results were summarized using meta-analysis. (E) For CXCL10+CCL19+ (C11) and SPARC+COL3A1+ (C4) fibroblasts, scatterplots relating to standardized inflammation scores (x axis) to relative fibroblast frequency (y axis). The colors in each panel refer to the clinical status of each donor, as denoted in (A) and (B). Reported p values were computed from logistic mixed-effects regression test and R2 statistics using McKelvey’s method. (F) Comparison of differential gene expression between CXCL10+CCL19+ and SPARC+COL3A1+ fibroblasts shows that these two inflammation-expanded clusters are characterized by distinct genes. The top 10 markers for each cluster are named. (G) Gene set enrichment analysis (GSEA) with Gene Ontology and MSigDB hallmark pathways shows distinct functions for the C4 (orange) and C11 (lime) states. These states may be explained by response to distinct sets of signaling molecules: inflammatory cytokines for C4 (brown) and tissue modeling morphogens for C11 (tan). The heatmap shows normalized enrichment scores from GSEA, focusing only on positive enrichment for clarity.
Figure 4.
Figure 4.. Quantitative co-localization of inflammation-expanded fibroblast phenotypes in vascular and lymphoid niches
(A) Normalized intensities of the representative markers CD45, ASMA, CD3, CD146, and CD31 in segmented cells from surgical tissues samples of UC gut, pSS lip, and RA synovium. (B) Visualization of molecularly distinct anatomical niches based on the 5 markers in (A). (C) Manually selected regions of interest from the images in (A) highlight a region with abundance of CD3+ T lymphocytes next to (PDPN/PDGFRA)+CCL19+ fibroblasts. (D) The same tissues from (B), colored to highlight lymphoid regions (black) and CCL19+ fibroblasts (green). (E) Manually selected regions of interest from the images in (A) highlight a region with abundance of CD31+ vascular and CD146+ perivascular mural cells near (PDPN/PDGFRA)+SPARC+ fibroblasts. (F) The same tissues from (B), colored to highlight vascular regions (black) and SPARC+ fibroblasts (orange). (G) Heatmap depicting results of co-localization analysis between niches (columns) defined in (B) and three fibroblast subtypes (rows). Color in the heatmap denotes the log2 OR from the logistic regression test. Color bars for rows specify the tissue and fibroblast subtype of each test.
Figure 5.
Figure 5.. Convergence of fibroblasts from distinct tissues with in vitro activation
(A) Study design with three conditions: fibroblasts cultured alone (control), with an equal mixture of endothelial cells (ECs), and in supernatant extracted from activated T cells (T cells). Each condition was repeated in three lung-derived and three synovium-derived fibroblast cell lines. (B) Total cell numbers per donor per condition in log scale. (C) scRNA-seq profiles of cultured cells were visualized in 3D with integrative analysis and UMAP projection. Each subpanel highlights the location of fibroblasts from the control, T cell, and EC conditions and colors fibroblasts by tissue. (D) Within each tissue, activation signatures were derived for the EC and T cell conditions and plotted in a heatmap of pseudobulk samples (rows) by genes (columns), colored by centered and scaled log2 fold change (versus control). Three representative genes were selected for each activation signature. (E) For each condition, we plotted the per-gene changes for synovial fibroblasts (x axis) against lung fibroblasts (y axis) and highlighted the three representative genes from (D). (F) We compared the in vitro activation changes with cluster marker signatures from the cross-tissue atlas with correlation analysis. Error bars denote 99% CI for the Pearson correlation statistic. (G) Correlation analysis of fibroblasts cultured with ECs in a 3D culture system. (H) Magnification of the correlation of SPARC+COL3A1+ (C4) cluster markers (x axis) with the 3D EC synovial activation signature (y axis). Genes significantly (p < 0.01, log2 FC > 1) upregulated on either axis are colored red, and canonical markers of the C4 cluster are highlighted with text.
Figure 6.
Figure 6.. Dermal fibroblast scRNA-seq profiles mapped to the cross-tissue fibroblast atlas
(A) To validate our results, we mapped scRNA-seq profiles of dermal fibroblasts from lesion biopsies from individuals with atopic dermatitis (AD), non-lesional biopsies from individuals with AD, and control skin biopsies from healthy donors. (B) Based on the relative frequency of immune cells in each biopsy, we computed standardized inflammation scores from 0–1. (C–F) We mapped dermal fibroblasts to our fibroblast atlas (C) and labeled dermal fibroblasts according to their most similar atlas cluster (D). Shown are per-donor (E) absolute and (F) relative frequencies of all reference-mapped inferred clusters. Clusters are colored according to the names in (D). (G) We confirmed that the gene expression profiles of inferred dermal fibroblast clusters correlated with expression profiles of their reference fibroblast clusters. This is demonstrated for clusters C4 and C11 by plotting the (differential) gene expression in dermal (x axis) versus reference (y axis) clusters and calling out the top marker genes identified in the reference clusters. (H) Only CXCL10+CCL19+ (C11) fibroblast frequency was significantly (FDR < 5%) associated with dermal inflammation. (I) Cells from skin with lesions (blue) had considerably less evidence of vasculature, measured by the abundance of perivascular mural cells and vascular ECs. (J) Relative abundance of mural cells and ECs was most strongly associated with cluster C4. Red denotes one-tailed FDR < 5%.
Figure 7.
Figure 7.. Replication in disease models of pulmonary, intestinal, and synovial inflammation
(A) We collected studies of inflammation in mouse models of human disease: bleomycin-induced ILD, DSS-induced colitis, ST arthritis, and CIA. (B) Fibroblasts from each study were mapped to the human fibroblast atlas and labeled with their most closely mapped clusters. (C) Total cell numbers per replicate per integrated cluster in log scale. Each panel corresponds to the aligned tissue in (B). (D) Frequencies of the human inflammatory states C4 and C11 in each study sample, colored to denote samples from animals with high (red) and low (black) inflammation. (E) GSEA with modules associated with early, acute, and recovery phases of DSS-induced colitis shows that C4 and C11 gene signatures are activated at distinct stages of inflammation. (F) Time course expression profiles of key C4 and C11 marker genes that overlap with the early (yellow) and acute (orange) phase-associated modules. A dotted line denotes the time point (day 7) when DSS was removed from mice.

Similar articles

Cited by

References

    1. Koliaraki V, Prados A, Armaka M, and Kollias G (2020). The mesenchymal context in inflammation, immunity and cancer. Nat. Immunol 21, 974–982. 10.1038/s41590-020-0741-2. - DOI - PubMed
    1. Zhang F, Wei K, Slowikowski K, Fonseka CY, Rao DA, Kelly S, Goodman SM, Tabechian D, Hughes LB, Salomon-Escoto K, et al. (2019). Defining inflammatory cell states in rheumatoid arthritis joint synovial tissues by integrating single-cell transcriptomics and mass cytometry. Nat. Immunol 20, 928–942. 10.1038/s41590-019-0378-1. - DOI - PMC - PubMed
    1. Smillie CS, Biton M, Ordovas-Montanes J, Sullivan KM, Burgin G, Graham DB, Herbst RH, Rogel N, Slyper M, Waldman J, et al. (2019). Intra- and inter-cellular rewiring of the human colon during ulcerative colitis. Cell 178, 714–730.e22. 10.1016/j.cell.2019.06.029. - DOI - PMC - PubMed
    1. Habermann AC, Gutierrez AJ, Bui LT, Yahn SL, Winters NI, Calvi CL, Peter L, Chung MI, Taylor CJ, Jetter C, et al. (2020). Single-cell RNA sequencing reveals profibrotic roles of distinct epithelial and mesenchymal lineages in pulmonary fibrosis. Sci. Adv 6, eaba1972. 10.1126/sciadv.aba1972. - DOI - PMC - PubMed
    1. Adams TS, Schupp JC, Poli S, Ayaub EA, Neumark N, Ahangari F, Chu SG, Raby BA, DeIuliis G, Januszyk M, et al. (2020). Single-cell RNA-seq reveals ectopic and aberrant lung-resident cell populations in idiopathic pulmonary fibrosis. Sci. Adv 6, eaba1983. 10.1126/sciadv.aba1983. - DOI - PMC - PubMed

Publication types