. 2022 Jun 9;185(12):2184-2199.e16.
doi: 10.1016/j.cell.2022.04.038. Epub 2022 May 31.

Glioma progression is shaped by genetic evolution and microenvironment interactions

Collaborators, Affiliations

Glioma progression is shaped by genetic evolution and microenvironment interactions

Frederick S Varn et al. Cell. .

Abstract

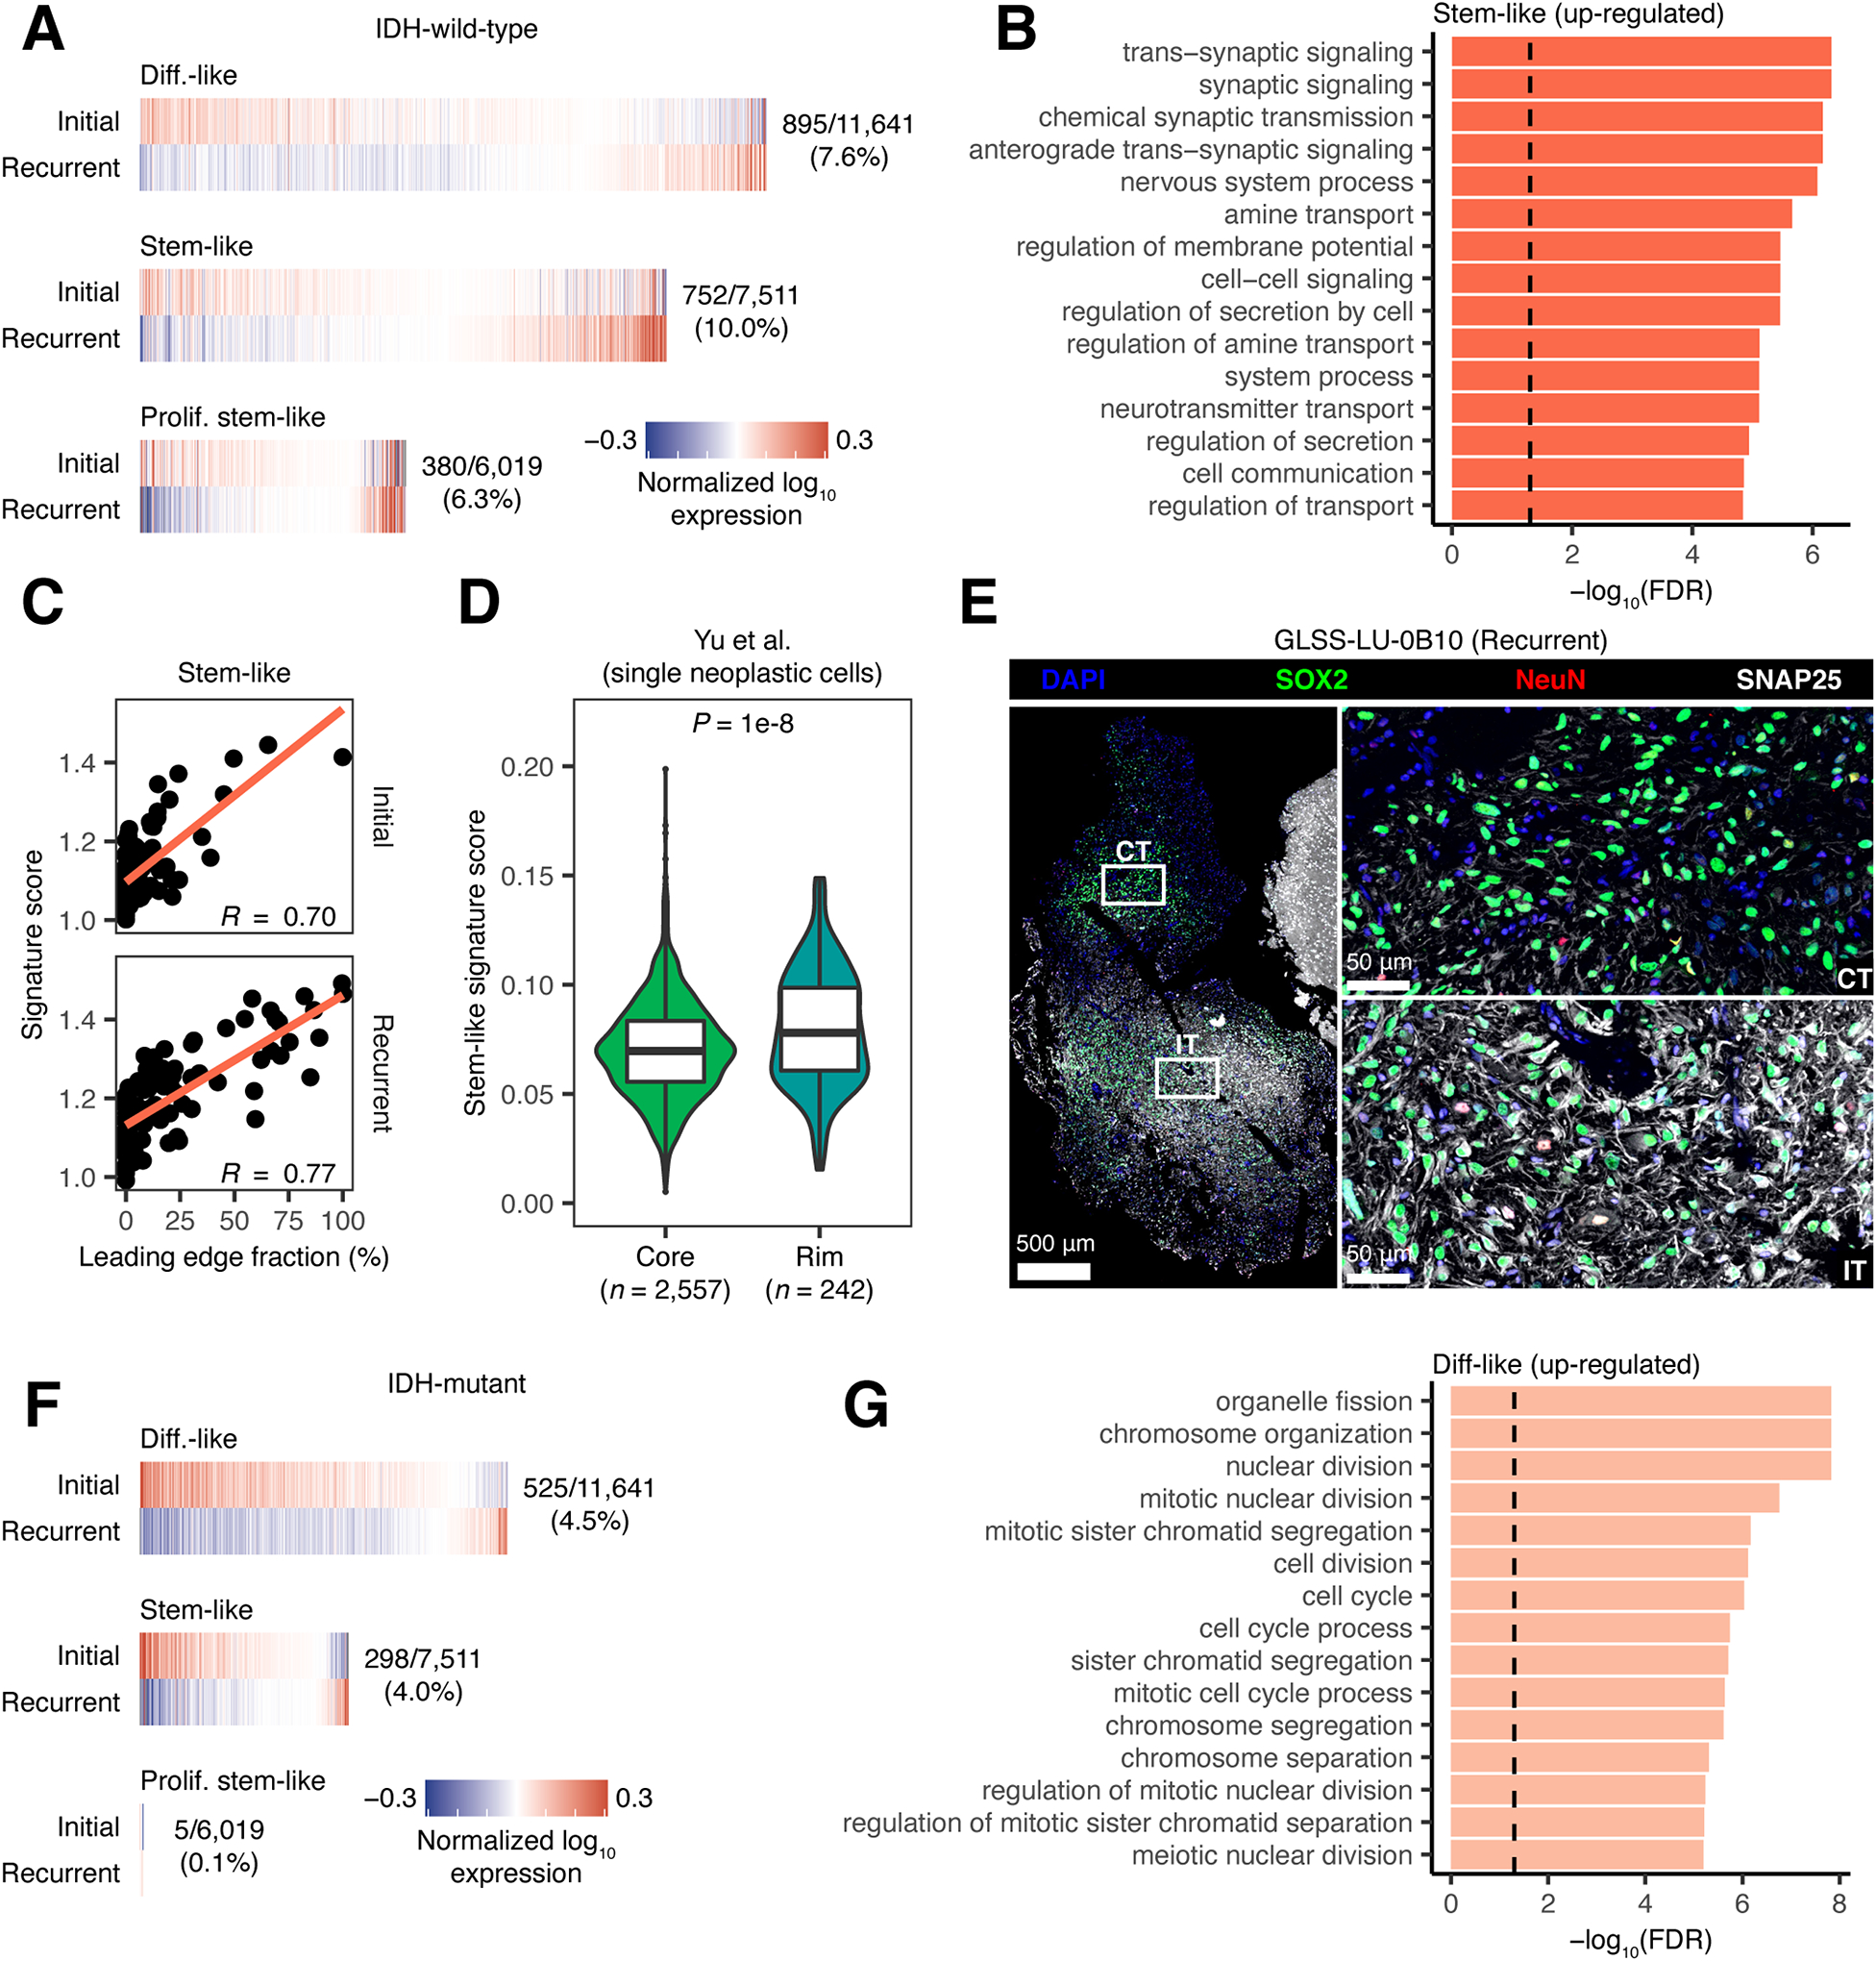
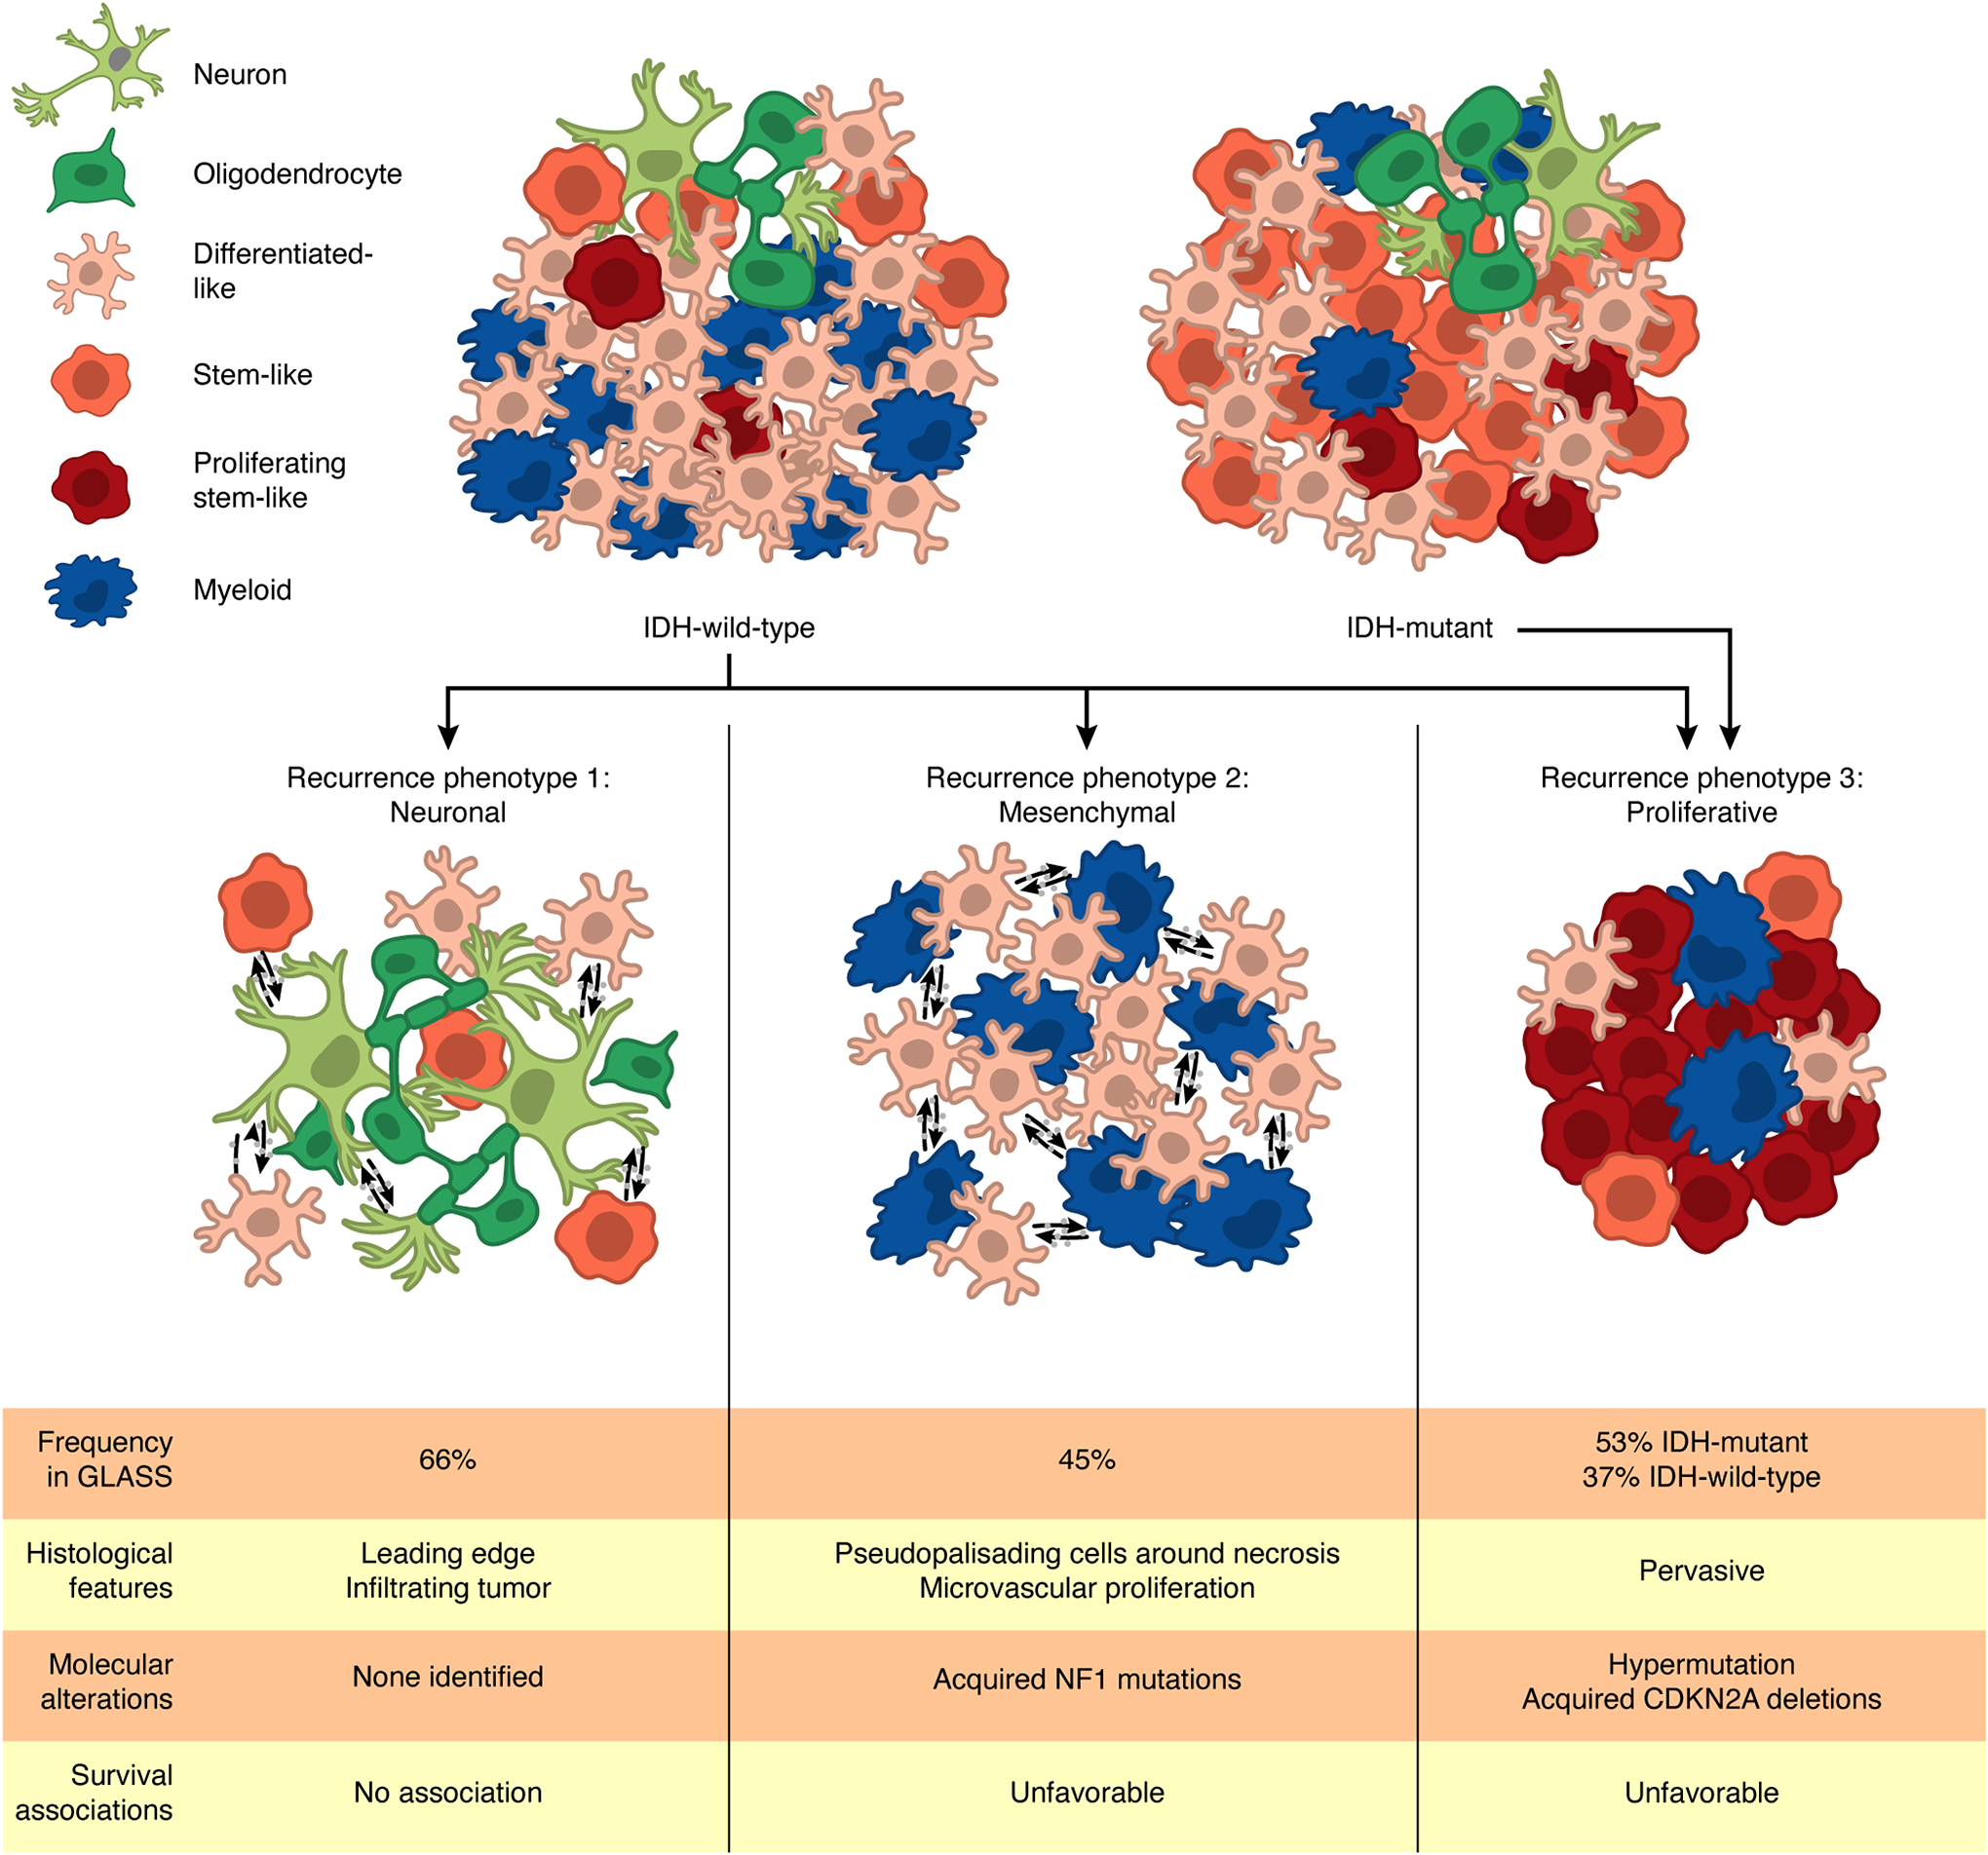
The factors driving therapy resistance in diffuse glioma remain poorly understood. To identify treatment-associated cellular and genetic changes, we analyzed RNA and/or DNA sequencing data from the temporally separated tumor pairs of 304 adult patients with isocitrate dehydrogenase (IDH)-wild-type and IDH-mutant glioma. Tumors recurred in distinct manners that were dependent on IDH mutation status and attributable to changes in histological feature composition, somatic alterations, and microenvironment interactions. Hypermutation and acquired CDKN2A deletions were associated with an increase in proliferating neoplastic cells at recurrence in both glioma subtypes, reflecting active tumor growth. IDH-wild-type tumors were more invasive at recurrence, and their neoplastic cells exhibited increased expression of neuronal signaling programs that reflected a possible role for neuronal interactions in promoting glioma progression. Mesenchymal transition was associated with the presence of a myeloid cell state defined by specific ligand-receptor interactions with neoplastic cells. Collectively, these recurrence-associated phenotypes represent potential targets to alter disease progression.

Keywords: genomics; glioblastoma; glioma; hypermutation; macrophages; microenvironment; neurons; single-cell; spatial imaging; treatment resistance.


Conflict of interest statement

Declaration of interests R.G.W.V. is a co-founder of Boundless Bio and a consultant for Stellanova Therapeutics. M.K. has received research funding from AbbVie and Bristol Myers Squibb, and he is on the advisory board for Janssen; he has received honoraria from the Jackson Laboratory. D.R.O. has received funding from Integra and Agios. F.P.B. has performed consulting for Bristol Myers Squibb. M.W. has received research grants from AbbVie, Adastra, Apogenix, Merck, Sharp & Dohme, Novocure, and Quercis and honoraria for lectures or advisory board participation or consulting from AbbVie, Adastra, Basilea, Bristol Meyer Squibb, Celgene, Medac, Merck, Sharp & Dohme, Merck, Nerviano Medical Sciences, Novartis, Orbus, Philogen, Roche, Tocagen, and yMabs. A.M.E.W. reported receiving institutional financial support for an advisory role from Polyphor, IPSEN, Karyopharm, and Novartis; unrestricted research grants from IPSEN and Novartis; and study budgets from AbbVie, BMS, Genzyme, Karyopharm Therapeutics, and Roche, all outside the submitted work. H.K.G. has performed consulting for AbbVie, and he is a member of the speaker bureau for AbbVie and Igynta. K.P. is a scientific advisory board member and owns stock in Cue BioPharma.

Figures

Figure 1.
Figure 1.. Longitudinal cellular heterogeneity in glioma.
(A) Each column represents an initial (I) and recurrent (R) tumor pair. Pairs are arranged based on the combined representation of the proneural and mesenchymal subtypes in their initial tumors. The first track indicates whole exome (WXS) or whole genome sequencing (WGS) data availability. The next three tracks indicate bulk subtype signature representation. Stacked bar plots indicate cell state composition based on the single cell-based deconvolution method, CIBERSORTx. (B) Sankey plot indicating whether the highest-scoring transcriptional subtype changed at recurrence. Numbers in parentheses indicate number of samples of each subtype: proneural (Pro.), classical (Class.) and mesenchymal (Mes.). (C) Left: Average cell state composition of transcriptional subtypes (left) and initial and recurrent tumors by IDH status (right). See also Figure S1 and Tables S1, S2, and S3.
Figure 2.
Figure 2.. Histological features underlie subtype switching and cell state changes at recurrence.
(A) Cell state composition of each of the reference histology-defined Ivy GAP features across 10 patients. Each patient is indicated by a different color in the patient track. (B) Left: Average histological feature composition of transcriptional subtypes (left) and initial and recurrent tumors by IDH status (right) in GLASS. (C) Heatmap depicting the changes in each histological feature between initial and recurrent tumors undergoing the indicated subtype transition. The initial subtype is indicated in the columns and the recurrent subtype is indicated in the rows. Colors represent the change in fraction of the indicated features. (D) Heatmap depicting the Pearson correlation coefficients measuring the association between the change in a histological feature and the change in a cell state when going from an initial tumor to recurrence. In (C) and (D) * indicates a significant correlation (P < 0.05). (E) Left: Ladder plot depicting the change in the adjusted stem-like cell proportion between paired initial and recurrent tumors undergoing a proneural-to-mesenchymal transition. Right: The average adjusted neoplastic cell proportions for the tumor pairs outlined on the left. Neoplastic cell proportions were adjusted for the presence of non-neoplastic cells as well as non-cellular tumor content. See also Figure S2 and Table S4.
Figure 3.
Figure 3.. Acquired somatic alterations at recurrence associate with changes in cellular composition.
(A) Left: Ladder plot depicting the change in the proliferating stem-like cell proportion between paired initial and recurrent IDHmut tumors that acquired CDKN2A deletions or CCND2 amplifications. Right: Stacked bar plot depicting the average proportions of each cell state for the tumor pairs in the ladder plots. (B) Left: Representative multiplex immunofluorescence images from a matched initial and recurrent IDHmut tumor pair that acquired a CDKN2A deletion at recurrence. Right: Stacked bar plot depicting the proportion of SOX2+/Ki67+ cells among all SOX2+ cells across the entire tissue section for each sample. (C) Top: Ladder plots depicting the change in the proliferating stem-like cell proportion between paired initial and recurrent tumors, stratified by hypermutation status. Paired t-test P-values are indicated. Bottom: Average proportions of each cell state for the tumor pairs outlined above. (D) Left: Representative multiplex immunofluorescence images from a matched initial and recurrent IDHwt tumor pair that was hypermutated at recurrence. Right: Stacked bar plot depicting the proportion of SOX2+/Ki67+ cells among all SOX2+ cells across the entire tissue section for each sample. (E) Change in proliferating stem-like cell fraction between initial and recurrent tumors from IDHmut tumor pairs. (F) Kaplan-Meier plot depicting the survival distributions of patients that exhibited an increase or non-increase in proliferating stem-like cells at recurrence. P-value from log-rank test. In (B) and (D), scale bars represent 50 μm. See also Figure S3.
Figure 4.
Figure 4.. Neuronal signaling activity is increased in recurrent IDHwt tumors.
(A) Heatmaps depicting the average normalized log10 expression level of genes that were differentially expressed between neoplastic cell states from initial and recurrent IDHwt tumors that received treatment. Fractions indicate the number of differentially expressed genes out of the number of genes inferred for that cell state’s profile. (B) Bar plot depicting the −log10(FDR) from a GO enrichment analysis of the genes significantly up-regulated at recurrence in stem-like neoplastic cell-specific gene expression profiles from IDHwt tumors. (C) Scatterplot depicting the association between leading edge fraction and the average expression of the stem-like neoplastic cell recurrence signature for samples in the GLASS dataset. (D) Violin plot depicting the average expression of the stem-like neoplastic cell recurrence signature in neoplastic single-cells collected from the invasive rim and tumor core of 9 grade 4 gliomas (Yu et al., 2020). P-value from Wilcoxon rank-sum test. (E) Multiplex immunofluorescence images of the interface between the cellular tumor (top right; CT) and infiltrating tumor (bottom right; IT) histological features in a recurrent IDHwt tumor. Histological features were defined by a neuropathologist using the H&E image in Figure S4F. (F) Heatmaps depicting the average normalized log10 expression level of genes that were differentially expressed between neoplastic cell states from initial and recurrent IDHmut tumors that received treatment. Fractions are as outlined in (A). (G) Bar plot depicting the −log10(FDR) from a GO enrichment analysis of the genes significantly up-regulated at recurrence in differentiated-like neoplastic cell-specific gene expression profiles from IDHmut tumors. In (B) and (G), dashed line corresponds to FDR < 0.05. See also Figure S4 and Table S5.
Figure 5.
Figure 5.. Mesenchymal tumors exhibit a distinct myeloid cell phenotype.
(A) Left: Uniform Manifold Approximation and Projection (UMAP) dimensionality reduction plot of the CIBERSORTx-inferred myeloid profiles from TCGA. Right: UMAP plot colored based on the relative mean expression of macrophage and microglia signatures. (B) Box and ladder plots depicting the difference in the mean expression of the indicated signatures between initial and recurrent IDHmut tumors from GLASS that do and do not recur at higher grades. *** indicates Wilcoxon signed-rank test P-value < 1e-3. (C) Heatmap depicting the normalized expression z-score of genes that were differentially expressed between myeloid cells from mesenchymal and non-mesenchymal TCGA tumors. Top sidebar indicates the bulk mesenchymal score of each sample divided by 1,000. Right sidebar indicates the −log10 Wilcoxon rank-sum test FDR of the association for each gene. Bottom sidebar indicates the transcriptional subtype of each sample per panel (A). (D) Box and ladder plots depicting the difference in the mean expression of the mesenchymal myeloid signature between initial and recurrent IDHwt tumors undergoing a mesenchymal transition in GLASS. **** indicates Wilcoxon signed-rank test P < 1e-5. (E) Boxplot depicting the mean mesenchymal myeloid signature expression for CIBERSORTx-inferred myeloid profiles from different histological features in the Ivy GAP dataset: leading edge (LE), infiltrating tumor (IT), cellular tumor (CT), pseudopalisading cells around necrosis (PAN), and microvascular proliferation (MVP). (F) Representative multiplex immunofluorescence images of myeloid cells near blood vessels from classical (left) and mesenchymal (right) IDHwt tumors. Scale bars represent 20 μm. See also Figure S5 and Tables S6, S7, and S8.
Figure 6.
Figure 6.. Antigen presentation is disrupted at recurrence in IDHmut-noncodel glioma.
(A) Left: Sankey plots indicating whether a tumor pair acquires or loses HLA LOH at recurrence. Colored lines indicate HLA LOH in the initial tumor, dark gray lines indicate acquired HLA LOH. Right: Stacked bar plot indicating the proportion of samples for each glioma subtype that acquired HLA LOH at recurrence. * Fisher’s exact test P-value < 0.05. (B) Violin plot depicting the difference in T cell proportion in samples with and without HLA LOH. P-values from t-test. (C) Left: Ladder plots depicting the change in SCNA burden between paired initial and recurrent IDHmut-noncodel tumors that did and did not acquire HLA LOH. P-values from Wilcoxon signed-rank test. Right: Boxplot depicting the difference in the change in SCNA burden between IDHmut-noncodel tumor pairs that did and did not acquire HLA LOH. P-value from Wilcoxon rank-sum test. See also Figure S6.
Figure 7.
Figure 7.. Recurrent diffuse gliomas can be grouped into three recurrence phenotypes.
Analysis of the GLASS dataset reveals that recurrent IDHwt and IDHmut tumors can be grouped into three recurrence phenotypes: neuronal, mesenchymal, and proliferative. Each of these phenotypes is associated with specific cellular and histological features and molecular alterations with some also associating with poor patient survival. Some tumors can exhibit multiple phenotypes at once. Frequencies of the neuronal, mesenchymal, and proliferative phenotypes in the GLASS cohort were determined based on the number of recurrent samples that exhibited increased oligodendrocyte content, were classified as the mesenchymal transcriptional subtype, and increased proliferating stem-like content, respectively.

References

    1. Bakas S, Ormond DR, Alfaro-Munoz KD, Smits M, Cooper LAD, Verhaak R, and Poisson LM (2020). iGLASS: imaging integration into the Glioma Longitudinal Analysis Consortium. Neuro Oncol 22, 1545–1546. - PMC - PubMed
    1. Barthel FP, Johnson KC, Varn FS, Moskalik AD, Tanner G, Kocakavuk E, Anderson KJ, Abiola O, Aldape K, Alfaro KD, et al. (2019). Longitudinal molecular trajectories of diffuse glioma in adults. Nature 576, 112–120. - PMC - PubMed
    1. Bhaduri A, Di Lullo E, Jung D, Muller S, Crouch EE, Espinosa CS, Ozawa T, Alvarado B, Spatazza J, Cadwell CR, et al. (2020). Outer Radial Glia-like Cancer Stem Cells Contribute to Heterogeneity of Glioblastoma. Cell Stem Cell 26, 48–63 e46. - PMC - PubMed
    1. Bhat KPL, Balasubramaniyan V, Vaillant B, Ezhilarasan R, Hummelink K, Hollingsworth F, Wani K, Heathcock L, James JD, Goodman LD, et al. (2013). Mesenchymal differentiation mediated by NF-kappaB promotes radiation resistance in glioblastoma. Cancer Cell 24, 331–346. - PMC - PubMed
    1. Bray NL, Pimentel H, Melsted P, and Pachter L (2016). Near-optimal probabilistic RNA-seq quantification. Nat Biotechnol 34, 525–527. - PubMed

Publication types

Substances