

Numerical simulation of wave propagation through interfaces using the extended finite element method for magnetic resonance elastography
- PMID: 35649898
- PMCID: PMC9381142
- DOI: 10.1121/10.0011392
Numerical simulation of wave propagation through interfaces using the extended finite element method for magnetic resonance elastography
Abstract
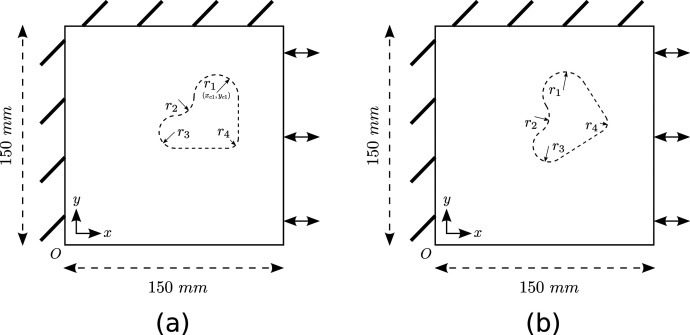
Magnetic resonance elastography (MRE) is an elasticity imaging technique for quantitatively assessing the stiffness of human tissues. In MRE, finite element method (FEM) is widely used for modeling wave propagation and stiffness reconstruction. However, in front of inclusions with complex interfaces, FEM can become burdensome in terms of the model partition and computationally expensive. In this work, we implement a formulation of FEM, known as the eXtended finite element method (XFEM), which is a method used for modeling discontinuity like crack and heterogeneity. Using a level-set method, it makes the interface independent of the mesh, thus relieving the meshing efforts. We investigate this method in two studies: wave propagation across an oblique linear interface and stiffness reconstruction of a random-shape inclusion. In the first study, numerical results by XFEM and FEM models revealing the wave conversion rules at linear interface are presented and successfully compared to the theoretical predictions. The second study, investigated in a pseudo-practical application, demonstrates further the applicability of XFEM in MRE and the convenience, accuracy, and speed of XFEM with respect to FEM. XFEM can be regarded as a promising alternative to FEM for inclusion modeling in MRE.
Figures


Similar articles
-
Assessing liver fibrosis distribution through liver elasticity estimates obtained using a biomechanical model of respiratory motion with magnetic resonance elastography.Phys Med Biol. 2022 Jul 19;67(15). doi: 10.1088/1361-6560/ac7d35. Phys Med Biol. 2022. PMID: 35767984
-
Identification process based on shear wave propagation within a phantom using finite element modelling and magnetic resonance elastography.Comput Methods Biomech Biomed Engin. 2015;18(5):485-91. doi: 10.1080/10255842.2013.818664. Epub 2013 Aug 15. Comput Methods Biomech Biomed Engin. 2015. PMID: 23947476
-
Robustness of MR Elastography in the Healthy Brain: Repeatability, Reliability, and Effect of Different Reconstruction Methods.J Magn Reson Imaging. 2021 May;53(5):1510-1521. doi: 10.1002/jmri.27475. Epub 2021 Jan 5. J Magn Reson Imaging. 2021. PMID: 33403750
-
XFEM for Composites, Biological, and Bioinspired Materials: A Review.Materials (Basel). 2024 Feb 4;17(3):745. doi: 10.3390/ma17030745. Materials (Basel). 2024. PMID: 38591618 Free PMC article. Review.
-
Diagnostic accuracy of elastography and magnetic resonance imaging in patients with NAFLD: A systematic review and meta-analysis.J Hepatol. 2021 Oct;75(4):770-785. doi: 10.1016/j.jhep.2021.04.044. Epub 2021 May 13. J Hepatol. 2021. PMID: 33991635
References
-
- Hirsch S., Braun J., and Sack I., Magnetic Resonance Elastography: Physical Background and Medical Applications ( John Wiley & Sons, Weinheim, Germany, 2017), Chaps. 3–4.
Publication types
MeSH terms
Grants and funding
LinkOut - more resources
Full Text Sources