. 2022 Jun 1;13(1):3053.
doi: 10.1038/s41467-022-30556-5.

Characterisation of a nucleo-adhesome

Affiliations

Characterisation of a nucleo-adhesome

Adam Byron et al. Nat Commun. .

Abstract

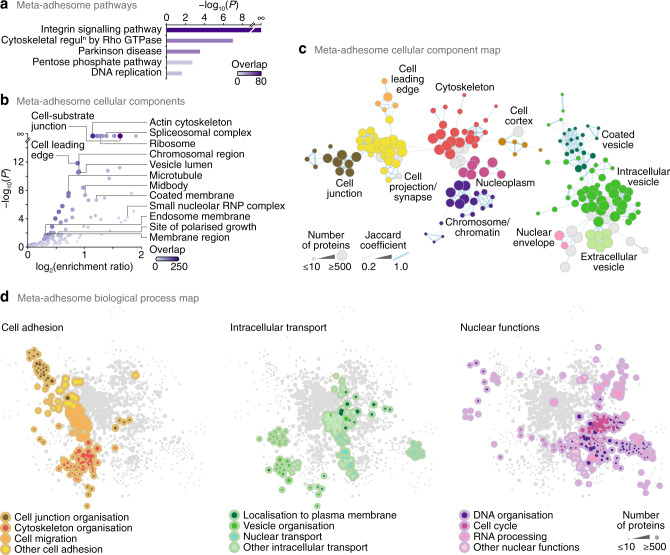
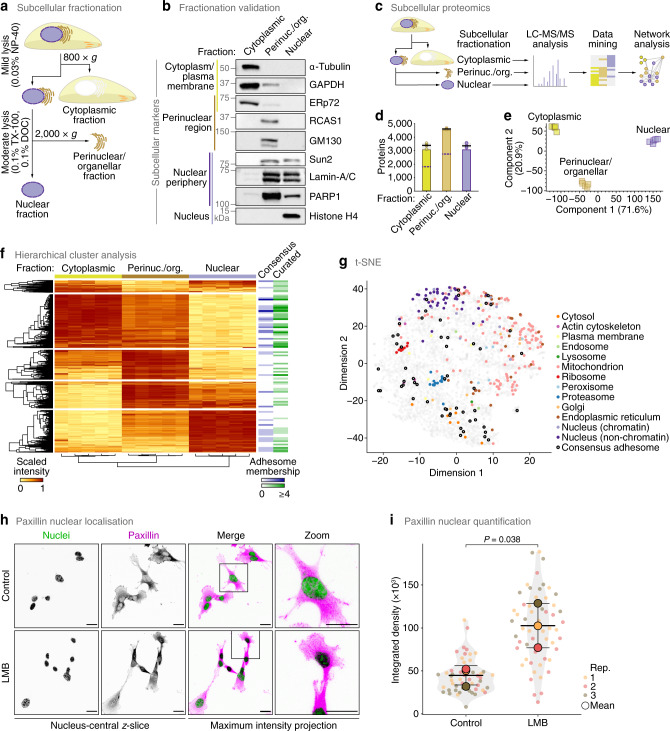
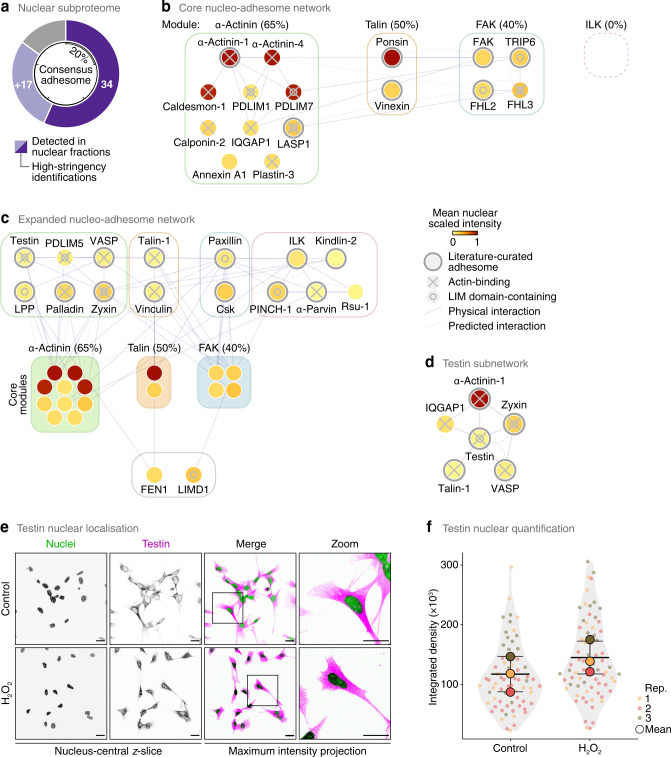
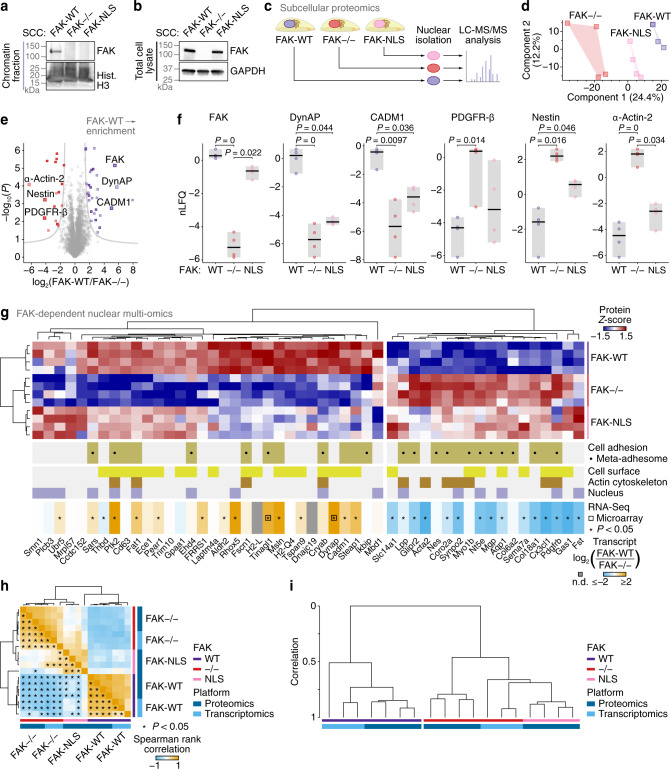
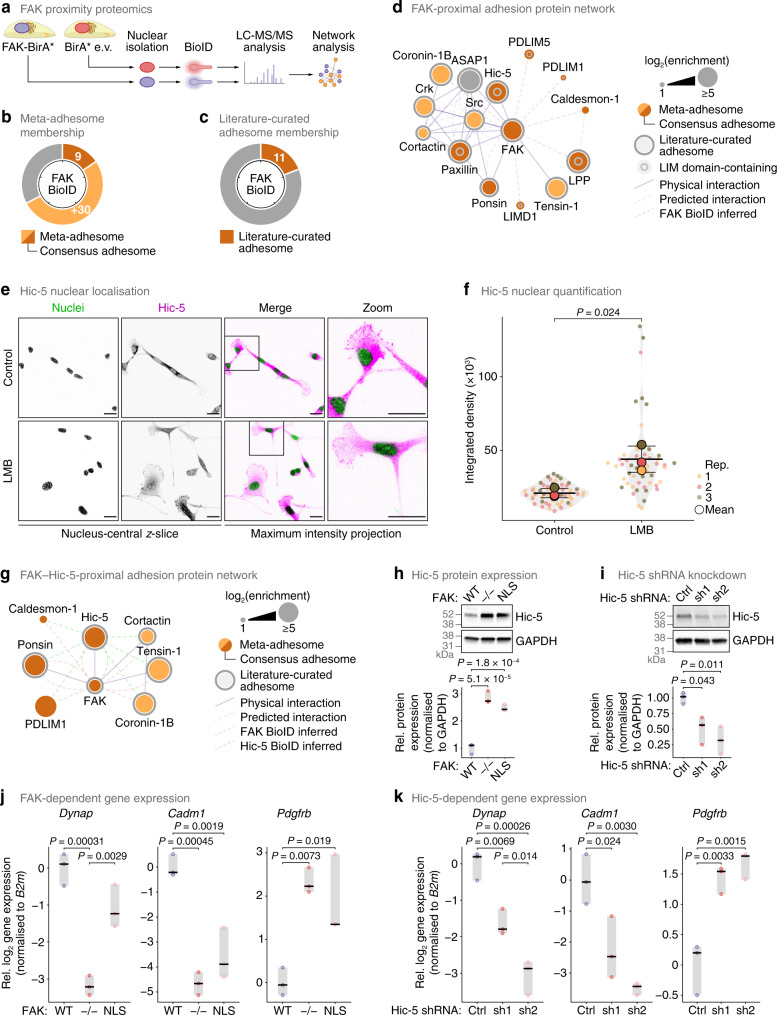
In addition to central functions in cell adhesion signalling, integrin-associated proteins have wider roles at sites distal to adhesion receptors. In experimentally defined adhesomes, we noticed that there is clear enrichment of proteins that localise to the nucleus, and conversely, we now report that nuclear proteomes contain a class of adhesome components that localise to the nucleus. We here define a nucleo-adhesome, providing experimental evidence for a remarkable scale of nuclear localisation of adhesion proteins, establishing a framework for interrogating nuclear adhesion protein functions. Adding to nuclear FAK's known roles in regulating transcription, we now show that nuclear FAK regulates expression of many adhesion-related proteins that localise to the nucleus and that nuclear FAK binds to the adhesome component and nuclear protein Hic-5. FAK and Hic-5 work together in the nucleus, co-regulating a subset of genes transcriptionally. We demonstrate the principle that there are subcomplexes of nuclear adhesion proteins that cooperate to control transcription.


Conflict of interest statement

The authors declare no competing interests.

Figures

Fig. 1
Fig. 1. Nucleus-associated adhesome proteins.
a, b Over-representation analyses of PANTHER pathways (a) and Gene Ontology cellular components (b) in the meta-adhesome. Representative labelled terms were determined using affinity propagation, except for the terms cell-substrate junction and cell leading edge. Purple shading intensity indicates size of meta-adhesome protein overlap with respective gene sets. For a, terms with enrichment ratio (observed genes/expected genes in gene set) > 2 are displayed (P < 0.025, one-sided hypergeometric test with Benjamini–Hochberg correction). RNP, ribonucleoprotein. c Graph-based clustering of over-represented cellular components in the meta-adhesome. A force-directed graph was generated from gene-set membership of enriched Gene Ontology terms (P < 0.01, one-sided hypergeometric test with Benjamini–Hochberg correction). Representative cellular components summarising selected clusters of enriched terms are labelled. Node (circle) size represents the number of meta-adhesome proteins annotated for each enriched term; node fill colour represents cellular component annotation. Edge (line) weight is proportional to the overlap of gene-set membership of connected nodes (Jaccard coefficient ≥ 0.2). The two largest connected components are shown (see also Supplementary Fig. 1b). d Graph-based clustering of over-represented biological processes in the meta-adhesome. Enriched Gene Ontology terms associated with cell adhesion (left panel), intracellular transport (middle panel) and nuclear functions (right panel) are coloured as indicated. The largest connected component is shown, and edges were omitted for clarity (see Supplementary Fig. 1a).
Fig. 2
Fig. 2. Characterisation of a nucleo-adhesome.
a Methodological workflow for subcellular fractionation and enrichment of nuclei. DOC, sodium deoxycholate; TX-100, Triton X-100. b Effective subcellular fractionation of SCC cells. Markers for given subcellular locations are indicated. Immunoblots are representative of five independent experiments. c Workflow for mass spectrometric characterisation of cytoplasmic, perinuclear and nuclear subproteomes of SCC cells. d Numbers of proteins identified in each subcellular fraction. Black bar, median; light grey box, range; circle, replicate data point (n = 5 independent biological replicates). Numbers of proteins identified in at least four out of five biological replicate subcellular fractions are represented as bars. Purple dashed lines indicate numbers of proteins also identified in nuclear fractions (regardless of relative abundance). e Principal component analysis of proteins quantified in at least four out of five biological replicate experiments. f Hierarchical cluster analysis of the cytoplasmic, perinuclear and nuclear subproteomes. Relative protein abundance was min-max scaled protein-wise (scaled intensity). Memberships of the consensus adhesome and literature-curated adhesome are indicated (bins, 50 proteins). g t-SNE map of the subcellular proteomes (Supplementary Data 2) annotated with curated subcellular markers and consensus adhesome proteins. h Confocal imaging of SCC cells in the presence or absence of 10 nM leptomycin B (LMB). Nuclei were detected using NucBlue. z-slices passing through the centres of the nuclei (greyscale channels) are shown alongside maximum intensity projections (merged channels). Inverted lookup tables were applied; in merged images, colocalisation of paxillin (magenta) and NucBlue (green) is represented by black regions. Images are representative of three independent experiments. Scale bars, 20 μm. i Quantification of nuclear paxillin signal in nucleus-central z-slices (see h). Black bars, condition mean (thick bar) ± s.d. (thin bars); grey silhouette, probability density. Data from different biological replicates (rep.) are indicated by coloured circles; replicate means are indicated by large circles. Statistical analysis, two-sided Welch’s t-test of replicate means (n = 52 and 57 cells for control and LMB treatment, respectively, from n = 3 independent biological replicates). Source data are provided as a Source Data file.
Fig. 3
Fig. 3. Network analysis identifies testin as a nucleo-adhesome-associated protein.
a Proportion of the consensus adhesome quantified in SCC cell nuclear fractions. High-stringency proteins (dark purple segments) were identified in all five biological replicate experiments and quantified with a > 5% fraction of the cellular pool; light purple segments indicate additional proteins detected in nuclear fractions. Tick marks indicate 20% increments. b Curated interaction network model of high-stringency nuclear proteins present in the four putative signalling axes (modules) of the consensus adhesome. Coverage of each module is indicated in parentheses. c Curated core nucleo-adhesome network (see b) expanded to include additional consensus adhesome proteins detected In nuclear fractions. d Direct interaction neighbourhood of testin in the expanded nucleo-adhesome network (see c). For bd, node (circle) fill colour represents the mean scaled intensity of nuclear fraction replicates; thick grey node borders indicate representation in the literature-curated adhesome. Edges (lines) represent reported interactions. e Confocal imaging of SCC cells in the presence or absence of hydrogen peroxide (H2O2). Nuclei were detected using NucBlue. z-slices passing through the centres of the nuclei (greyscale channels) are shown alongside maximum intensity projections (merged channels). Inverted lookup tables were applied; in merged images, colocalisation of testin (magenta) and NucBlue (green) is represented by black regions. Images are representative of three independent experiments. Scale bars, 20 μm. f Quantification of nuclear testin signal in nucleus-central z-slices (see e). Black bars, condition mean (thick bar) ± s.d. (thin bars); grey silhouette, probability density. Data from different independent biological replicates (rep.) are indicated by coloured circles; replicate means are indicated by large circles. P > 0.05; statistical analysis, two-sided Welch’s t-test of replicate means (n = 67 and 72 cells for control and H2O2 treatment, respectively, from n = 3 independent biological replicates). Source data are provided as a Source Data file.
Fig. 4
Fig. 4. Integrative analysis of the FAK-dependent nuclear proteome.
a, b Chromatin extracts (a) and total cell lysates (b) from SCC cells that express FAK-WT or FAK-NLS or do not express FAK (FAK−/−). Immunoblots are representative of four independent experiments. Hist. H3, histone H3. c Workflow for mass spectrometric characterisation of the FAK-dependent nuclear subproteome of SCC cells. d Principal component analysis of proteins quantified in at least three out of four biological replicate experiments. e Volcano plot of the FAK-dependent nuclear subproteome (FAK-WT versus FAK−/−). Differentially enriched proteins are coloured (purple, enriched in SCC FAK-WT nuclei; red, enriched in SCC FAK−/− nuclei; P < 0.05, two-sided Student’s t-test with FDR correction). Data points representing differentially enriched cell adhesion proteins are indicated by dark shading. Cell adhesion proteins or those associated with the cytoskeleton that were differentially enriched by at least 16 fold are labelled (large data points). f Protein abundance in enriched nuclei of SCC FAK−/−, FAK-WT and FAK-NLS cells for proteins labelled in e. Black bar, median; light grey box, range. Statistical analysis, two-sided Student’s t-test with FDR correction (n = 4 independent biological replicates). g Hierarchical cluster analysis of the FAK-dependent nuclear subproteome. The FAK-dependent nuclear subproteome and FAK-dependent transcriptomes of SCC cells were integrated. Proteins are labelled with gene names for clarity. Open black squares indicate transcripts quantified by microarray analysis. n.d., not determined. *P < 0.05; statistical analysis, two-sided Wald test with Benjamini–Hochberg correction (n = 3 independent biological replicates); exact P values are provided in Supplementary Data 8. h Multi-omic correlation analysis. Spearman rank correlation coefficients for all pairwise sample comparisons in the integrated FAK-dependent nuclear multi-omic data were analysed by hierarchical clustering. *P < 0.05; statistical analysis, two-sided Spearman’s test; significant correlations are indicated for entries below the main diagonal of the symmetric matrix; exact P values are provided in Supplementary Data 9. i Integrative cluster analysis of the multi-omic dataset. The dendrogram scale represents correlation computed as 1 − d, where d = Euclidean distance. For full cluster analysis, see Supplementary Fig. 4. Source data are provided as a Source Data file.
Fig. 5
Fig. 5. Analysis of the FAK-proximal nuclear subproteome identifies nuclear interaction with Hic-5.
a Workflow for mass spectrometric characterisation of FAK-proximal nuclear proteins. b, c Proportions of specific FAK-proximal proteins (P < 0.05, one-sided Student’s t-test with FDR correction) quantified in the meta-adhesome, including the consensus adhesome (b), and the literature-curated adhesome (c). Tick marks indicate 20% increments. d Interaction network analysis of FAK-proximal nuclear proteins present in the consensus or literature-curated adhesomes, clustered according to connectivity (reported interactions or proximal associations inferred from BioID data; edges). e Confocal imaging of SCC cells in the presence or absence of 10 nM LMB, as for Fig. 2h, except magenta is Hic-5. Images are representative of three independent experiments. Scale bars, 20 μm. f Quantification of nuclear Hic-5 signal in nucleus-central z-slices (see e). Black bars, condition mean (thick bar) ± s.d. (thin bars); grey silhouette, probability density. Data from different independent biological replicates (rep.) are indicated by coloured circles; replicate means are indicated by large circles. Statistical analysis, two-sided Welch’s t-test of replicate means (n = 54 and 52 cells for control and LMB treatment, respectively, from n = 3 independent biological replicates). g Interaction network analysis of the intersection of specific FAK- and Hic-5-proximal nuclear proteins present in the consensus or literature-curated adhesomes, clustered as for d. h Total cell lysates from SCC cells (top) and quantification of Hic-5 protein expression (bottom). Protein expression was normalised to GAPDH and expressed relative to SCC FAK-WT. i Total cell lysates from SCC FAK-WT cells transfected with two independent Hic-5 shRNAs (sh1, sh2) or empty-vector control (Ctrl) (top) and quantification of Hic-5 protein expression (bottom, as for h). j, k RT-qPCR analyses of expression of selected genes identified by nuclear multi-omic analysis (see Fig. 4) in SCC cells (j) and cells depleted of Hic-5 (k). Gene expression was normalised to B2m, binary-logarithm transformed and expressed relative to FAK-WT (j) or Ctrl (k) cells. For hk, black bar, median; light grey box, range. Statistical analysis, one-way ANOVA with Tukey’s correction (n = 3 independent biological replicates). Source data are provided as a Source Data file.

References

    1. Green HJ, Brown NH. Integrin intracellular machinery in action. Exp. Cell Res. 2019;378:226–231. doi: 10.1016/j.yexcr.2019.03.011. - DOI - PubMed
    1. Humphries JD, Chastney MR, Askari JA, Humphries MJ. Signal transduction via integrin adhesion complexes. Curr. Opin. Cell Biol. 2019;56:14–21. doi: 10.1016/j.ceb.2018.08.004. - DOI - PubMed
    1. Kechagia JZ, Ivaska J, Roca-Cusachs P. Integrins as biomechanical sensors of the microenvironment. Nat. Rev. Mol. Cell Biol. 2019;20:457–473. doi: 10.1038/s41580-019-0134-2. - DOI - PubMed
    1. Byron A, Frame MC. Adhesion protein networks reveal functions proximal and distal to cell-matrix contacts. Curr. Opin. Cell Biol. 2016;39:93–100. doi: 10.1016/j.ceb.2016.02.013. - DOI - PMC - PubMed
    1. Doyle AD, Yamada KM. Mechanosensing via cell-matrix adhesions in 3D microenvironments. Exp. Cell Res. 2016;343:60–66. doi: 10.1016/j.yexcr.2015.10.033. - DOI - PMC - PubMed

Publication types