. 2022 Jun 1;12(1):9115.
doi: 10.1038/s41598-022-13318-7.

Theta but not beta activity is modulated by freedom of choice during action selection

Affiliations

Theta but not beta activity is modulated by freedom of choice during action selection

Emeline Pierrieau et al. Sci Rep. .

Abstract

Large-scale neurophysiological markers of action competition have been almost exclusively investigated in the context of instructed choices, hence it remains unclear whether these markers also apply to free choices. This study aimed to compare the specific brain dynamics underlying instructed and free decisions. Electroencephalography (EEG) was recorded while 31 participants performed a target selection task; the choice relied either on stimulus-response mappings (instructed) or on participants' preferences (free). Choice difficulty was increased by introducing distractors in the informative stimulus in instructed choices, and by presenting targets with similar motor costs in free choices. Results revealed that increased decision difficulty was associated with higher reaction times (RTs) in instructed choices and greater choice uncertainty in free choices. Midfrontal EEG theta (4-8 Hz) power increased with difficulty in instructed choices, but not in free choices. Although sensorimotor beta (15-30 Hz) power was correlated with RTs, it was not significantly influenced by choice context or difficulty. These results suggest that midfrontal theta power may specifically increase with difficulty in externally-driven choices, whereas sensorimotor beta power may be predictive of RTs in both externally- and internally-driven choices.


Conflict of interest statement

The authors declare no competing interests.

Figures

Figure 1
Figure 1
Experimental design. (A) Preliminary test. On the left, the scheme represents participants’ placement and the manipulandum used. Participants were asked to grasp a handle (gray cylinder) located below the screen with their right hand, which position was displayed on the screen in real time with a cursor (white dot). Black rectangles are schematic representations of the screen displayed in front of participants. The trial started with the appearance of a red fixation cross and the starting point (gray dot). Once participants placed their cursor into the starting point for 1.5 to 2.5 s, two targets appeared on the screen. The location of the left target varied across trials (all possible locations are represented with the dotted blue circles). The percentage of right target choices as a function of left target locations was fitted with a psychometric function to extract the PSE (i.e., left target location corresponding to the 50th percentile of right target choice). (B) Test. Participants’ placement was similar to the one used in the preliminary test. Trial timeline was also similar, except that at target onset the red fixation cross turned into a stimulus indicating the choice context (arrows: instructed, lines: free) and the direction of the target to reach in the case of an instructed choice (direction indicated by the central arrow). Movement onset was considered as the first time point at which the position of the cursor was located outside of the starting point. If the cursor ended inside of one of the two presented targets in free choices or inside of the target indicated by the central arrow in the case of instructed choices, the selected target turned green.
Figure 2
Figure 2
Effects of context and difficulty on RTs and target choices. (A) Average RT per condition. (B) Proportion of right target choices in Free, according to Difficulty. The dotted line indicates 50% of right target choices or PSE (right target chosen equally often than left). (C) Proportion of right target choices in Free Hard trials according to the target chosen in the immediately preceding trial (hatched bar = right target chosen, dotted bar = left target chosen). n.s. = non-significant p-value (p > 0.05), *p < 0.05, **p < 0.01, ***p < 0.001.
Figure 3
Figure 3
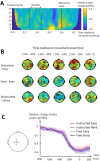
Fluctuations of theta power as a function of Context and Difficulty. (A) Time–frequency plot of the mean difference in spectral power between ΔInstructed and ΔFree at midfrontal electrodes (Fz, F1, F2). Data from the entire epoch is represented (−1.2 to 1.6 s around stimulus onset, indicated by the solid black line). This spectral power was computed as the relative change from a baseline period, corresponding to 0.5 to 0 s before stimulus onset (period separating the dotted and solid black lines). (B) Results of the cluster-based permutation tests for each paired comparison showing significant clusters. Each topographical plot represents the average difference in theta power between the tested conditions for each electrode in 100-ms windows, time-locked to stimulus onset. Hot colors indicate an increase and cold colors a decrease in theta power. Black dots indicate electrodes belonging to a significant positive cluster (theta increase) and white dots indicate electrodes belonging to a significant negative cluster (theta decrease). Δ refers to the difference associated with Difficulty (Hard–Easy). (C) On the left panel, black dots indicate the electrodes used as the midfrontal cluster (Fz, F1, F2). On the right panel, the plot shows the average baseline-normalized theta power at the midfrontal cluster as a function of time. Time is reported according to stimulus onset.
Figure 4
Figure 4
Correlations between theta power and RT difference associated with Difficulty in Instructed and Free. (A) Topographical representation of Spearman’s coefficients of the correlation between the difference in baseline-normalized theta power and RT in Instructed as a function of Difficulty (Instructed Hard–Instructed Easy) performed on each electrode separately. Each topographical plot represents the average Spearman’s coefficient in 100-ms windows defined according to target onset. Black dots indicate the electrodes with the highest absolute coefficient, specifically represented in B. (B) Linear fit between the difference in baseline-normalized theta power at parietal electrodes (CPz, CP1, CP3) and the difference in RT in Instructed as a function of Difficulty. (C) Topographical representation of Spearman’s coefficients of the correlation between the difference in baseline-normalized theta power and RT in Free as a function of Difficulty (Free Hard–Free Easy) performed on each electrode separately. Black dots indicate the electrodes with the highest absolute coefficient, specifically represented in D. (D) Linear fit between the difference in baseline-normalized theta power at midfrontal/left premotor electrodes (Fz, F1, FC1) and the difference in RT in Free as a function of Difficulty.
Figure 5
Figure 5
Fluctuations of beta power as a function of Context and Difficulty. (A) Time–frequency plot of the mean difference in spectral power between ΔInstructed and ΔFree at left sensorimotor electrodes (C1, FC1, C3, Cz, CP1). Data from the entire epoch is represented (−2.0 to 0.8 s around movement onset, indicated by the solid black line). This spectral power was computed as the relative change from a baseline period, corresponding to 1.3 to 0.8 s before movement onset (period separating the dotted black lines). (B) Results of the cluster-based permutation tests for each paired comparison. Each topographical plot represents the average difference in beta power between the tested conditions for each electrode in 100-ms windows, reported according to movement onset. Hot colors indicate an increase and cold colors a decrease in beta power. Black dots indicate electrodes belonging to a significant positive cluster (beta increase) and white dots indicate electrodes belonging to a significant negative cluster (beta decrease). Δ refers to the difference associated with Difficulty (Hard–Easy). (C) On the left panel, black dots indicate the electrodes used as the contralateral motor cluster (C1, C3, Cz, FC1, CP1). On the right panel, the plot shows average baseline-normalized beta power at this contralateral motor cluster as a function of time. Time is reported according to movement onset.
Figure 6
Figure 6
Correlations between beta power and RT difference associated with Difficulty in Instructed and Free. (A) Topographical representation of Spearman’s coefficients of correlation between the difference in baseline-normalized beta power and RT in Instructed as a function of Difficulty (Instructed Hard–Instructed Easy) performed on each electrode separately. Each topographical plot represents the average Spearman’s coefficient in 100-ms windows defined according to movement onset. Black dots indicate the electrodes with the highest absolute coefficient, specifically represented in B. (B) Linear fit between the difference in baseline-normalized beta power at left parietal electrodes (P1, P3, P5) and the difference in RT in Instructed as a function of Difficulty. (C) Topographical representation of Spearman’s coefficients of correlation between the difference in baseline-normalized beta power and RT in Free as a function of Difficulty (Free Hard–Free Easy) performed on each electrode separately. Black dots indicate the electrodes with the highest absolute coefficient, specifically represented in D. (D) Linear fit between the difference in baseline-normalized beta power at left parietal electrodes (P1, P3, P5) and the difference in RT in Free as a function of Difficulty.

Similar articles

Cited by

References

    1. Usher M, McClelland JL. The time course of perceptual choice: The leaky, competing accumulator model. Psychol. Rev. 2001;108:550–592. doi: 10.1037/0033-295X.108.3.550. - DOI - PubMed
    1. Cisek P. Cortical mechanisms of action selection: the affordance competition hypothesis. Philos. Trans. R. Soc. Lond. B Biol. Sci. 2007;362:1585–1599. doi: 10.1098/rstb.2007.2054. - DOI - PMC - PubMed
    1. Wispinski NJ, Gallivan JP, Chapman CS. Models, movements, and minds: Bridging the gap between decision making and action. Ann. N. Y. Acad. Sci. 2020;1464:30–51. doi: 10.1111/nyas.13973. - DOI - PubMed
    1. Hunt LT, Hayden BY. A distributed, hierarchical and recurrent framework for reward-based choice. Nat. Rev. Neurosci. 2017;18:172–182. doi: 10.1038/nrn.2017.7. - DOI - PMC - PubMed
    1. Ballesta S, Padoa-Schioppa C. Economic decisions through circuit inhibition. Curr. Biol. 2019;29:3814–3824. doi: 10.1016/j.cub.2019.09.027. - DOI - PMC - PubMed

Publication types