. 2022 Jun;606(7912):94-101.
doi: 10.1038/s41586-022-04615-2. Epub 2022 Jun 1.

A tissue-like neurotransmitter sensor for the brain and gut

Affiliations

A tissue-like neurotransmitter sensor for the brain and gut

Jinxing Li et al. Nature. 2022 Jun.

Abstract

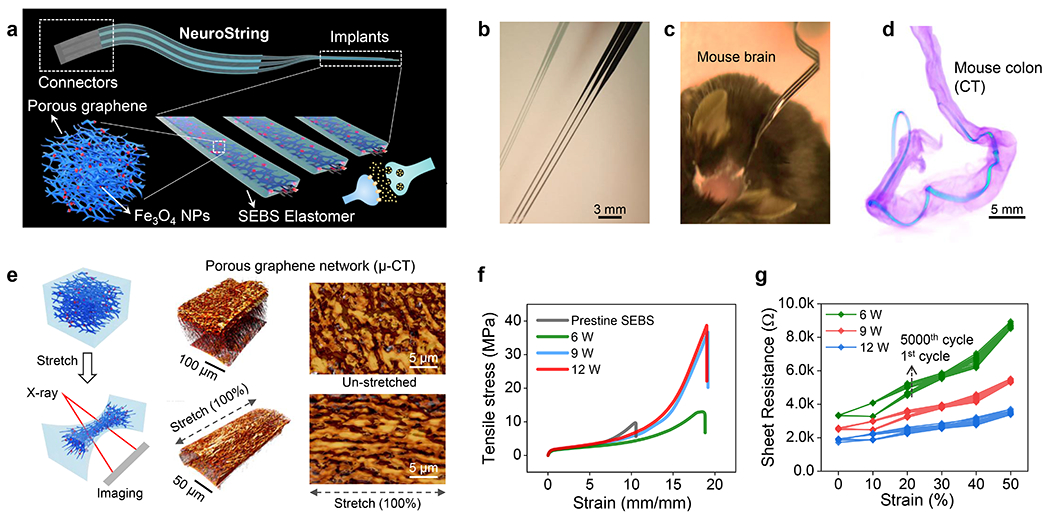
Neurotransmitters play essential roles in regulating neural circuit dynamics both in the central nervous system as well as at the peripheral, including the gastrointestinal tract1-3. Their real-time monitoring will offer critical information for understanding neural function and diagnosing disease1-3. However, bioelectronic tools to monitor the dynamics of neurotransmitters in vivo, especially in the enteric nervous systems, are underdeveloped. This is mainly owing to the limited availability of biosensing tools that are capable of examining soft, complex and actively moving organs. Here we introduce a tissue-mimicking, stretchable, neurochemical biological interface termed NeuroString, which is prepared by laser patterning of a metal-complexed polyimide into an interconnected graphene/nanoparticle network embedded in an elastomer. NeuroString sensors allow chronic in vivo real-time, multichannel and multiplexed monoamine sensing in the brain of behaving mouse, as well as measuring serotonin dynamics in the gut without undesired stimulations and perturbing peristaltic movements. The described elastic and conformable biosensing interface has broad potential for studying the impact of neurotransmitters on gut microbes, brain-gut communication and may ultimately be extended to biomolecular sensing in other soft organs across the body.


Conflict of interest statement

Competing interests: J.L., Y.L., and Z.B. are inventors on a patent application (no. 63/085,720) submitted by the Board of Trustees of Stanford University.

Figures

Extended Data Fig. 1 |
Extended Data Fig. 1 |. Fabrication process of the NeuroString sensors.
a, Scheme showing the chemical structures of the polymer precursors and the laser carbonization process. b, Layout showing the dimensions of the multi-channel NeuroString electrodes for the sensing in the brain. c, Fabrication process of the NeuroString for brain neurochemical sensing: (1) A polymer precursor solution containing a polyamic acid mixed with a metalloporphyrin (2.3×10⁻¹ mM) was uniformly drop-casted (50 μL/cm2) as a film on a polyimide substrate. (2) The precursor film was annealed in air at 250 °C for 1h in air to form the polyimide film. (3) The film surface was laser engraved by an Epilog Fusion M2 Laser (6W power) to generate the graphene network with Fe3O4 or NiO nanoparticles. A HPDFO (High Power Density Focusing Optics) lens with a focal point of 0.001 inch (25.4 μm) can be used improve the resolution of the engraving. (4) A SEBS solution (H1062, 0.1g ml−1 in toluene) was drop-casted on the graphene networks, which was then peeled off from the substrate and attached to another glass substrate when the SEBS side was in contact with glass. (5) Another SEBS layer (H1062, 0.1g ml−1 in toluene) was spin-coating on top at 1,000 r.p.m., to form an encapsulation layer. (6) A high laser power of 30W was subsequently used to cut into desired size and shape and isolate the individual electrode strings with 90 μm width. (7) The electrode area is dip-coated in another elastomer solution (Kuraray LA3320, 0.1g ml−1 in acetone) to fully encapsulate the graphene electrodes. (8) For implantation in the brain, the NeuroStrings were dip-coated in a pullulan solution (0.3g mL−1) and dried overnight to form a rigid coating. (9) The tips of electrodes were cut by a razor blade to expose the cross sections of the graphene. To fully expose the graphene, the cross-section surfaces of electrodes were additionally oxygen plasma treated for 2 min (Technics Micro-RIE Series 800, 150 W, 200 mTorr). To avoid any electrochemical interference of the ascorbic acid from the biological fluids, the tip of the electrodes is dipped in a Nafion solution (0.5% in water/ethanol) to form a Nafion coating before using. (10) Dissolving of the pullulan in tissue finally releases the NeuroString as a soft implant. d, Layout showing the dimensions of the NeuroString electrodes for sensing in the gut. e, Fabrication process of the NeuroString for gut neurochemical sensing. (1) A polymer precursor solution containing a polyamic acid mixed with a metalloporphyrin (2.3×10⁻¹ mM) was uniformly drop-casted (50 μL/cm2) as a film on a polyimide substrate. (2) The precursor film was annealed in air at 250 °C for 1h to form the polyimide film. (3) The film surface was laser engraved by an Epilog Fusion M2 Laser (6W power) to generate the graphene network with Fe3O4 or NiO nanoparticles. (4) SEBS solution (H1062, 0.1g ml−1 in toluene) is drop casted on the graphene networks to form graphene/SEBS composite, which is then is delaminated and transferred from the substrate and flipped on another glass substrate. (5) Another SEBS layer (H1062, 0.1g ml−1 in toluene) is spin-coated on top at 1,000 r.p.m., to form an encapsulation layer. (6) A high laser power with 30W power and 20% speed was used to cut the undesired part of the device. (7) For easier placing the mouse gut, a pullulan solution (0.1g mL−1) was dip-coated on the electrodes and dried overnight to form the shuttle layer. (8) The ends of electrodes are cut using a razor blade to expose the cross sections of the graphene. To fully expose the graphene, the cross-section surfaces of electrodes were oxygen plasma treated for 2min. To avoid any interference of the ascorbic acid from the biological fluids, the tip of the electrodes is finally dipped in a Nafion solution (0.5% in water/ethanol) to form a Nafion coating before use. (9) Dissolving of the pullulan in tissue will release the NeuroString as a soft implant.
Extended Data Fig. 2 |
Extended Data Fig. 2 |. Characterization of the laser-induced graphene used in the NeuroString sensor.
a, SEMs showing the resolution of the laser fabrication process (laser power 6W). Directly laser writing can achieve a resolution ~100 μm, while individual structure smaller than 50 μm can be fabricated by laser engraving (etching) process: e.g. two laser cutting line with a distance of 150 μm will lead to a free-staning electrode with the width of 50 μm. b-d, SEM images showing the graphene networks made by different laser powers. The graphene layer thicknesses are: 40-50 μm (laser power 6 W), 50-80 μm (laser power 9 W), and 120-150 μm (laser power 12 W). Thicker polyimide film will be carbonized at a higher laser power so that the graphene layer increases. The SEM characterization was repeated and reproduced for 6 times. e, High- resolution TEM of laser-induced graphene showing the characteristic 0.34 nm d- spacing between graphene sheets (laser power 6W). The TEM characterization was repeated and reproduced for 3 times. f, Normalized confocal Raman spectra (633-nm laser excitation) of a laser-induced graphene film made by different laser powers. The intensity profile indicates that higher laser power induced more defects in graphene. The higher D band at lower laser power is mainly due to the more oxygen and graphene oxide present in the laser-induced graphene.
Extended Data Fig. 3 |
Extended Data Fig. 3 |. Characterization of the transition metal oxide nanoparticles involved in the NeuroString sensor.
a, TEM characterization of the laser-induced graphene decorated with Fe3O4 nanoparticles (laser power 6W). The TEM characterization was repeated and reproduced for 3 times. b, TEM intensity profile of the Fe3O4 nanocrystal shown in (a). c, EELS analysis of the laser-induced graphene decorated with Fe3O4 nanoparticles (laser power 6W). d, Electron energy-loss spectroscopy (EELS) mapping showing decoration of Fe3O4 nanoparticles on the graphene e, TEM characterization of the laser-induced graphene decorated with NiO nanoparticles (laser power 6W). The TEM characterization was repeated and reproduced for 3 times f, TEM intensity profile of the NiO nanocrystal shown in (e). g, EELS analysis of the laser-induced graphene decorated with NiO nanoparticles (laser power 6W).
Extended Data Fig. 4 |
Extended Data Fig. 4 |. Selectivity and sensitivity characterization of the NeuroString sensors.
a-b, Cyclic voltammetry backgrounds of different electrodes in phosphate-buffered saline (PBS) buffer (pH 7.4) (scan rate 400 V/s). NeuroString has lower background current than the carbon fiber. c, Reaction mechanism of the dopamine and serotonin oxidation during fast scan cyclic voltammetry measurement. d, Comparison of the selectivity of different electrodes for simultaneous dopamine and serotonin sensing using cyclic voltammetry. The cyclic voltammetry is performed in a solution with 500 nM dopamine and 500 nM serotonin in PBS (pH 7.4) with a scan rate of 10V/s. e-f, Normalized oxidation current (nA ) of NeuroString (without and with Fe3O4 nanoparticles) and carbon nanofibers for dopamine and serotonin sensing (scan rate: 400 V/s). As the background current varies from 100-500 nA depending on the dimension, the normalizedoxidationcurrent=BackgroundcurrentFaradiccurrent×1000nA; the background current is defined as the current value at the 0.5 V. n=5 different NeuroString electrodes examined in independent measurement, box range: 25% to 75%. g, Concentration-dependent calibration response of NeuroString electrode to 5-HT using FSCV and chronoamperometry. (PBS buffer pH 7.4; Chronoamperometry potential: 0.6 V, error bars are obtained from n=6 different NeuroString electrodes examined in independent measurement)). Simultaneous and selective detection of DA and 5-HT: h, FSCVs of various concentrations of 5-HT (100 nM, 250 nM, 500 nM, 750 nM, 1000 nM) in 200 nM DA solution (dissolved in PBS buffer, pH 7.4), inset shows the linear plot of currents against concentrations of 5-HT.; i, FSCVs of various concentrations of DA (100 nM, 250 nM, 500 nM, 750 nM, 1000 nM) in 200 nM 5-HT solution (dissolved in PBS buffer, pH 7.4), inset shows the linear plot of currents against concentrations of DA. Simultaneous and selective detection of NP, EP and 5-HT: j, FSCVs of various concentrations of EP (100 nM, 250 nM, 500 nM, 750 nM, 1000 nM) in 200 nM 5-HT and 200 nM EP solution (dissolved in PBS buffer, pH 7.4), inset shows the linear plot of currents against concentrations of EP; k, FSCVs of various concentrations of 5-HT (100 nM, 250 nM, 500 nM, 750 nM, 1000 nM) in 200 nM NP and 200 nM EP solution (dissolved in PBS buffer, pH 7.4), inset shows the linear plot of currents against concentrations of 5-HT.; l, FSCVs of various concentrations of NP (100 nM, 250 nM, 500 nM, 750 nM, 1000 nM) in 200 nM 5-HT and 200 nM EP solution (dissolved in PBS buffer, pH 7.4), inset shows the linear plot of currents against concentrations of NP.
Extended Data Fig. 5 |
Extended Data Fig. 5 |. Measurement of the neurotransmitter release during fear conditioning and extinction training, and chronic stability of the NeuroString for neurotransmitter sensing.
a-d, Dopamine release in the NAc measured during various phases of a fear extinction task (NeuroStrings were implanted at least two weeks before the behavior assay started). a, Trial structure for the fear extinction training. b, Percentage of freezing to the CS during early extinction phase (E-Ext, 1-8 trials) and late extinction phase (L-Ext, 9-15 trials) (n = 5 mice). The CS evoked lower freezing levels during late phase indicated successful extinction learning. P value 0.0005. c, Quantification of dopamine responses to the CS during habituation (before Cond.), the fear conditioning (an electric shock after the tone) and fear extinction phase (n = 5 mice). P value: 0.0018 (shock), 0.003 (E-Ext), 0.0706 (L-Ext). d, Exemplar time-aligned dopamine signals from a mouse during each phase. e, Chronic measurement of dopamine in the NAc evoked by optogenetic stimulation of dopamine neurons in the VTA of DAT-Cre mice expressing ChR2 (Error bars are obtained from measurements from n=6 biologically independent mouse). P values: 0.9011 (week 4); 0.9926 (week 8); 0.6946 (week 12); and 0.4462 (week 16); f-g, Representative measurements from a NeuroString electrode in a mouse across 16 weeks in the form of (f) background-subtracted cyclic voltammogram and (g) the corresponding electrochemical impedance. P values are calculated by paired two-tailed Student’s t-test: ns P > 0.05; *P ≤ 0.05; **P ≤ 0.01; ***P ≤ 0.001.
Extended Data Fig. 6 |
Extended Data Fig. 6 |. Evaluation of NeuroString performance for serotonin sensing in the GI tract of rodents and large animals.
a, Setup of the colonic motility assay providing video imaging and spatiotemporal maps to analyze colonic motility of mice inserted with NeuroString ex vivo. Control is a mouse colon without anything inside the lumen. b, Representative H&E staining images showing the colon tissue of mice placed with a flexible Kapton (2 cm, 800 μm width, 120 μm thickness) film and a NeuroString with the same dimension. The materials were placed in the colon of freely moving mice for 3 h before collecting the tissue. damage to the tissue was clearly observed with flexible polyimide film implant. The H&E staining was repeated and reproduced for in 5 mice. c-d, Open field activity (average velocity) and e, pellet output in a 5-hour duration for mice with the colon acutely placed with a NeuroString or a flexible Kapton polyimide as control (n = 6). P value: NeuroString (0.9689) and Polyimide (0.0004) in d; NeuroString (0.4895) and Polyimide (0.0015) in e. The dotted lines in (c) showed 5-min trajectories of the mice. f. Photos showing NeuroString is wrapped around on a probe extended from one working channels of an endoscope (left), and the obtained endoscopy photo showing the NeuroString entering the colon lumen for serotonin sensing in a rat model (right). g. Representative serotonin concentration mapping in the rat colon (5 cm from the anus) collected by delivering the NeuroString into the colon lumen and slowly taking it out (error bar denotes ± SD of the measurement results obtained from 3 channels). h. μ-CT images showing the NeuroString conformally loaded in the mouse colon. i, Representative H&E staining images showing the colon tissue of control mouse treated with saline water, and colitis mouse with inflammation induced by dextran sulfate sodium after 10 days colitis development. The H&E staining was repeated and reproduced for in 5 mice. j, Measured serotonin concentration in the colon tissue of control and DSS mice using ELISA assay. P value 0.0171. k. Layout of the NeuroString sensor for serotonin sensing in the pig colon. The sensor fabrication process is the same as illustrated in Extended Data Fig. 1 except using a large polyimide sheet (12 inch by 12 inch) as a substrate. l, Scheme and photo showing the multiple-site serotonin measurement in the intestine of a pig by NeuroString. m, Simultaneous serotonin sensing in different segments of the intestinal tract by multiple channel NeuroString. n-o, Drug-induced luminal serotonin concentration change using fluoxetine (SSRI), methylene blue (MB), fluoxetine (SSRI) + methylene blue (MB), and saline as control (n = 6 pigs). P value: SSRI (0.5553), MB (0.3567); and SSRI+MB (0.0099). P values are calculated by paired two-tailed Student’s t-test: ns P > 0.05; *P ≤ 0.05; **P ≤ 0.01; ***P ≤ 0.001.
Fig. 1:
Fig. 1:. NeuroString for sensing neurotransmitters in the brain and gut.
(a) Schematic of the soft implant for sensing neurotransmitter in the brain and a 3D schematic showing the composite materials made by confining nanoscale graphene/iron oxide nanoparticle networks in an elastomer (SEBS) to construct a soft, sensitive, and selective neurochemical sensor. (b) A stretched 3-channel NeuroString with each channel for sensing brain neurotransmitter separately. (c) NeuroString chronically implanted in a mouse. (d) ex vivo X-ray computed tomography showing a NeuroString placed in the mouse colon. (e) Left: schematic setup for in situ characterization of the graphene mesostructure under strain. Middle: X-ray tomography 3D reconstruction of the graphene-elastomer composite showing the mesostructure of the graphene nanofiber networks at 0% (upper) and 100% (bottom) strain, respectively. Right: corresponding top-view of the graphene tomography. The μ-CT scan results were repeated and reproduced for 3 times. (f) Tensile stress-strain behavior of the graphene/elastomer composites prepared by different laser power. (g) Sheet resistance of the graphene/elastomer composites prepared by different laser power under different strains and stretching cycles (strain from 0% to 50% for 5000 cycles, data showing the sheet resistance of the 1st, 1000th, 2000th, 3000th, 4000th and 5000th stretching cycles).
Fig. 2:
Fig. 2:. Electrochemical sensing performance of NeuroString electrode in solution.
(a) Comparison of the selectivity of different graphene electrodes (made of graphene with Fe3O4 nanoparticles, graphene with NiO nanoparticles, and graphene only) and carbon fiber electrodes for simultaneously sensing DA and 5-HT using cyclic voltammetry (the individual voltammogram are shown in Extended Data Fig. 4d). Error bars are obtained from n=6 different NeuroString electrodes examined in independent measurement. (b) X-ray tomography 3D reconstruction showing the cross-section of the NeuroString electrode as the sensing area. (c) Stable oxidation current peak of the electrodes, made by graphene with Fe3O4 nanoparticles, under different strains. The cyclic voltammetry is performed in a solution with 500 nM DA and 500 nM 5-HT in phosphate-buffered saline (PBS) buffer (pH 7.4) with a scan rate of 10 V/s (n=6 electrodes). (d-e) Concentration-dependent calibration response of NeuroString electrode to DA, epinephrine, norepinephrine, and 5-HT ranging from 10 to 200 nM in PBS buffer (pH 7.4) with a scan rate of 400 V/s (Error bars are obtained from n=6 different NeuroString electrodes examined in independent measurement). (f) The current response to 100 nM analytes in PBS with different pH values (2, 4, 6, 7.4 and 10) with a scan rate of 400 V/s (Error bars are obtained from n=6 different NeuroString electrodes examined in independent measurement).
Fig. 3:
Fig. 3:. Neurochemical sensing in the brain.
(a) Schematic of dopamine sensing in the NAc by NeuroString sensor while optogenetically stimulating VTA dopaminergic neurons. (b) Representative curves of estimated DA concentration versus time and (c) corresponding background-subtracted color plots measured from a 3-channel NeuroString through optogenetic stimulation (20 Hz with 15 pulses). (d) Representative traces of phasic DA release traces in the NAc under different stimulation frequency (15 pulses). (e) Calibrated DA peak concentration evoked by stimulation using different frequencies (n=6 mice); (f) Representative trace of phasic DA release under repetitive stimulation (20 Hz, 15 pulses). (g) Experimental paradigm for a Pavlovian rewarding learning task in freely-moving mice. (h) Representative lick raster plots from example mouse across nine conditioning sessions (upper), and corresponding average lick rate across nine conditioning sessions (lower). (i-j) Exemplar time-aligned DA signals from a mouse in (i) naive and (j) trained sessions. (k-l) Group analysis of DA responses to (k) unconditioned stimulus (water) and (l) and conditioned stimulus (auditory cue) across trainings (n=6 mice). P values: water: 0.3898 (day 3), 0.2425 (day 6), and 0.8826 (day 9); auditory cue: 0.0002 (day 3); 0.0001 (day 6), and 0.0004 (day 9). (m) Schematics showing the serotonin measurements in the BLA with optogenetic stimulation using SERT-Cre mouse. (n) Estimated [5-HT]max evoked by 15 pulse stimulation trains applied at 5, 20, and 100 Hz (n=6 mice). (o-p) Representative color plots showing 5-HT release evoked in BLN by a 20 Hz, 15 pulses dorsal raphe nucleus (DRN) stimulation (o) before SSRI injection and (p) 30 min after SSRI injection (10 mg/kg). (q) Averaged concentration trace showing 5-HT release evoked by 20 Hz stimulation at baseline (blue line) and 30 min after SSRI (fluoxetine, red line) injection. (r) Comparison of average clearance half-time t1/2 at baseline and 30 min after SSRI injection (n=6 mice), P value: 0.0005. (s) Schematics showing NeuroString in striatum for measuring CAT and 5-HT co-release. (t) Representative color plot (upper) and the corresponding estimated concentrations (lower) of CAT and 5-HT measured by NeuroString after administration of cocaine (15 mg/kg) + 5-HTP (15 mg/kg). (u) Representative color plot (upper) and the corresponding estimated concentrations (lower) of CAT and 5-HT measured by NeuroString after administration of cocaine (15 mg/kg) + 5-HTP (15 mg/kg) + SSRI (10 mg/kg). (v) Representative cyclic voltammograms for detecting DA and 5-HT in the NAc after 30 min administration of cocaine (15 mg/kg) + 5-HTP (15 mg/kg) + SSRI (10 mg/kg). (w) Comparison of average 5-HT clearance half-time t1/2 at baseline and 30 min after SSRI injection (n=6 mice). P value: 0.000079. (x) Comparison of average catecholamine clearance half-time t1/2 at baseline and 30 min after SSRI injection (n=6 mice), P value: 0.7930. P values are calculated by paired two-tailed Student’s t-test: ns P > 0.05; *P ≤ 0.05; **P ≤ 0.01; ***P ≤ 0.001.
Fig. 4:
Fig. 4:. Neurochemical sensing in the GI system.
(a) Scheme showing 5-HT being released by the EC cell on the intestinal epithelium layer. (b) Ex vivo image showing that the NeuroString can conform to the mucosa of mouse colon. (c) Time-lapse images showing contraction and relaxation of the mouse colon during the neurochemical measurement. (d) Representative spatiotemporal maps of colonic migrating motor complex (CMMC). Control data was obtained using a colonic motility assay without a device in the lumen. Spatiotemporal maps indicate the interval between CMMCs (y-axis) at each cross-sectional diameter (x-axis) along the colon length. (e) CMMC intervals and (f) Slow-wave-induced contraction intervals mapped by video imaging colonic motility (error bar bands denote ± SD of the measurement results obtained from colons of n=5 biologically independent mice). (g) Ex vivo chronoamperometry measurement of 5-HT concentration and the corresponding displacement (red) of mouse colon undergoing peristalsis motion (potential: + 500mV) using a NeuroString or commercial carbon fibers during the colon contracting motion. (h-i) Representative traces (h) and histogram (i) of temperature increase from 37°C to 34°C evoked 5-HT concentration change in mouse colon measured by NeuroString (n= 6 mice colons, P values: 0.8190, 0.0004, and 0.1806). (j) Mouse colon 5-HT concentration change measured by NeuroString during dextran sulfate sodium (DSS) induced colitis development (n= 4 mice, P values: 0.7348, 0.0073, and 0.0075). Each data point represents an average of 5 measurements within this range at a distance of 0-3 cm from the anus of the mouse. (k) Representative 5-HT concentration mapping of the mouse colon (3 cm from the anus) of a colitis mouse and a healthy mouse. Simultaneous DA and 5-HT measurement using chocolate as reward and nutrition stimulates for mice. (l) Phasic CAT release in the striatum with intake of chocolate (error bar denotes ± SD of the measurement results obtained from n=5 biologically independent mice), measured from striatum, and (m) corresponding 5-HT level changes in the colon over time following intake of chocolate (n= 5 mice). P values are calculated by paired two-tailed Student’s t-test: ns P > 0.05; *P ≤ 0.05; **P ≤ 0.01; ***P ≤ 0.001.

References

    1. Patriarchi T et al. Ultrafast neuronal imaging of dopamine dynamics with designed genetically encoded sensors. Science 360, (2018). - PMC - PubMed
    1. Nakatsuka N et al. Aptamer–field-effect transistors overcome Debye length limitations for small-molecule sensing. Science 362, 319–324 (2018). - PMC - PubMed
    1. Kishida KT et al. Subsecond dopamine fluctuations in human striatum encode superposed error signals about actual and counterfactual reward. Proceedings of the National Academy of Sciences of the United States of America 113, 200–205 (2016). - PMC - PubMed
    1. Wise RA Dopamine, learning and motivation. Nature Reviews Neuroscience vol. 5 483–494 (2004). - PubMed
    1. A review of the role of serotonin receptors in psychiatric disorders - Naughton - 2000 - Human Psychopharmacology: Clinical and Experimental - Wiley Online Library. 10.1002/1099-1077(200008)15:6<397::AID313HUP212>3.0.CO;2-L. - DOI - PubMed