

The project implicit international dataset: Measuring implicit and explicit social group attitudes and stereotypes across 34 countries (2009-2019)
- PMID: 35650381
- PMCID: PMC9159648
- DOI: 10.3758/s13428-022-01851-2
The project implicit international dataset: Measuring implicit and explicit social group attitudes and stereotypes across 34 countries (2009-2019)
Abstract
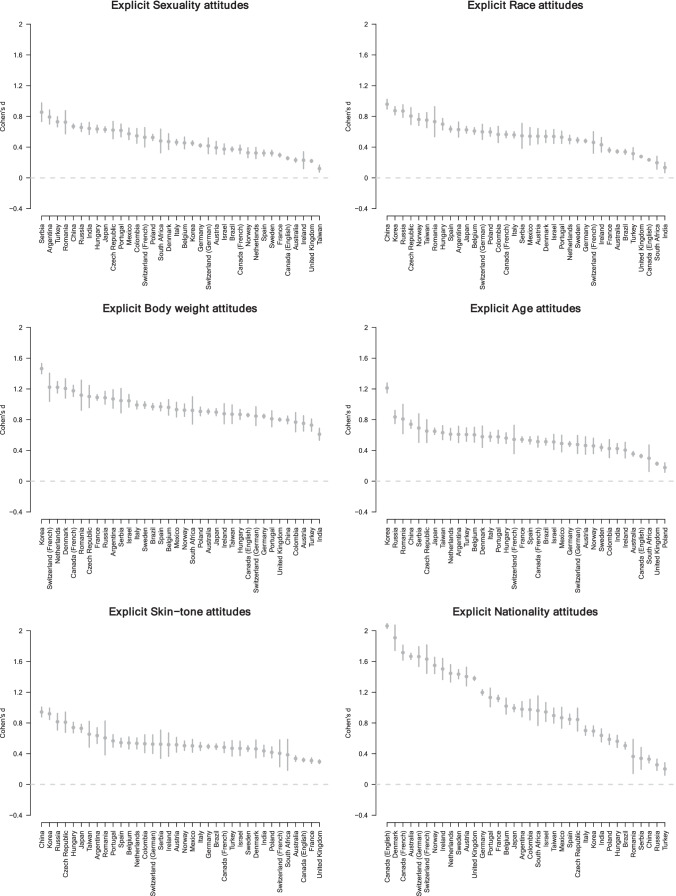
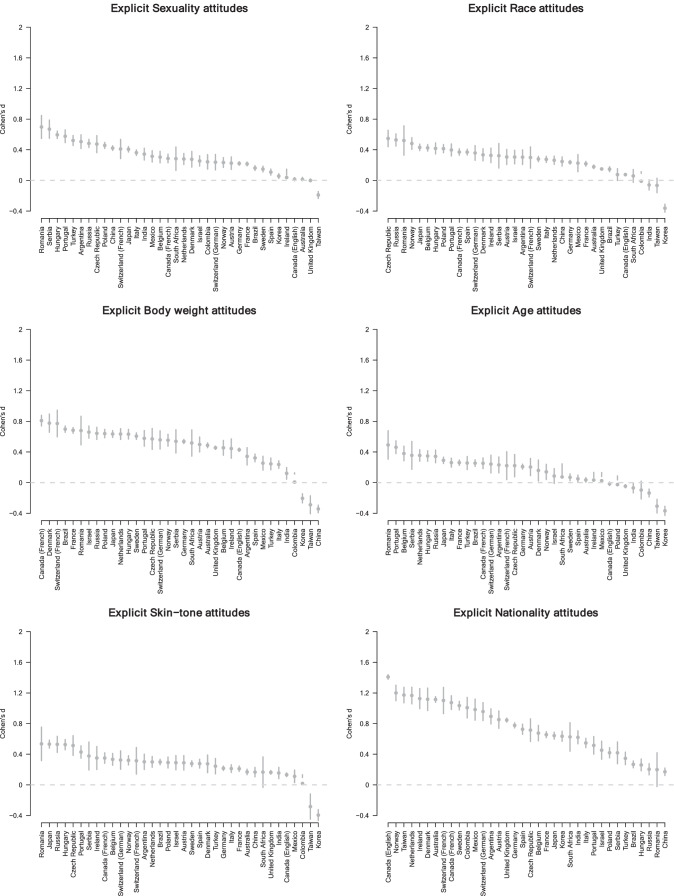
For decades, researchers across the social sciences have sought to document and explain the worldwide variation in social group attitudes (evaluative representations, e.g., young-good/old-bad) and stereotypes (attribute representations, e.g., male-science/female-arts). Indeed, uncovering such country-level variation can provide key insights into questions ranging from how attitudes and stereotypes are clustered across places to why places vary in attitudes and stereotypes (including ecological and social correlates). Here, we introduce the Project Implicit:International (PI:International) dataset that has the potential to propel such research by offering the first cross-country dataset of both implicit (indirectly measured) and explicit (directly measured) attitudes and stereotypes across multiple topics and years. PI:International comprises 2.3 million tests for seven topics (race, sexual orientation, age, body weight, nationality, and skin-tone attitudes, as well as men/women-science/arts stereotypes) using both indirect (Implicit Association Test; IAT) and direct (self-report) measures collected continuously from 2009 to 2019 from 34 countries in each country's native language(s). We show that the IAT data from PI:International have adequate internal consistency (split-half reliability), convergent validity (implicit-explicit correlations), and known groups validity. Given such reliability and validity, we summarize basic descriptive statistics on the overall strength and variability of implicit and explicit attitudes and stereotypes around the world. The PI:International dataset, including both summary data and trial-level data from the IAT, is provided openly to facilitate wide access and novel discoveries on the global nature of implicit and explicit attitudes and stereotypes.
Keywords: Cross-cultural data; Explicit attitudes; Implicit Association Test; Implicit attitudes; Project Implicit.
© 2022. The Psychonomic Society, Inc.
Figures


References
-
- Abadie, A., & Cattaneo, M. D. (2018). Econometric methods for program evaluation. In Annual Review of Economics (Vol. 10, pp. 465–503). Annual Reviews. 10.1146/annurev-economics-080217-053402
-
- Abramson, P., & Inglehart, R. (1995). Value change in global perspective. University of Michigan Press. 10.3998/MPUB.23627.
-
- Ajzen, I., & Fishbein, M. (1977). Attitude-behavior relations: A theoretical analysis and review of empirical research. Psychological Bulletin, 84(5).
-
- Ajzen I, Fishbein M. The influence of attitudes on behavior. The Handbook of Attitudes. 2005;10496:173–221. doi: 10.4324/9781410612823.CH5. - DOI
Publication types
MeSH terms
LinkOut - more resources
Full Text Sources
Research Materials
Miscellaneous
