. 2022 Jun;606(7914):565-569.
doi: 10.1038/s41586-022-04740-y. Epub 2022 Jun 1.

An oxygen-sensing mechanism for angiosperm adaptation to altitude

Affiliations

An oxygen-sensing mechanism for angiosperm adaptation to altitude

Mohamad Abbas et al. Nature. 2022 Jun.

Abstract

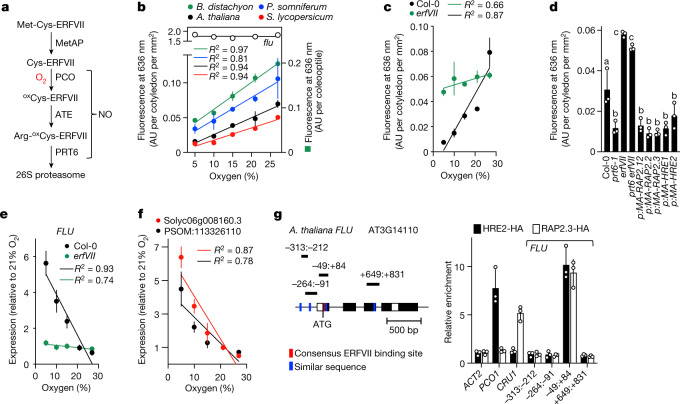
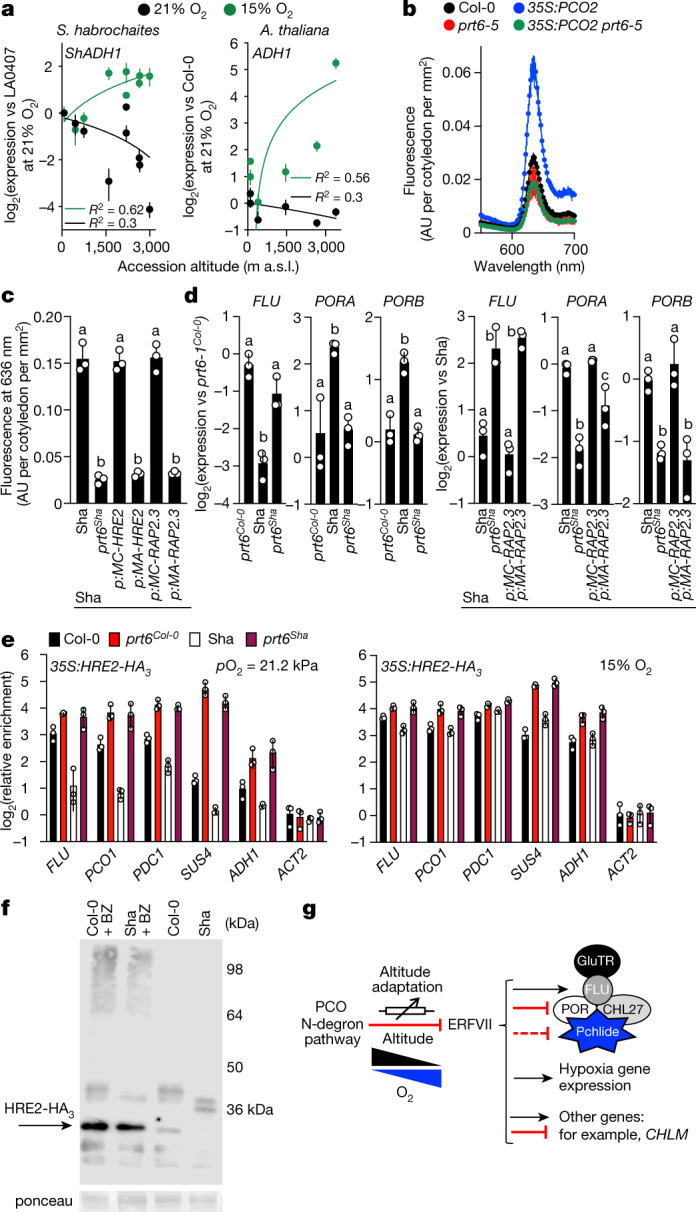
Flowering plants (angiosperms) can grow at extreme altitudes, and have been observed growing as high as 6,400 metres above sea level1,2; however, the molecular mechanisms that enable plant adaptation specifically to altitude are unknown. One distinguishing feature of increasing altitude is a reduction in the partial pressure of oxygen (pO2). Here we investigated the relationship between altitude and oxygen sensing in relation to chlorophyll biosynthesis-which requires molecular oxygen3-and hypoxia-related gene expression. We show that in etiolated seedlings of angiosperm species, steady-state levels of the phototoxic chlorophyll precursor protochlorophyllide are influenced by sensing of atmospheric oxygen concentration. In Arabidopsis thaliana, this is mediated by the PLANT CYSTEINE OXIDASE (PCO) N-degron pathway substrates GROUP VII ETHYLENE RESPONSE FACTOR transcription factors (ERFVIIs). ERFVIIs positively regulate expression of FLUORESCENT IN BLUE LIGHT (FLU), which represses the first committed step of chlorophyll biosynthesis, forming an inactivation complex with tetrapyrrole synthesis enzymes that are negatively regulated by ERFVIIs, thereby suppressing protochlorophyllide. In natural populations representing diverse angiosperm clades, we find oxygen-dependent altitudinal clines for steady-state levels of protochlorophyllide, expression of inactivation complex components and hypoxia-related genes. Finally, A. thaliana accessions from contrasting altitudes display altitude-dependent ERFVII activity and accumulation. We thus identify a mechanism for genetic adaptation to absolute altitude through alteration of the sensitivity of the oxygen-sensing system.


Conflict of interest statement

The authors declare no competing interests.

Figures

Fig. 1
Fig. 1. Atmospheric oxygen sensing regulates tetrapyrrole synthesis via FLU.
a, Schematic representation of the PCO branch of the PRT6 N-degron pathway. MetAP, methionine amino-peptidase; ATE, arginyl transferase; oxCys, oxidized cysteine. The position of oxygen and possible positions of nitric oxide (NO) in the pathway are shown. Oxygen is used by PCOs to oxidize amino-terminal Cys of ERFVIIs. b, Steady-state Pchlide, measured by fluorescence at 636 nm, in etiolated seedlings of different species grown at different ambient O2 concentrations. c, d, Steady-state Pchlide in Col-0 and erfVII at different ambient O2 concentrations (c) with expression of individual stabilized Cys2Ala mutant ERFVIIs controlled by their native promoters (d) (p). e, Amount of FLU RNA transcript in Col-0 and erfVII grown at different ambient O2 concentrations. f, Regulation of FLU orthologue mRNA in P. somniferum (PSOM) and S. lycopersicum (Solyc) grown at various ambient O2 concentrations. g, Schematic of the A. thaliana FLU gene, showing potential ERFVII binding sites (left) and chromatin immunoprecipitation (ChIP) analysis of RAP2.3–HA and HRE2–HA occupancy of FLU gene regions (range indicated by colons); including known positive and negative regulatory sequences, using anti-HA antibody. All experiments were carried out using etiolated seedlings after 5 days growth at pO2 21.2 kPa (48 m a.s.l.) unless otherwise stated. Data are mean ± s.d.; one-way ANOVA. Significantly different groups are indicated by letters in d. n = 3 biologically independent experiments. AU, arbitrary units; R2, coefficient of determination. Source data
Fig. 2
Fig. 2. Steady-state levels of Pchlide and FLU expression are determined by altitude.
a, Pchlide levels in A. thaliana accessions collected at different altitudes and geographic locations, grown at a pO2 of 21.2 kPa. Grey dots show pO2 at the different altitudes from which the accessions were collected. Genomic groups are indicated in different colours. IP, Iberian Peninsula b, Pchlide levels in S. habrochaites grown at 48 m a.s.l. with 21% and 15% ambient O2. c, Effect of ambient O2 concentration on Pchlide levels in A. thaliana accessions grown at 48 m a.s.l. (R2 values from Supplementary Table 1b). d, e, Effect of ambient O2 concentration on amount of FLU mRNA in A. thaliana (d) and S. habrochaites (e) grown at 48 m a.s.l. f, Pchlide levels in cultivated domesticated C. quinoa accessions obtained from different altitudes grown at pO2 21.2 kPa. g, Comparison of Pchlide levels in A. thaliana accessions collected at different altitudes and grown at 48 m a.s.l. with pO2 = 21.2 kPa or 15% ambient O2, or at 2,479 m a.s.l.(pO2 = 15.7 kPa). h, FLU RNA accumulation in A. thaliana accessions collected at different altitudes and grown at 48 m a.s.l. (pO2 = 21.2 kPa) or at 2,479 m a.s.l. (pO2 = 15.7 kPa). All experiments were carried out using etiolated seedlings after 5 days growth. Data are mean ± s.d. Accessions used are listed in Supplementary Table 1a. n = 3 biologically independent experiments. Source data
Fig. 3
Fig. 3. Genetic mechanisms linking oxygen sensing to altitude adaptation.
a, Effect of ambient O2 on RNA accumulation of hypoxia-associated ADH1 in S. habrochaites and A. thaliana accessions. b, Pchlide levels in prt6-5, 35S:PCO2, prt6-5 35S:PCO2 and Col-0. c, d, Pchlide level and FLU, PORA and PORB transcript expression in prt6-1 mutants and transgenic plants expressing wild-type or Cys2Ala mutant Col-0 RAP2.3 or HRE2 (driven by their own promoters) in Sha and Col-0 genetic backgrounds. e, ChIP analysis of HRE2–HA occupancy at FLU −49:+84 and hypoxia-related genes in Col-0 and Sha seedlings grown with pO2 21.2 kPa or 15% ambient oxygen. f, Western blot analysis of HRE2–HA in Sha and Col-0 accessions grown at pO2 21.2 kPa. The experiment was repeated independently three times with similar results. BZ, bortezomib. g, A model for angiosperm adaptation to altitude through oxygen sensing. Wedges indicate decreasing pO2 with increasing altitude. Blocked arrows indicate repression. Arrow-crossed box is international standard symbol for a rheostat. The inactivation complex model is adapted from ref. . All experiments were carried out using etiolated seedlings after 5 days growth at 48 m a.s.l. Data are mean ± s.d.; one-way ANOVA. Significantly different groups are indicated by letters in c, d. n = 3 biologically independent experiments. Source data
Extended Data Fig. 1
Extended Data Fig. 1. Tetrapyrrole synthesis and Pchlide steady state levels in etiolated seedlings.
a, Schematic of tetrapyrrole synthesis showing points of oxygen requirement. Blue, enzymes, black metabolites. Blocked arrows indicate repression. ALA, 5-aminolevulinic acid; Mg-Proto, Mg-protoporphyrin; GluTR, glutamyl-tRNA reductase; CHLM, MAGNESIUM-PROTOPORPHYRIN IX METHYLTRANSFERASE; HY1, HEME OXYGENASE1; POR, Light requiring PCHLIDE OXIDOREDUCTASE; FLU, FLOURESCENT IN BLUE LIGHT. Constituents of the GluTR inactivation complex are shown, diagram after. b, Linearity of the measurement of Pchlide peak fluorescence at 636 nm, measured as arbitrary units (a.u.) per cotyledon per mm2 (to account for differing cotyledon sizes between accessions of the same species), using the Pchlide over-accumulating Col-0 mutant flu. c, Pchlide levels in Col-0 (wild type) and flu. d, Levels of Pchide in A. thaliana during 7 days of etiolated growth of Col-0 (wild-type) and flu. Experiments carried out using etiolated seedlings after 5 days growth at pO2 21.2 kPa (48 m a.s.l) unless otherwise stated. Means are plotted, error bars report SD. For each n = 3 biologically independent experiments. Source data
Extended Data Fig. 2
Extended Data Fig. 2. The influence of the PRT6 N-degron pathway and ERFVIIs on Pchlide levels.
a, Pchide steady state levels in A. thaliana during 7 days of etiolated growth of Col-0 (wild-type) and N-degron pathway mutant prt6-1 and erfVII combinations. b, Pchlide levels at pO2 21.2 kPa (48 m a.s.l) in A. thaliana N-degron pathway mutant prt6-1 and erfVII combinations and individual ERFVII mutants. c, Pchlide levels in prt6, flu and prt6 flu. d, Analysis of RNA expression of FLU and genes of tetrapyrrole synthesis in Col-0 (wild type) and erfVII and prt6 mutants. e, Transcript levels in Col-0 and erfVII at different ambient oxygen levels. f, Accumulation of proteins for POR and FLU in Col-0 (wild type) and PRT6 N-degron pathway mutants at pO2 21.2 kPa (48 m a.s.l), and in Col-0 and erfVII at different ambient oxygen levels, repeated independently three times with similar results. All experiments carried out using etiolated seedlings after 5 days growth at pO2 21.2 kPa (48 m a.s.l) unless otherwise stated. Means are plotted, error bars report SD. Significant differences denoted with letters for one-way ANOVA (p < 0.05). Coefficient of determination (R2) is given. For each n = 3 biologically independent experiments. Source data
Extended Data Fig. 3
Extended Data Fig. 3. ChIP analysis of HRE2 interaction with tetrapyrrole synthesis-related genes.
a, Conservation of ERFVII binding site (also known as EBP, GC box) and related HRPE (Hypoxia-Responsive Promoter Element)-like element in the first coding exon of A. thaliana FLU and orthologues from selected angiosperms (initiating ATG highlighted). b, Schematic of the CHLM gene (repressed by ERFVIIs) showing ERFVII-binding sites and ChIP analysis of RAP2.3-3xHA and HRE2-3xHA occupancy of CHLM gene regions (including known positive and negative sequences). c,d Conservation of ERFVII binding site in the first coding exons of CHLM and CHL27 respectively. e, ChIP analysis of HRE2-3xHA occupancy of gene regions of CHL27, PORA, PORB and HEMA1. f, Schematics of genes showing positions of ERFVII and ERFVII-like binding sites. White boxes untranslated and black boxes translated regions. All experiments carried out using etiolated seedlings after 5 days growth at pO2 21.2 kPa (48 m a.s.l). Means are plotted, error bars report SD. For each n = 3 biologically independent experiments. Source data
Extended Data Fig. 4
Extended Data Fig. 4. Pchlide steady state levels and submergence tolerance for species accessions used in this study.
a, b, Pchlide levels at pO2 21.2 kPa in S. cheesmaniae and B. distachyon accessions collected at different altitudes and geographic locations. c, Relationship between A. thaliana accession and submergence tolerance, LT50 is defined as the number of days after which 50% of the plant population (for a particular accession) dies and was calculated from survival curves for each accession (data replotted from), original data in Supplementary Table 1c. Coefficient of determination (R2) is given. Means are plotted, error bars report SD. For each n = 3 biologically independent experiments. Source data
Extended Data Fig. 5
Extended Data Fig. 5. ROS and chlorophyll accumulation in 5 day old etiolated seedlings after one day of light in A. thaliana.
a. Relative fluorescence of ROS and chlorophyll. b. Example images of fluorescence of ROS and chlorophyll in different accessions at 21% and 15% ambient oxygen. Differences in ROS content were tested by GLM (General Linear Model) with two factors (Genotype and Oxygen) with fixed effects, both factors as well as the interaction where highly significant (Supplementary Table 1d). At least 8 seedlings were measured per accession, representative cotyledons are shown. For box and whisker plots whiskers go down to the minimum and up to the maximum values, boxes represent from 25th to 75th percentile and bars equal the median values. Source data
Extended Data Fig. 6
Extended Data Fig. 6. Expression of RNA and protein for FLU, CHLM, HEMA1 and PORs in A. thaliana accessions.
a, Analysis of RNA expression in accessions collected at increasing altitude at pO2 21.2 kPa and 15% ambient oxygen. b, Accumulation of proteins for POR and FLU in Col-0 (wild type) and Sha, prt6 (Col-0 background) and Sha prt6, repeated independently three times with similar results. All experiments were carried out using etiolated seedlings after 5 days growth at 48 m a.s.l unless otherwise stated. Means are plotted, error bars report SD. Coefficient of determination (R2) is given. For each n = 3 biologically independent experiments. Source data
Extended Data Fig. 7
Extended Data Fig. 7. Locations of sites used for reciprocal transplantation experiments.
Relationship between altitude and partial pressure of oxygen (pO2 kPa), showing positions of sites Sutton Bonington (SB): Latitude 52.829809° N longitude −1.249732° E pO2 21.2 kPa: 48 m a.s.l, and Sangolquí (ESPE): Latitude −0.312917° N longitude −78.445157° E pO2 15.7 kPa: 2479 m a.s.l. Maps obtained from http://www.ginkgomaps.com/.
Extended Data Fig. 8
Extended Data Fig. 8. Influence of ambient O2 on expression of hypoxia-induced RNAs in A. thaliana and S. habrochaites accessions.
a, Pchlide in A. thaliana high-altitude accession Sha, and erfVII (pentuple mutant obtained from the low altitude accession Col-0), measured at 48 m a.s.l. (SB, pO2 21.2 kPa) and 2479 m a.s.l. (ESPE, pO2 15.7 kPa). b, PORA/B, CHLM gene expression in A. thaliana accessions collected at different altitudes measured at 48 m a.s.l. (pO2 21.2 kPa, SB) or at 2479 m a.s.l. (pO2 15.7 kPa, ESPE). c, Hypoxia-related gene expression in A. thaliana accessions Col-0 (low altitude) and Sha (high altitude), at 48 m a.s.l. in different ambient levels of oxygen. d, Expression of S. habrochaites hypoxia-related genes at 15% and 21% ambient oxygen in accessions from different altitudes measured at 48 m a.s.l. Carried out using etiolated seedlings after 5 days growth (48 m a.s.l). Means are plotted, error bars report SD, coefficient of determination (R2) is given. For each n = 3 biologically independent experiments. For a, Sha (SB) was measured once. Source data
Extended Data Fig. 9
Extended Data Fig. 9. Comparisons of genomic DNA and RNA expression patterns in A. thaliana accessions Col-0 and Sha.
a,b Introduction of the prt6-1 mutation (by introgression from low altitude accession Col-0) or C2A-RAP2.3 (by transformation) into A. thaliana high altitude accession Sha enhances the expression of hypoxia-related genes. c, Expression of RNAs for PCO PRT6 N-degron pathway components in accessions Sha and Col-0. RNA was extracted using etiolated seedlings after 5 days growth at pO2 21.2 kPa (48 m a.s.l). d, Comparison of DNA sequence of the first coding exon of FLU in accessions Col-0 and Sha. DNA sequence information was obtained from Arabidopsis 1001 web site: http://signal.salk.edu/atg1001/2.0/gebrowser.php. Shown are ERFVII binding site (also known as EBP, GCC box) and related HRPE (Hypoxia-Responsive Promoter Element)-like element in the first coding exon of A. thaliana FLU (initiating ATG highlighted). All experiments carried out using etiolated seedlings after 5 days growth. Means are plotted, error bars report SD. Significant differences denoted with letters for one-way ANOVA (p < 0.05). For each n = 3 biologically independent experiments. Source data
Extended Data Fig. 10
Extended Data Fig. 10. Pchlide steady state levels in reciprocal genetic crosses between A. thaliana high altitude accession Sha and erfVII (Col-0 accession).
Experiments carried out using etiolated seedlings after 5 days growth at pO2 21.2 kPa (48 m a.s.l). Means are plotted, error bars report SD. Significant differences denoted with letters for one-way ANOVA (p < 0.05). For each n = 3 biologically independent experiments. Source data

Comment in

  • High on oxygen.
    Gibbs DJ, Osborne R. Gibbs DJ, et al. Nat Plants. 2022 Jul;8(7):731-732. doi: 10.1038/s41477-022-01196-w. Nat Plants. 2022. PMID: 35773418 No abstract available.

References

    1. Angel R, et al. The root-associated microbial community of the world's highest growing vascular plants. Microb. Ecol. 2016;72:394–406. doi: 10.1007/s00248-016-0779-8. - DOI - PMC - PubMed
    1. Dentant C. The highest vascular plants on Earth. Alp. Bot. 2018;128:97–106. doi: 10.1007/s00035-018-0208-3. - DOI
    1. Brzezowski P, Richter AS, Grimm B. Regulation and function of tetrapyrrole biosynthesis in plants and algae. Biochim. Biophys. Acta. 2015;1847:968–985. doi: 10.1016/j.bbabio.2015.05.007. - DOI - PubMed
    1. Korner C. The use of ‘altitude’ in ecological research. Trends Ecol. Evol. 2007;22:569–574. doi: 10.1016/j.tree.2007.09.006. - DOI - PubMed
    1. Bomblies K. The high life: alpine dwarfism in Arabidopsis. Plant Physiol. 2015;168:767. doi: 10.1104/pp.15.00745. - DOI - PMC - PubMed