. 2022 Jun;606(7914):542-549.
doi: 10.1038/s41586-022-04805-y. Epub 2022 Jun 1.

Communicating doctors' consensus persistently increases COVID-19 vaccinations

Affiliations

Communicating doctors' consensus persistently increases COVID-19 vaccinations

Vojtěch Bartoš et al. Nature. 2022 Jun.

Abstract

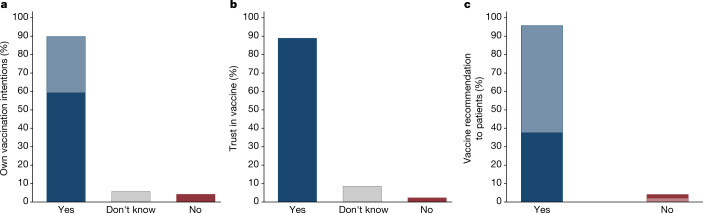
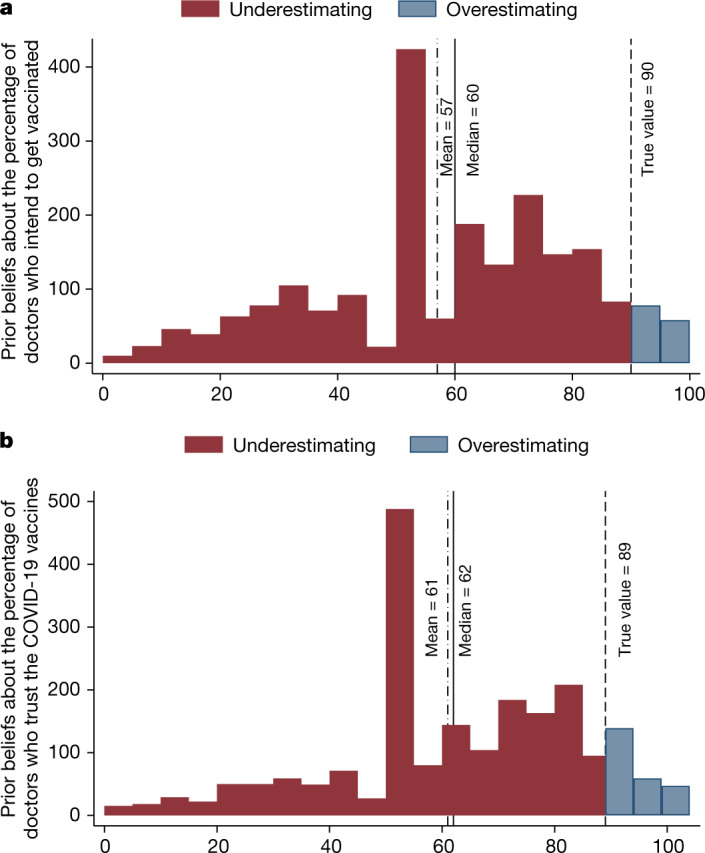
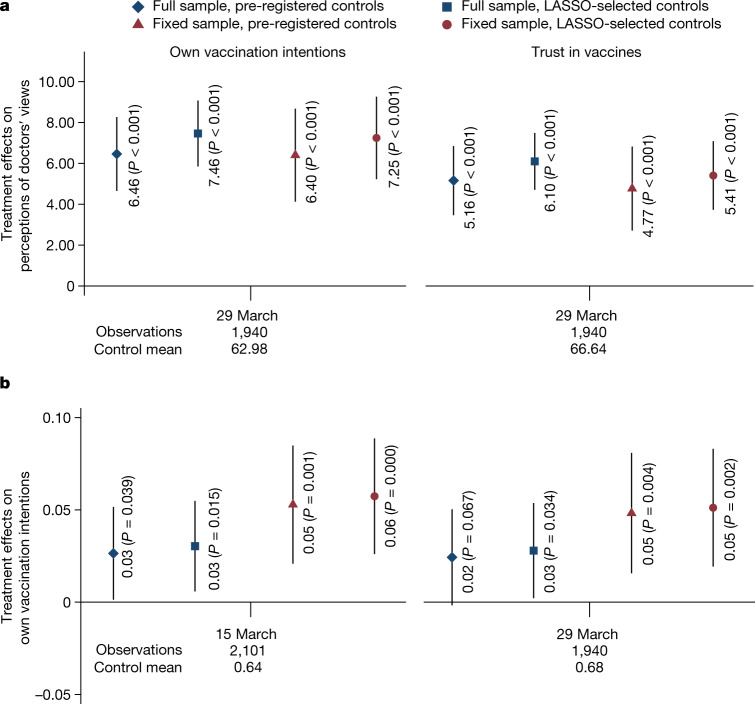
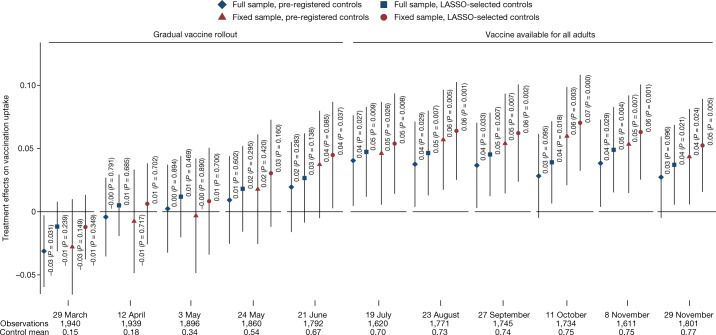
The reluctance of people to get vaccinated represents a fundamental challenge to containing the spread of deadly infectious diseases1,2, including COVID-19. Identifying misperceptions that can fuel vaccine hesitancy and creating effective communication strategies to overcome them are a global public health priority3-5. Medical doctors are a trusted source of advice about vaccinations6, but media reports may create an inaccurate impression that vaccine controversy is prevalent among doctors, even when a broad consensus exists7,8. Here we show that public misperceptions about the views of doctors on the COVID-19 vaccines are widespread, and correcting them increases vaccine uptake. We implement a survey among 9,650 doctors in the Czech Republic and find that 90% of doctors trust the vaccines. Next, we show that 90% of respondents in a nationally representative sample (n = 2,101) underestimate doctors' trust; the most common belief is that only 50% of doctors trust the vaccines. Finally, we integrate randomized provision of information about the true views held by doctors into a longitudinal data collection that regularly monitors vaccination status over 9 months. The treatment recalibrates beliefs and leads to a persistent increase in vaccine uptake. The approach demonstrated in this paper shows how the engagement of professional medical associations, with their unparalleled capacity to elicit individual views of doctors on a large scale, can help to create a cheap, scalable intervention that has lasting positive impacts on health behaviour.


Conflict of interest statement

The authors declare no competing interests.

Figures

Fig. 1
Fig. 1. The views of doctors on COVID-19 vaccines.
Supplementary study among the members of the CMC (n = 9,650). a, Distribution of responses to the question “Will you personally be interested in getting vaccinated, voluntarily and free of charge, with an approved vaccine against COVID-19?”. Among participants who answered yes, the dark blue refers to those who reported already being vaccinated, whereas the light blue refers to those who plan to get vaccinated. b, Responses to the question “Do you trust COVID-19 vaccines that have been approved by the European Medicines Agency (EMA) approval process?”. c, Responses to the question “Will you recommend COVID-19 vaccination to your healthy patients to whom you would recommend other commonly used vaccines?” Among participants who answered yes, the dark blue refers to those who would recommend the vaccines even without being asked, whereas the light blue refers to those who would recommend only when asked. In Supplementary Table 2, we show that the distribution of views is similar across various demographic groups and level of seniority.
Fig. 2
Fig. 2. Perceptions of doctors’ views on COVID-19 vaccines.
A sample of the adult Czech population (n = 2,101). a, Distribution of the prior beliefs of respondents about what percentage of doctors would like to get vaccinated. b, Distribution of the beliefs of respondents about what percentage of doctors trust approved COVID-19 vaccines. The dashed line shows the true value, based on the responses of doctors in the Supplementary study. The red and blue colours show the percentage of those who underestimate and overestimate, respectively, doctors’ own vaccination intentions (a) and trust in the COVID-19 vaccines (b).
Fig. 3
Fig. 3. Effects of the Consensus condition on posterior beliefs about doctors’ views and vaccination intentions.
A sample of the adult Czech population. a, Estimated effects of the Consensus condition on beliefs about the percentage of medical doctors who plan to get vaccinated (left panel) and on beliefs about the percentage of doctors who trust approved COVID-19 vaccines (right panel), measured in wave 1 (29 March; Consensus condition n = 970; Control n = 970). b, The dependent variable is an indicator for an intention to be vaccinated with a vaccine against COVID-19, measured in wave 0 (15 March; Consensus condition n = 1,050; Control n = 1,051) and wave 1 (29 March; Consensus condition n = 970; Control n = 970). We report the results of two specifications: (1) a linear probability regression controlling for pre-registered covariates: gender, age category (6 categories), household size, number of children, region (14 regions), town size (7 categories), education (4 categories), economic status (7 categories), household income (11 categories) and baseline vaccination intentions, and (2) a double-selection LASSO linear regression selecting from a wider set of controls in Extended Data Table 1, including prior vaccine uptake and beliefs about the views of doctors. Markers show the estimated effects and the whiskers denote the 95% confidence interval based on Huber–White robust standard errors. The estimated effects and Student's t-test (two-sided) P values are reported in the figure. No adjustments were made for multiple comparisons. We report estimates for (1) all observations, full sample (diamond and square), and (2) for a sub-sample of participants who took part in all 12 waves (Consensus condition n = 614; Control n = 598), fixed sample (triangle and circle). In the lower part of the figure, we report the timing, the total number of observations and the Control mean for each wave. See Supplementary Section 3.5 for further specification details. Supplementary Tables 5 and 6 show the regression results for a and b in detail, respectively.
Fig. 4
Fig. 4. Effects of the Consensus condition on vaccination uptake.
A sample of the adult Czech population. Estimated effects of the Consensus condition by survey wave on getting at least one dose of a vaccine against COVID-19. We report the same four specifications as in Fig. 3 (linear probability model with pre-registered controls using full (diamond) and fixed (triangle) samples, and double-selection LASSO linear regression selecting from controls in Extended Data Table 1 using full (square) and fixed (circle) samples). Markers show the estimated effects and the whiskers denote the 95% confidence interval based on Huber–White robust standard errors. The estimated effects and Student's t-test (two-sided) P values are reported in the figure. No adjustments were made for multiple comparisons. We report estimates for (1) all observations, full sample (diamond and square), and (2) for a sub-sample of participants who took part in all 12 waves, fixed sample (triangle and circle). In the lower part of the figure, we report the timing, the total number of observations and the Control mean for each wave. Full sample: Consensus condition n = 807–970, Control n = 800–973; see Extended Data Table 2 for exact n per wave. Fixed sample: Consensus condition n = 614; Control n = 598. Extended Data Table 3 shows the regression results in detail.
Fig. 5
Fig. 5. Effects of the Consensus condition on vaccine uptake: robustness.
A sample of the adult Czech population. This specification chart plots the estimated effects of Consensus on the likelihood of vaccine uptake for a pooled sample across waves 6–11 (when the vaccine was available for all adults). All specifications include wave fixed effects. Markers show the estimated effects, the darker or lighter whiskers denote the 90% or 95% confidence interval, respectively, based on standard errors clustered at the respondent level. No adjustments were made for multiple comparisons. We report a range of linear probability model specifications by sequentially adding sets of control variables in Extended Data Table 1. The main specifications are marked by blue diamonds. We report all specifications for both the full sample (left-hand side) and the fixed sample (right-hand side). Full sample: Consensus condition n = 5,145 (981 clusters = respondents); Control n = 5,137 (983 clusters = respondents). Fixed sample: Consensus n = 3,684 (614 clusters = respondents); Control n = 3,588 (598 clusters = respondents). Extended Data Table 4 shows the regression results in detail.
Extended Data Fig. 1
Extended Data Fig. 1. Comparison of development of vaccination rate in the Control group (Sample of adult Czech population) and the Czech adult population.
The horizontal axis represents a timeline. Population data means are for a Tuesday following the start of the data collection (Mondays) at a respective wave denoted by diamonds. The weighted Control group means are denoted by triangles. Control condition n = 800–1,051, depending on survey wave. Source of population data: Opendatalab, a website set up by the Faculty of Information Technologies at the Czech Technical University in Prague using open data from the Czech Ministry of Health (https://ockovani.opendatalab.cz/statistiky), ISSN 2787-9925 - http://aleph.techlib.cz/F/?func=direct&doc_number=000017426&local_base=STK02 (accessed on January 12, 2022).
Extended Data Fig. 2
Extended Data Fig. 2. Effects of the Consensus condition on the second dose uptake and on intentions to uptake a third (booster) dose (Main Experiment, Sample of adult Czech population).
This figure plots estimated treatment effects on 1) the second dose uptake (two doses were designed as a complete vaccination cycle for the most commonly used vaccines), and on 2) intentions to uptake a third (booster) dose. Markers show the estimated effects, the whiskers denote the 95%-confidence interval based on standard errors clustered at the individual level. Estimated effects and t-test (two-sided) p-values are reported in the Figure. No adjustments for multiple comparisons. Diamonds and triangles report estimates from a linear probability regression that controls for the pre-registered set of control variables. Squares and circles report estimates from a double-selection LASSO linear regression (dsregress command in Stata 17) selecting from a set of covariates in Extended Data Table 1. All regressions include wave fixed effects. In the upper part of the Figure we report the timing and control mean. We report estimates for the full sample (diamonds and squares) and for a restricted sample of respondents participating in all 11 waves (triangles and circles). Full sample: Consensus condition n = 807–904, Control condition n = 800–897, depending on survey wave. Fixed sample: Consensus condition n = 614; Control condition n = 598.
Extended Data Fig. 3
Extended Data Fig. 3. Weekly average of newly confirmed Covid-19 cases per 100,000 population.
Case data source: The Czech Ministry of Health (https://onemocneni-aktualne.mzcr.cz/api/v2/covid-19/osoby.csv, Accessed on January 12, 2022). Population data source: The Czech Statistical Office (https://www.czso.cz/csu/czso/obyvatelstvo-podle-petiletych-vekovych-skupin-a-pohlavi-v-krajich-a-okresech, Accessed on January 12, 2022) and ref. .

Comment in

References

    1. Greenwood, B. The contribution of vaccination to global health: past, present and future. Phil. Trans. R. Soc. B369, 20130433 (2014). 10.1098/rstb.2013.0433 - DOI - PMC - PubMed
    1. Banerjee, A. et al. Selecting the Most Effective Nudge: Evidence from a Large-Scale Experiment on Immunization. Working Paper 28726 (NBER, 2021).
    1. Jarrett, C. et al. Strategies for addressing vaccine hesitancy—a systematic review. Vaccine33, 4180–4190 (2015). 10.1016/j.vaccine.2015.04.040 - DOI - PubMed
    1. Milkman, K. L. et al. A megastudy of text-based nudges encouraging patients to get vaccinated at an upcoming doctor’s appointment. Proc. Natl Acad. Sci. USA118, 10–12 (2021). 10.1073/pnas.2101165118 - DOI - PMC - PubMed
    1. Dai, H. et al. Behavioral nudges increase COVID-19 vaccinations. Nature597, 404–409 (2021). 10.1038/s41586-021-03843-2 - DOI - PMC - PubMed

Substances