. 2022 Jun;606(7913):406-413.
doi: 10.1038/s41586-022-04779-x. Epub 2022 Jun 1.

Differential cofactor dependencies define distinct types of human enhancers

Affiliations

Differential cofactor dependencies define distinct types of human enhancers

Christoph Neumayr et al. Nature. 2022 Jun.

Abstract

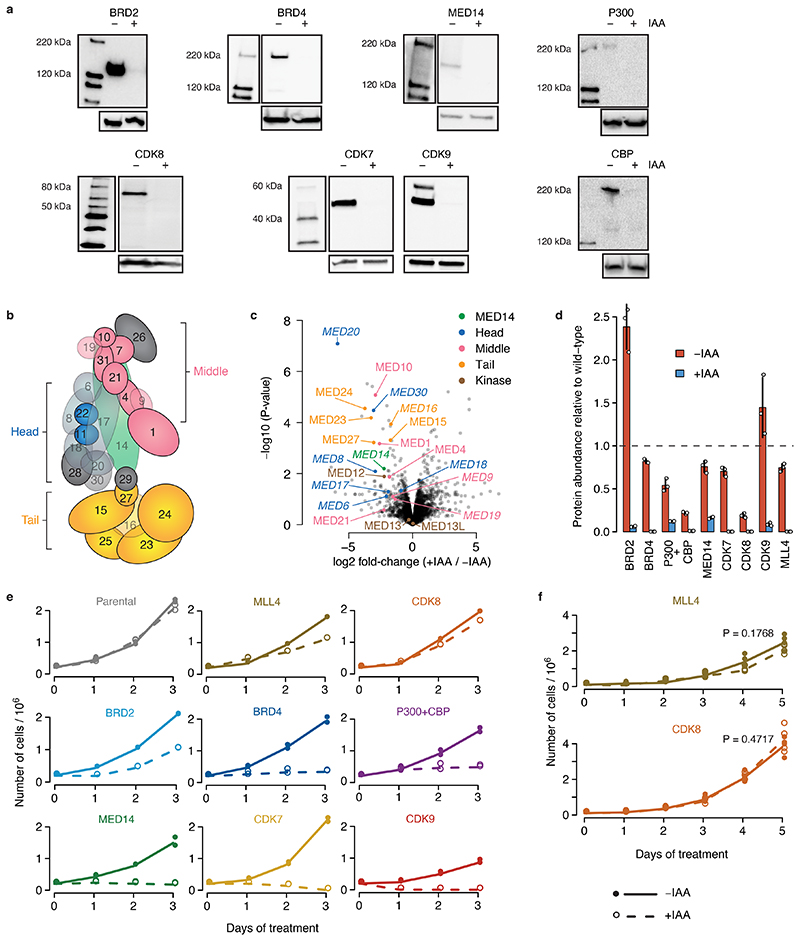
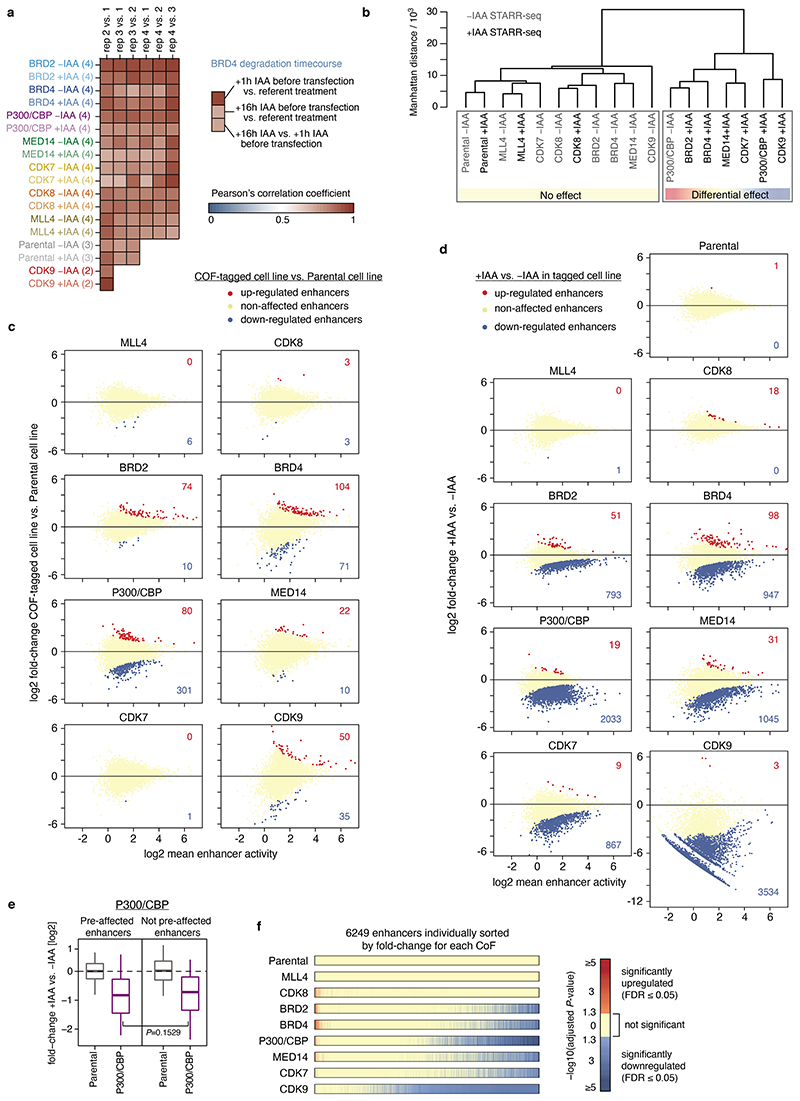
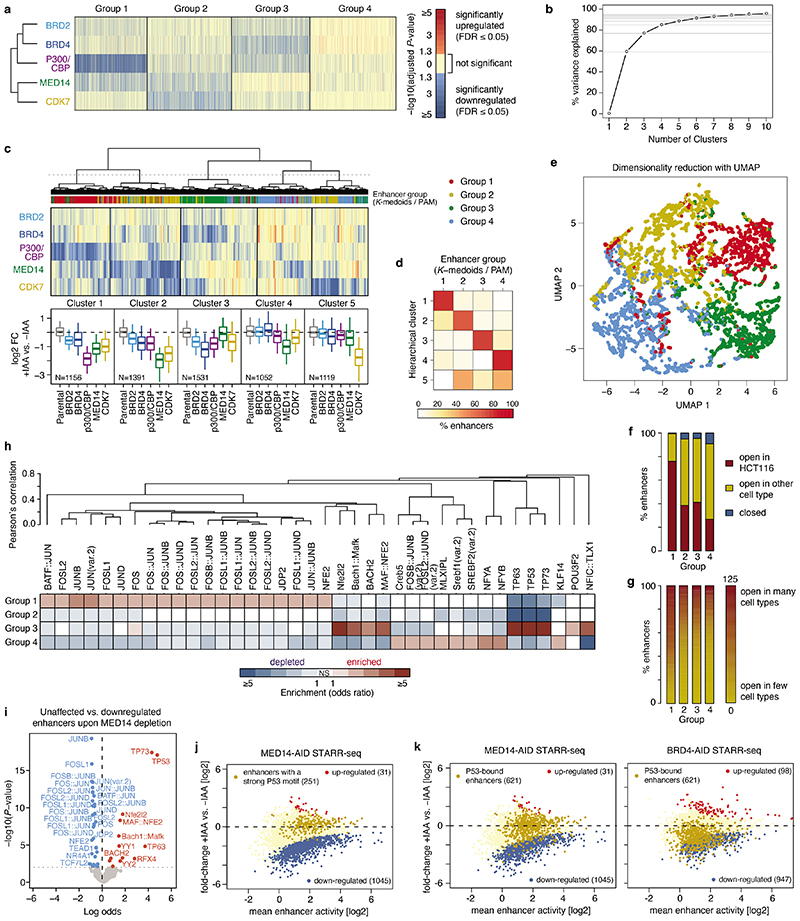
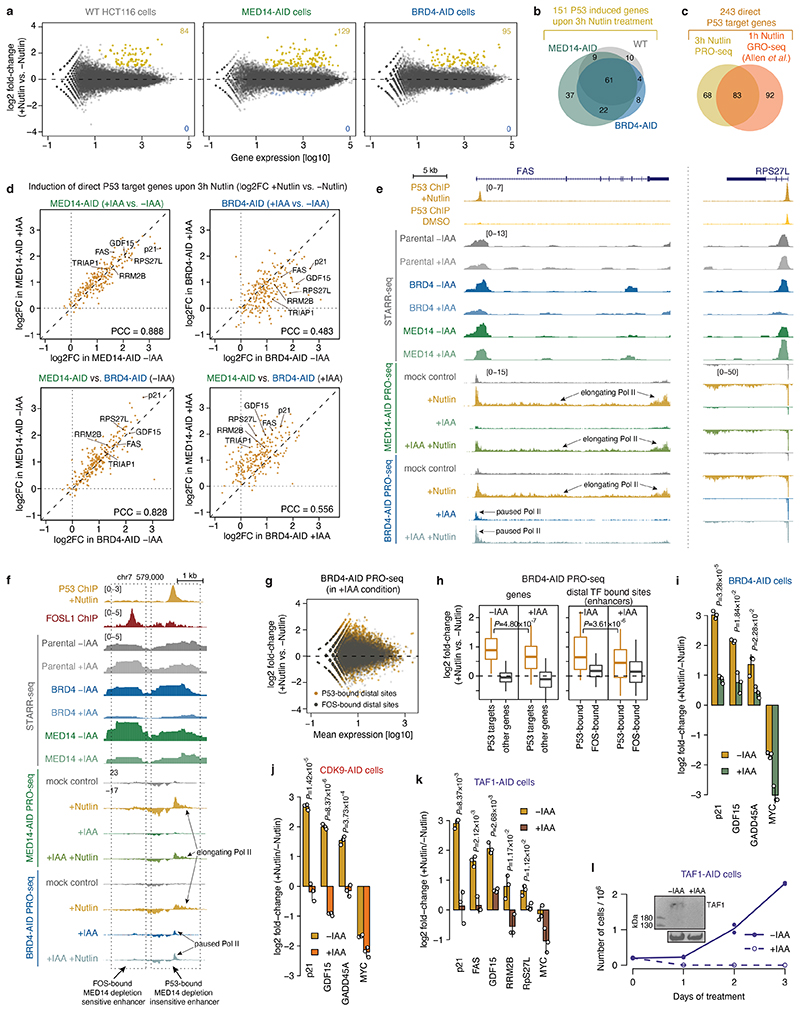
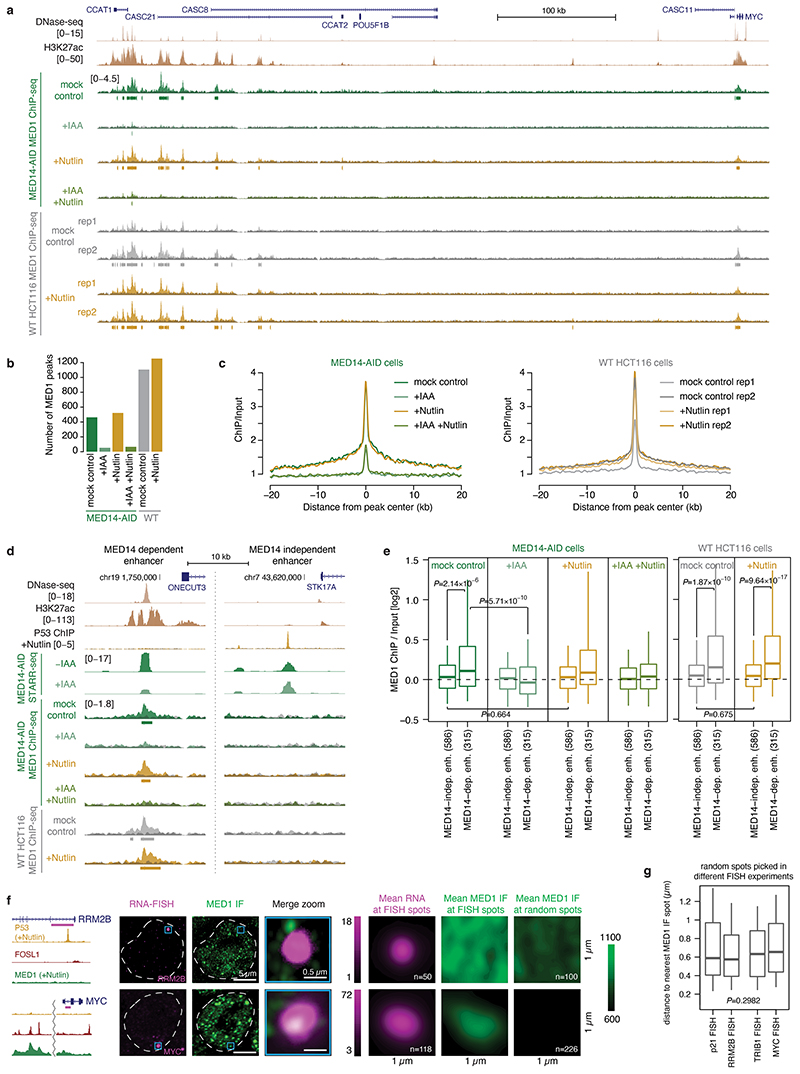
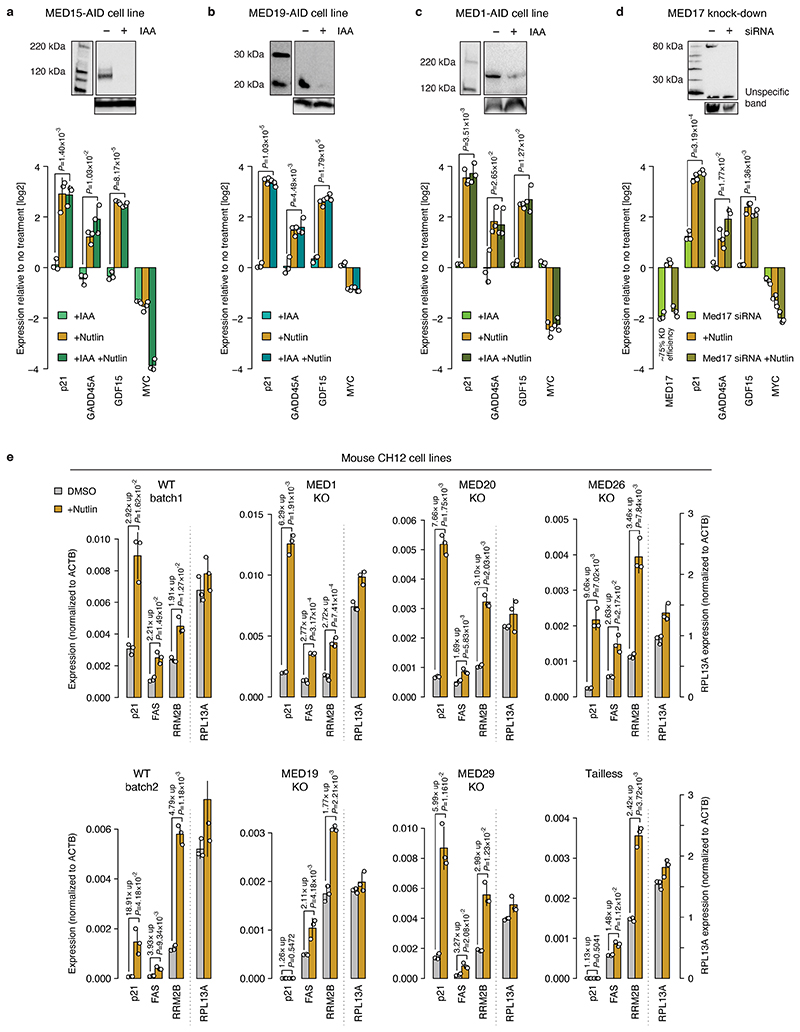
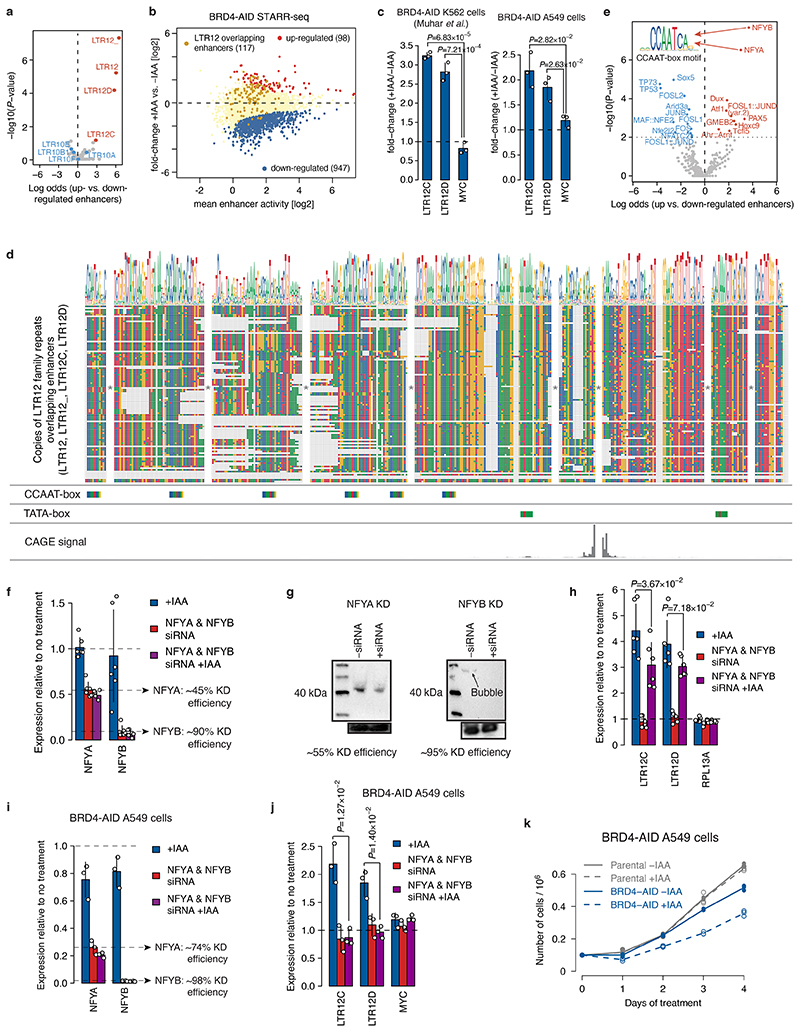
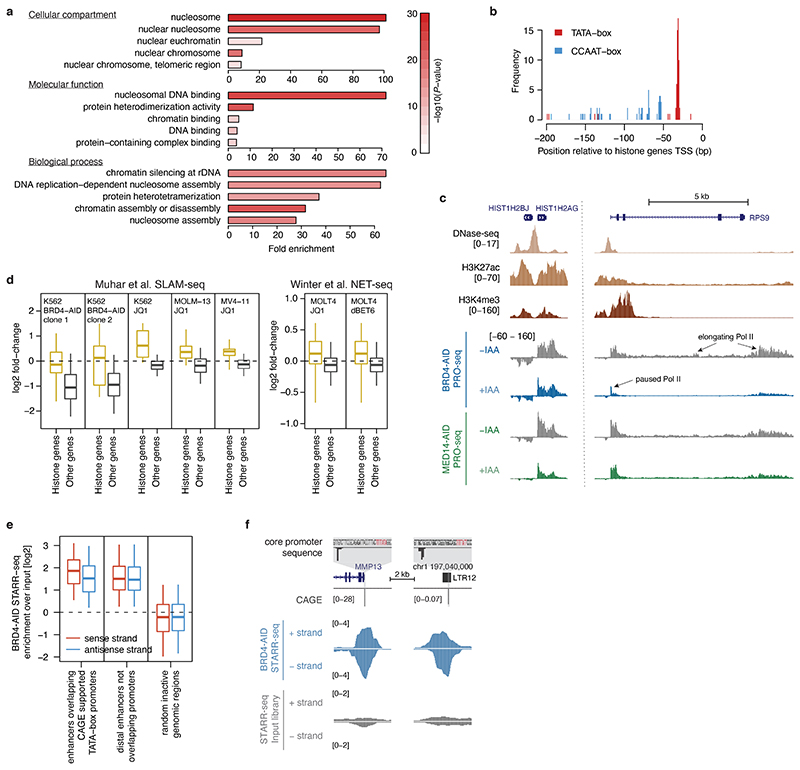
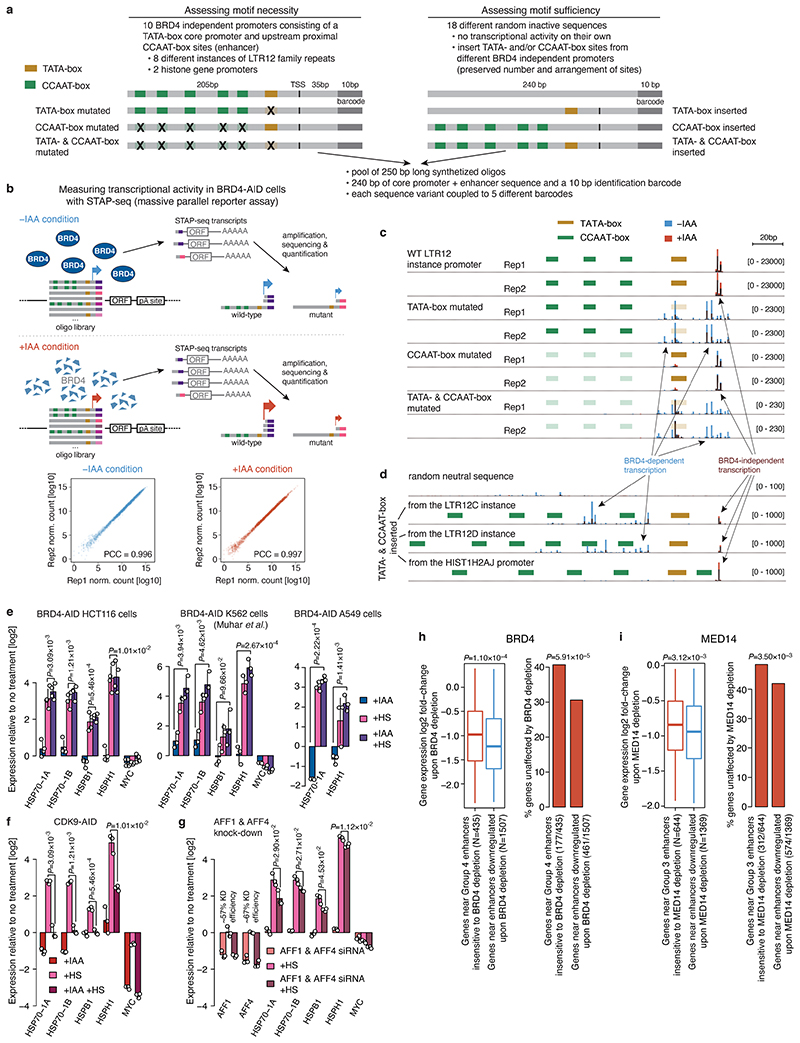
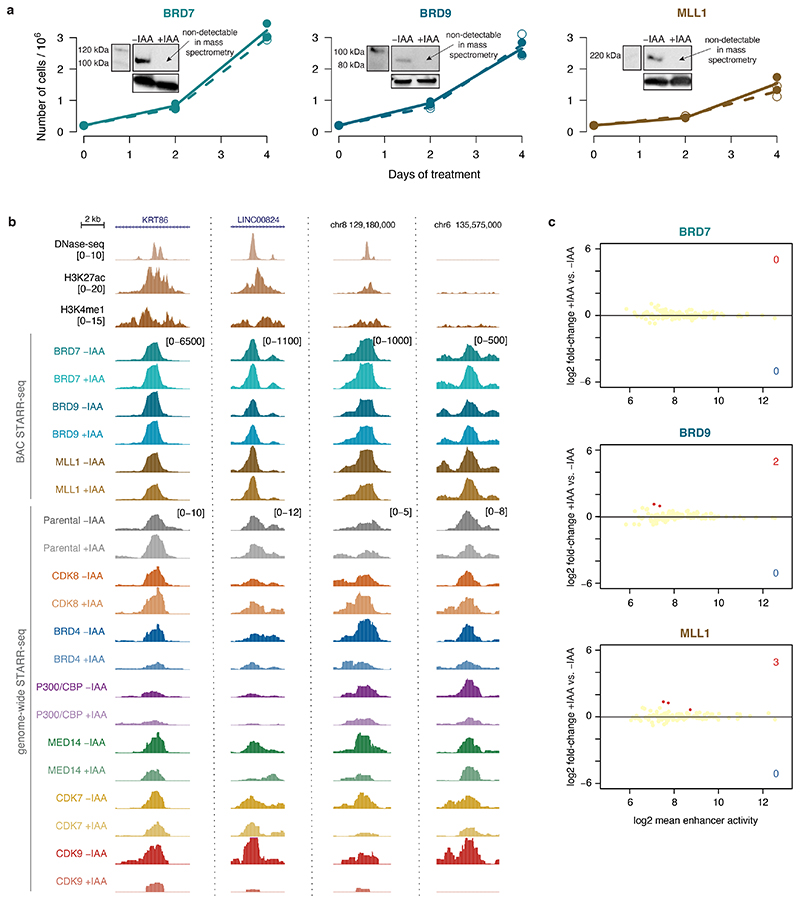
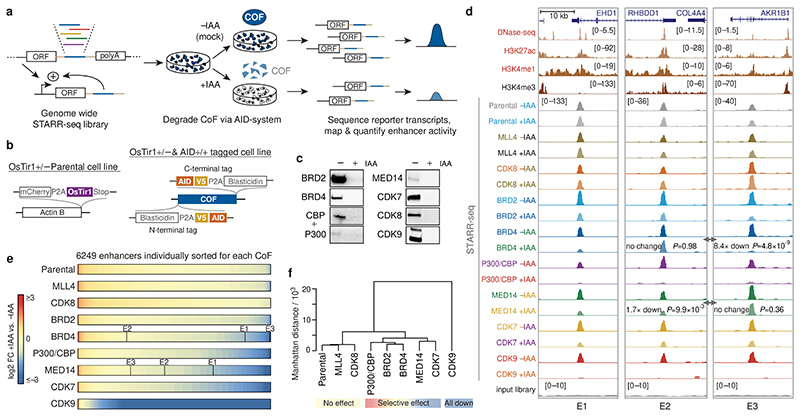
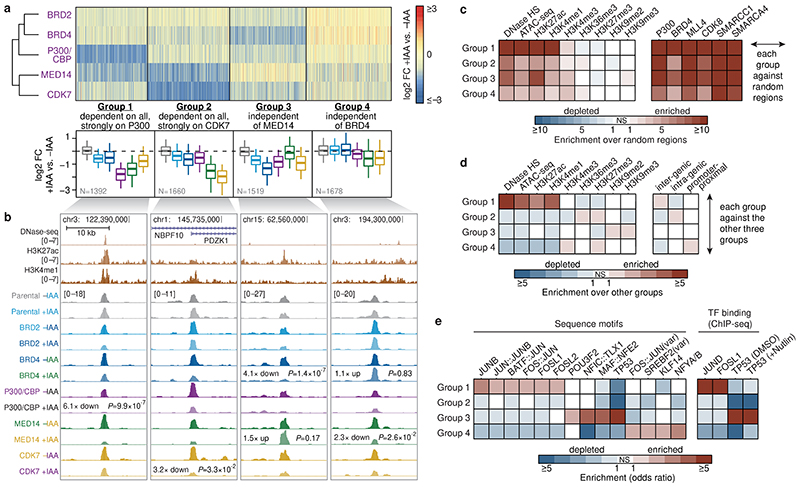
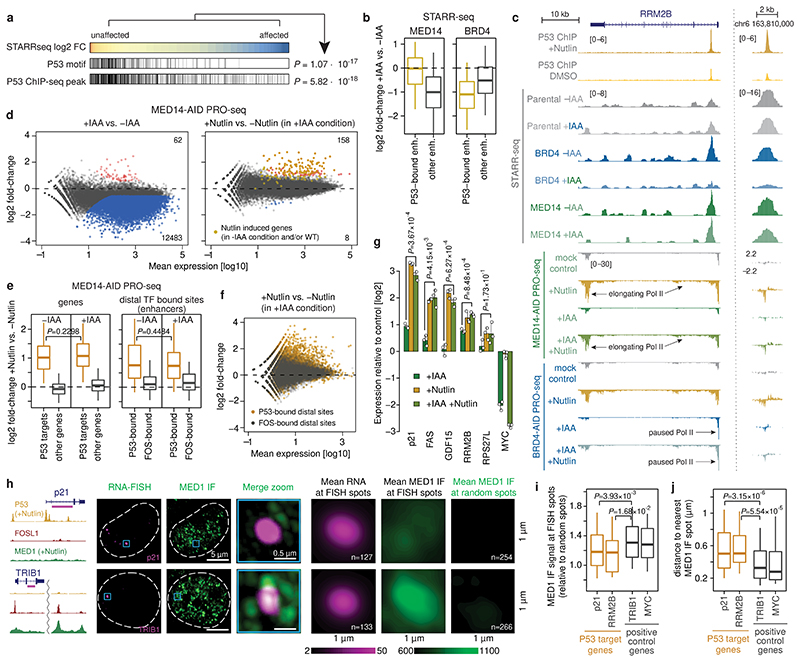
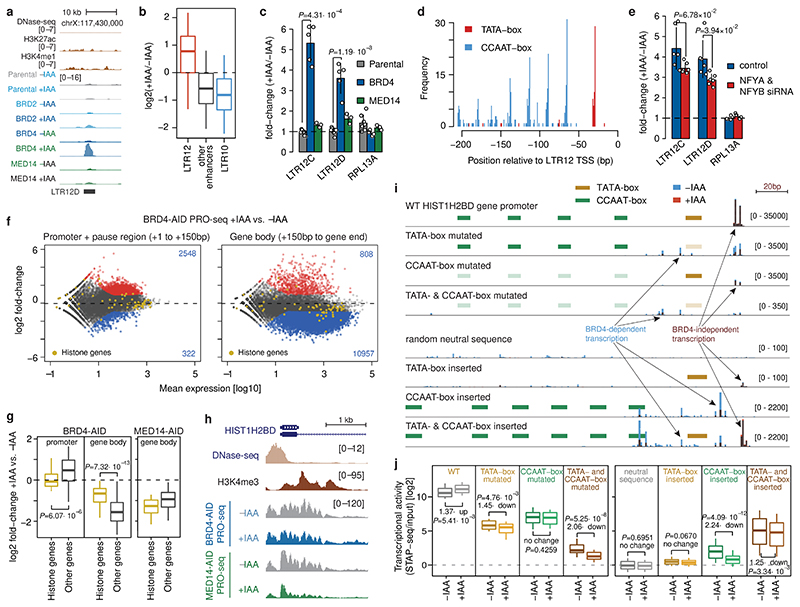
All multicellular organisms rely on differential gene transcription regulated by genomic enhancers, which function through cofactors that are recruited by transcription factors1,2. Emerging evidence suggests that not all cofactors are required at all enhancers3-5, yet whether these observations reflect more general principles or distinct types of enhancers remained unknown. Here we categorized human enhancers by their cofactor dependencies and show that these categories provide a framework to understand the sequence and chromatin diversity of enhancers and their roles in different gene-regulatory programmes. We quantified enhancer activities along the entire human genome using STARR-seq6 in HCT116 cells, following the rapid degradation of eight cofactors. This analysis identified different types of enhancers with distinct cofactor requirements, sequences and chromatin properties. Some enhancers were insensitive to the depletion of the core Mediator subunit MED14 or the bromodomain protein BRD4 and regulated distinct transcriptional programmes. In particular, canonical Mediator7 seemed dispensable for P53-responsive enhancers, and MED14-depleted cells induced endogenous P53 target genes. Similarly, BRD4 was not required for the transcription of genes that bear CCAAT boxes and a TATA box (including histone genes and LTR12 retrotransposons) or for the induction of heat-shock genes. This categorization of enhancers through cofactor dependencies reveals distinct enhancer types that can bypass broadly utilized cofactors, which illustrates how alternative ways to activate transcription separate gene expression programmes and provide a conceptual framework to understand enhancer function and regulatory specificity.


Conflict of interest statement

Competing interests

The authors declare no competing interests.

Figures

Extended Data Fig. 1
Extended Data Fig. 1. Validation of cofactor degradation and effect on cell growth
a, Western blots of denoted cofactors (COF) in the cell line where the respective COF is tagged by AID, without and with auxin (IAA) treatment for 1h. done once; validated by mass spectrometry; gel source data: Supplementary Figure 1. b, Schematic of the Mediator complex structure with head, middle and tail domains shown in different colors. Core structural subunit MED14 targeted in this study is shown in green. Subunits that cannot be detected anymore in mass-spectrometry upon MED14 depletion are semi-transparent. c, Protein abundance change as measured by shot-gun mass-spectrometry upon MED14 depletion by auxin treatment. All detected Mediator subunits are marked and colored according to different Mediator modules/domains shown in b. Subunits marked in italic were not detected anymore (i.e. were below detection limit) in all replicates of auxin treatment. N=3 independent replicates. d, Protein abundance of denoted COFs as measured by targeted mass-spectrometry approach in the cell line where the respective COF is tagged by AID, without and with auxin treatment for 3h. N=3 independent replicates; mean +/- SD shown. e, Growth curves over a course of 3 days comparing untreated (solid line) and auxin treated (dashed line) cells, for each COF-AID cell line. N=2 independent replicates. f, Growth curves over a course of 5 days comparing untreated (solid line) and auxin treated (dashed line) cells for MLL4- and CDK8-AID cell line. N=3 independent replicates. P-value of two-sided Student’s t-test at final day 5 timepoint is shown.
Extended Data Fig. 2
Extended Data Fig. 2. Effect of cofactor tagging and targeted cofactor degradation on enhancer activity
a, Pearson’s correlations for pair-wise comparisons of replicates for each cofactor (COF) with and without auxin (IAA) treatment calculated across a reference set of 6249 enhancers. For majority of COFs there are 4 independent replicates in each condition, except for our positive and negative controls, CDK9 and the Parental cell line, that have 2 and 3 replicates per condition, respectively. Inset on the right shows correlations between BRD4 samples pre-treated with auxin before STARR-seq library transfection, i.e. with an extended period of protein degradation. b, Hierarchical clustering of untreated and auxin treated Parental and different COF-AID cell lines based on enhancer activity for a reference set of 6249 enhancers. All untreated cell lines (except p300/CBP which shows high level of COF pre-degradation in absence of auxin) cluster together with the Parental cell line, as well as auxin treated MLL4- and CDK8-AID cell lines. c, Differential analysis of STARR-seq enhancer activity between each individual COF-AID cell line and Parental cell line without any treatment to assess the effect of COF-tagging on enhancer activity. Number of significantly up- or down-regulated enhancers is denoted (FDR≤0.05). d, Differential analysis of STARR-seq enhancer activity for each COF-AID cell line with and without auxin treatment to assess the effect of COF degradation on enhancer activity. Number of significantly up- or down-regulated enhancers is denoted (FDR≤0.05). e, Log2 fold-change in enhancer activity for enhancers pre-affected by P300 and CBP tagging (left; N=301) and the rest of non-affected enhancers (right; N=5948) in Parental and P300/CBP-AID cells upon auxin treatment. Boxes: median and interquartile range; whiskers: 5th and 95th percentiles. P-values: two-sided Wilcoxon rank-sum test. f, Significance of change in enhancer activity (P-values from differential analysis corrected for multiple testing/FDR) for a reference set of 6249 enhancers sorted individually by fold-change in each COF-AID cell line, from unaffected (or upregulated) enhancers on the left to most downregulated enhancers on the right.
Extended Data Fig. 3
Extended Data Fig. 3. Features of the four different groups of enhancers
a, Significance of change in enhancer activity (P-values from differential analysis corrected for multiple testing/FDR) upon individual cofactor degradation for four groups of enhancers defined by PAM (partitioning-around-medoids) clustering. Significant P-values (FDR≤0.05) for down- and up-regulated enhancers are shown in shades of blue and red, respectively. Non-significant P-values are shown in yellow. N = 1392, 1660, 1519, 1678 for Groups 1-4, respectively. b, Percent of variance explained by clustering of 6249 enhancers with partitioning around medoids (PAM) algorithm into different number of clusters. Four clusters explain ~85% of the variance. c, Hierarchical clustering of enhancers based on change in enhancer activity upon individual cofactor degradation. Boxplots summarize the log2 fold-change values per COF for each of the 5 clusters defined by cutting the dendrogram as denoted with a dashed line. Enhancer group assignment (from PAM clustering shown in Fig. 2a) is denoted by the coloured stripe below the dendrogram. N = 1156, 1391, 1531, 1052, 1119 for Groups 1-5, respectively. Boxes: median and interquartile range; whiskers: 5th and 95th percentiles. d, Agreement between clusters defined by hierarchical clustering and enhancer groups defined by PAM. For each hierarchical cluster (row) percent of enhancers falling into each PAM enhancer group is shown. e, Two-dimensional visualization of the data after dimensionality reduction with UMAP algorithm. Points represent individual enhancers coloured by their group membership (from PAM clustering). f, Percent of enhancers accessible/open according to DNase-seq in HCT116 cells or in other cell types in the four groups of enhancers defined in Fig. 2a. g, Percent of enhancers accessible/open according to DNase-seq in different number of cell lines ranging from enhancers closed in all cell lines (0 - yellow) to enhancers open in many/all (125 - red) cell lines assayed by DNase-seq in ENCODE. h, Mutual enrichment of transcription factor motifs for the four groups of enhancers. For each motif from the JASPAR vertebrate core collection of 579 non-redundant TF motifs (https://jaspar2020.genereg.net/download/data/2020/CORE/JASPAR2020_CORE_non-redundant_pfms_jaspar.zip) the enrichment/depletion in each group is assessed against the remaining three groups using two-sided Fisher’s exact test and only motifs with P-value≤0.001 and odds-ratio≥2 are shown. The motifs are hierarchically clustered based on pair-wise Pearson’s correlation between motif position-weight matrices (PWMs) to group together similar motifs. A selection of representative motifs from these groups of similar motifs is shown in Fig. 2e. i, Enrichment analysis of 579 non-redundant TF motifs from the JASPAR vertebrate core collection (https://jaspar2020.genereg.net/download/data/2020/CORE/JASPAR2020_CORE_non-redundant_pfms_jaspar.zip) between unaffected and down-regulated enhancers upon MED14 depletion. Significantly enriched and depleted motifs (two-sided Fisher’s exact test; P-value ≤0.01) are shown in red and blue, respectively. j, Differential analysis of enhancer activity upon MED14 depletion with enhancers containing a P53 motif marked in yellow. k, Differential analysis of enhancer activity upon MED14 (left) or BRD4 (right) depletion with enhancers overlapping a P53 ChIP-seq peak marked in yellow.
Extended Data Fig. 4
Extended Data Fig. 4. Induction of P53 target genes and enhancers is insensitive to MED14 depletion, but sensitive to BRD4 depletion
a, Differential analysis of PRO-seq signal at genes between Nutlin-3a treated and untreated WT HCT116 (left), MED14- (middle) or BRD4-AID (right) cells. Number of significantly upregulated genes in each cell line is denoted in yellow (FDR≤0.05 and fold-change≥2). N=2 independent replicates for each condition. b, Venn diagram showing overlap of significantly upregulated genes in the 3 cell lines shown in panel a, defining in total 151 P53 target genes induced after 3h of Nutlin-3a treatment. c, Venn diagram showing overlap of 151 P53 target genes induced after 3h of Nutlin-3a (this study) and 175 P53 target genes defined previously after 1h of Nutlin-3a treatment, defining a set of 243 direct P53 target genes used in panels d and h, and in Fig. 3e. d, Comparison of induction of direct P53 target genes (defined in panel c) in different cell lines and conditions. Top row compares induction in MED14- (left) or BRD4-AID (right) cells when the respective factor is present (-IAA) or depleted (+IAA). P53 targets are induced to the same extent upon MED14 depletion, but their induction is impeded upon BRD4 depletion. Bottom row compares induction between the two cell lines in the condition without auxin (left) or with auxin (right). Without auxin both MED14- and BRD4-AID cells induce P53 target genes to the same extent, however with auxin the induction in the BRD4-AID cells is impeded compared to the MED14-AID cells. e, Loci of the P53 target genes FAS (left) and RPS27L (right) with intronic P53-bound enhancers. Enhancer activity in different COF-AID cell lines with and without auxin (IAA) treatment is shown (normalized STARR-seq signal for merged replicates), together with nascent transcription (normalized PRO-seq signal for merged replicates) upon induction of P53 signalling with Nutlin-3a in MED14- and BRD4-AID cells with and without auxin treatment. Transcription of both genes is induced upon Nutlin treatment in both conditions with MED14 present (-IAA) or degraded (+IAA), but is strongly reduced with BRD4 degraded due to a pause-release defect that persists upon Nutlin treatment. Activity of their associated P53-bound enhancers is unchanged upon MED14 depletion but is abolished upon BRD4 depletion. f, Locus with a FOS-bound MED14-depletion sensitive (left) and a P53-bound MED14-depletion insensitive (right) enhancer. Activity in different COF-AID cell lines with and without auxin (IAA) treatment is shown (normalized STARR-seq signal for merged replicates), together with nascent transcription (normalized PRO-seq signal for merged replicates) upon induction of P53 signalling with Nutlin-3a in MED14- and BRD4-AID cells with and without auxin treatment. Activity of the FOS-bound enhancer is strongly reduced by both MED14 and BRD4 depletion, whereas the activity of the P53-bound enhancer is unchanged upon MED14 depletion but is abolished upon BRD4 depletion. Endogenous bidirectional transcription of the P53-bound enhancer is induced upon Nutlin treatment in both conditions with MED14 present (-IAA) or degraded (+IAA), but is reduced with BRD4 degraded due to a pause-release defect that persists upon Nutlin treatment. g, Differential analysis of PRO-seq signal at distal P53 or FOS bound sites (enhancers) upon Nutlin-3a treatment in auxin treated BRD4-AID cell line. h, Log2 fold-change of PRO-seq signal for direct P53 target genes (left; genes defined in panel c) and distal P53 bound sites around direct P53 target genes (enhancers; right) in BRD4-AID cell line upon Nutlin-3a induction in background with BRD4 present (-IAA) or depleted (+IAA). N = 151, 20964, 244, 359 for P53 targets, other genes, P53- and FOS-bound enhancers, respectively. Boxes: median and interquartile range; whiskers: 5th and 95th percentiles; P-values: two-sided Wilcoxon rank-sum test. i-k, Endogenous induction of known P53 target genes with Nutlin-3a as measured by qPCR in BRD4- (i), CDK9- (j) or TAF1-AID (k) cells without or with auxin treatment, i.e. with the respective factor present or degraded. N=3 independent replicates; fold-change for each replicate calculated independently by dividing the treatment value with the corresponding control value; mean +/- SD shown; P-values: two-sided Student’s t-test. l, Growth curves over a course of 3 days comparing untreated (solid line) and auxin treated (dashed line) TAF1-AID cells. N=2 independent replicates. Inset shows Western blot for TAF1 in cells without and with auxin (IAA) treatment for 1h. gel source data: Supplementary Figure 1.
Extended Data Fig. 5
Extended Data Fig. 5. P53 target genes and enhancers are not bound by MED1
a, Locus of the MYC gene with an upstream cluster of endogenously active MED1-bound enhancers. ChIP-seq signal and called MED1 peaks in MED14-AID cells treated with auxin or/and Nutlin-3a and in WT HCT116 cells treated with Nutlin-3a are shown. b, Number of MED1 peaks called in each condition in MED14-AID and WT cells (MACS2, FDR≤0.05). c, Average plot of MED1 ChIP-seq enrichment over input for a common set of MED1 peaks called in MED14-AID (638 peaks; left) and in WT HCT116 cells (1545 peaks; right). d, Example of an endogenously active MED14-dependent enhancer bound by MED1 (left) and a P53-bound MED14-independent enhancer not bound by MED1 (right). MED14-dependent enhancer is bound by MED1 in both WT and MED14-AID cells and this binding is abolished upon auxin treatment, i.e. upon MED14 depletion. P53-bound enhancer shows no MED1 binding in any condition, not even upon P53 induction with Nutlin-3a in either WT or MED14-AID cells. e, MED1 ChIP-seq enrichment over input for 2 groups of STARR-seq enhancers: 1) MED14-independent, P53-bound enhancers (N=586) and 2) endogenously open and H3K27ac-marked MED14-dependent enhancers (N=315), upon Nutlin-3a treatment in control and MED14-depleted MED14-AID cells (left) or in WT cells (right). While MED14-dependent enhancers show some MED1 binding in both WT and MED14-AID cells, which is abolished upon MED14 depletion (i.e. auxin treatment), P53-bound enhancers show no binding in any condition, including after Nutlin-3a treatment when these enhancers are activated. Boxes: median and interquartile range; whiskers: 5th and 95th percentiles. P-values: two-sided Wilcoxon rank-sum test. f, MED1 IF with concurrent RNA FISH against P53 target gene RRM2B (top row) and Mediator-regulated positive control gene MYC (bottom row) in Nutlin-3a treated WT HCT116 cells. Examples of individual cells with merged view of the FISH and MED1 IF signal at the FISH spot are shown on the left. Hoechst staining was used to determine the nuclear periphery, highlighted with a dashed white line. Mean RNA FISH and mean MED1 IF signal in 1x1μm window centred at FISH spots, or at random spots is shown on the right. Number of spots analysed is indicated in the lower right corner (n). g, Distribution of distance between each random spot and the nearest MED1 IF spot for random spots picked in different FISH experiments. Boxes: median and interquartile range; whiskers: 5th and 95th percentiles. P-value: Kruskal-Wallis rank sum test.
Extended Data Fig. 6
Extended Data Fig. 6. P53 target gene induction is independent of multiple Mediator subunits in human and mouse cells
a-c, Endogenous expression of known P53 target genes as measured by qPCR in auxin or/and Nutlin-3a treated MED15- (a, tail module), MED19- (b, middle module) or MED1-AID (c, middle module) cells. Western blot of the denoted Mediator subunit in the respective COF-AID cell line, without and with auxin (IAA) treatment for 3h is shown on top. gel source data: Supplementary Figure 1. d, Endogenous expression of known P53 target genes as measured by qPCR upon Nutlin-3a treatment before and after MED17 (head module) knock-down via RNAi in WT HCT116 cells. e, Endogenous expression of P53 target genes as measured by qPCR in DMSO or Nutlin treated mouse CH12 cells, either wild-type (WT) or knock-out (KO) cell lines for different Mediator subunits (cell lines from ref. ). Experiment was performed in two batches (shown in two rows), each time using a re-thawed WT cell line as a control. Tailless = quintuple knock-out for MED15, MED16, MED23, MED24 and MED25 subunits. In all panels, N=3 independent replicates; fold-change for each replicate calculated independently by dividing the treatment value with the corresponding control value; mean +/- SD shown; P-values: two-sided Student’s t-test.
Extended Data Fig. 7
Extended Data Fig. 7. LTR12 family repeats act as BRD4 independent enhancers/promoters that contain a combination of TATA-box and multiple CCAAT-box motifs
a, Enrichment of retrotransposons in enhancers up- vs. down-regulated upon BRD4 depletion. b, Differential analysis of enhancer activity upon BRD4 depletion with LTR12 family repeat-overlapping enhancers marked in yellow. c, Fold-change of endogenous LTR12 expression as measured by qPCR in auxin treated vs. untreated BRD4-AID K562 (left) and A549 (right) cells. In both cell lines BRD4 depletion leads to upregulation of LTR12C and D. d, Multiple alignment of LTR12 family repeats with detected enhancer activity in STARR-seq. Occurrences of CCAAT-box and TATA-box motifs, and the endogenous transcription initiation previously mapped by CAGE are marked below the alignment. e, Enrichment analysis of 579 non-redundant TF motifs from the JASPAR vertebrate core collection (https://jaspar2020.genereg.net/download/data/2020/CORE/JASPAR2020_CORE_non-redundant_pfms_jaspar.zip) between upregulated and down-regulated enhancers upon BRD4 depletion in HCT116 cells. Significantly enriched and depleted motifs (two-sided Fisher’s exact test; P-value ≤0.05) are shown in red and blue, respectively. Logo of the most highly enriched CCAAT-box motif bound by NFYA/B is shown. f, Endogenous expression of NFYA and NFYB as measured by qPCR without or with NFYA & NFYB siRNA treatment in BRD4-AID HCT116 cells. g, Western blots of NFYA (left) and NFYB (right) with and without treatment with the respective siRNA. gel source data: Supplementary Figure 1. h, Endogenous expression of LTR12C and D as measured by qPCR in auxin or/and NFYA & NFYB siRNA treated BRD4-AID HCT116 cells. i, Endogenous expression of NFYA and NFYB as measured by qPCR without or with NFYA & NFYB siRNA treatment in BRD4-AID A549 cells. j, Endogenous expression of LTR12C and D as measured by qPCR in auxin or/and NFYA & NFYB siRNA treated BRD4-AID A549 cells. k, Growth curves over a course of 4 days comparing untreated (solid line) and auxin treated (dashed line) BRD4-AID and Parental A549 cells. N=3 independent replicates. In c, f, h, i and j, mean +/- SD shown; P-values: two-sided Student’s t-test. N=3 (c, i and j) or N=6 (f and h) independent replicates; fold-change for each replicate calculated independently by dividing the treatment value with the corresponding control value.
Extended Data Fig. 8
Extended Data Fig. 8. Histone genes have a promoter with TATA-box and CCAAT-box motifs and do not require BRD4 for productive transcription
a, Gene ontology term enrichment for genes with promoters containing both TATA-box and CCAAT-box motifs. Top 5 terms for cellular compartment (top), molecular function (middle) and biological process (bottom) categories are shown. Bars show fold-enrichment and are colored according to the P-value of the one-sided hypergeometric test. b, Occurrence of TATA- and CCAAT-boxes in histone genes promoters relative to TSSs. c, Loci of the histone genes HIST1H2BJ and HIST1H2AG (left) and ribosomal protein gene RPS9 (right) with nascent transcription (normalized PRO-seq signal for merged replicates) in BRD4- and MED14-AID cells with and without auxin treatment. While RPS9 shows typical pause release defect with loss of RNA polymerase II signal throughout the gene body and increase at the promoter, the two histone genes do not lose signal in the gene body and still have high levels of actively elongating RNA polymerase II. d, Log2 fold-change of endogenous nascent transcription for histone genes from previously published datasets. Left: SLAM-seq in different cell lines upon rapid BRD4 degradation via AID system or BRD4 inhibition by JQ1 (from ref. ); Right: NET-seq in MOLT4 cell line upon BRD4 inhibition by JQ1 or dBET6 (from ref. ). e, STARR-seq signal enrichment over input in BRD4-AID cell line separated by strand for enhancers overlapping TATA-box promoters (N=190), distal enhancers not overlapping promoters (N=4917) and random inactive regions (negative control; N=5151). Sense strand corresponds to orientation of the gene for enhancers overlapping promoters and is randomly assigned for distal enhancers and random regions. In d and e, boxes: median and interquartile range; whiskers: 5th and 95th percentiles. f, Examples of STARR-seq enhancers overlapping TATA-box promoters with evidence of endogenous initiation (CAGE): promoter of the MMP13 gene (left) and an instance of LTR12 repeat element (right). STARR-seq signal in BRD4-AID cell line and input library coverage is shown for + and − strands separately. Fragments from both strands are enriched over input, i.e. these promoter-overlapping fragments work as enhancers in both orientations.
Extended Data Fig. 9
Extended Data Fig. 9. Combination of a TATA-box core promoter and CCAAT-box-containing proximal enhancer is required and sufficient to drive high levels of BRD4 independent transcription
a, Design of a sequence library to assess the requirement and sufficiency of the TATA-box and CCAAT-box motifs in the core and proximal promoter region, respectively, for the BRD4-independent transcriptional activity with massive parallel reporter assay. For the loss of function approach (left) 10 different BRD4-independent promoters (from LTR12 repeats and histone genes) were selected and variants with either TATA- and/or CCAAT-box motifs mutated were designed. For the gain of function approach (right) the TATA- and/or CCAAT-box motifs from the 10 selected promoters were inserted into 18 randomly picked neutral sequences. Each sequence variant is present in the library 5 times, coupled to a different 10bp long barcode at the 3’ end. b, Schematic of the massive parallel reporter assay (STAP-seq) to measure transcriptional activity at a single base-pair resolution in BRD4-AID cells without or with auxin (IAA) treatment. 5’ ends of transcripts arising from each sequence present in the library are captured, amplified and sequenced, and the sequenced tags are uniquely mapped to the sequence variant of origin via the 10bp identification barcode. Correlation between transcriptional activity across all sequences in the library measured in two independent replicates for auxin treated (right) and untreated (left) cells is shown at the bottom. c, Transcriptional activity at single base-pair resolution measured by STAP-seq for wild-type (WT) and different mutant versions of the LTR12 promoter instance. Transcription from each sequence variant was assessed 5 times in the library (coupled to 5 different barcodes) and the mean normalized STAP-seq signal across different barcodes is shown for the 2 independent replicates. STAP-seq signal in auxin treated (red) vs. untreated (blue) BRD4-AID cells is shown as semi-transparent overlay. d, Transcriptional activity at single base-pair resolution measured by STAP-seq for a random neutral sequence upon insertion of TATA- and CCAAT-box motifs from an LTR12C, an LTR12D instance or from the HIST1H2AJ promoter. e-f, Endogenous expression of known heat-shock responsive genes as measured by qPCR in auxin or/and heat-shock treated BRD4-AID HCT116 (left), K549 (middle) and A549 (right) cells (e), and CDK9-AID HCT116 cells (f). In all three BRD4-AID cell lines heat-shock genes are equally strongly induced with BRD4 present or depleted but fail to get induced with CDK9 depleted. g, Endogenous expression of AFF1, AFF4 and known heat-shock responsive genes as measured by qPCR without or with AFF1 & AFF4 siRNA treatment in HCT116 cells. The induction of heat-shock genes is decreased after AFF1 & AFF4 knock-down. In e-g, N=3 independent replicates; fold-change for each replicate calculated independently by dividing the treatment value with the corresponding control value; mean +/- SD shown; P-values: two-sided Student’s t-test. h, i, Changes in gene expression (log2 fold-change in PRO-seq signal) upon BRD4 (h) or MED14 (i) depletion for two groups of genes: (1) genes that have an enhancer insensitive to respective COF depletion (Group 4 enhancer for BRD4 or Group 3 enhancer for MED14) and (2) genes that have an enhancer downregulated upon respective COF depletion within 50 kb of their TSS. Number of genes in each group (N) is denoted in parentheses. Boxes: median and interquartile range; whiskers: 5th and 95th percentiles; P-values: one-sided Wilcoxon rank-sum test. Barplots show percentage of genes in each group that are unaffected (not significantly downregulated) by COF depletion in PRO-seq. P-values: one-sided Fisher’s exact test.
Extended Data Fig. 10
Extended Data Fig. 10. STARR-seq for additional AID-tagged cofactors shows no effect on enhancer activity
a, Growth curves over a course of four days comparing untreated (solid line) and auxin treated (dashed line) cells, for BRD7- (left), BRD9- (middle) and MLL1-AID (right) cell line. N=2 independent replicates. Insets show Western blot for the respective cofactor in cells without and with auxin (IAA) treatment for 3h. Upon auxin treatment none of the cofactors were detectable either in Western blot or in mass spectrometry. b, Examples of four enhancers detected by STARR-seq in the BAC library. For each enhancer the activity in BRD7-, BRD9- and MLL1-AID cell lines in the BAC-STARR-seq screen with and without IAA treatment is shown (normalized STARR-seq signal for merged replicates), alongside with endogenous chromatin accessibility and histone modifications in wild-type HCT116 cells. For comparison, enhancer activity in different COF-AID cell lines from the genome-wide STARR-seq screen is shown. None of the enhancers are affected by the loss of neither BRD7, BRD9 nor MLL1, while they are sensitive to depletion of other COFs (e.g. BRD4, MED14 or CDK9). c, Differential analysis of STARR-seq enhancer activity for 114 enhancers detected in the BAC library in each COF-AID cell line with and without auxin treatment to assess the effect of COF degradation on enhancer activity. Number of significantly up- or down-regulated enhancers is denoted (FDR≤0.05). Depletion of none of the three COFs has an effect on enhancer activity, suggesting that they are not required for enhancer activity in the unperturbed HCT116 cells.
Figure 1
Figure 1. Rapid cofactor degradation coupled to STARR-seq reveals cofactor-specific effects on enhancer activity
a, HCT116 cells with a cofactor (COF) of interest tagged by an auxin inducible degron (AID) are transfected with a genome-wide STARR-seq library and treated with either auxin (IAA) to degrade the COF or with a mock control. Enhancer activity across the entire human genome is quantified in the two conditions by sequencing and mapping reporter transcripts. b, COF tagging strategy. Parental HCT116 cell line carries heterozygous insertion of OsTir1 ligase downstream of Actin B gene (left). AID-tagged cell line was created for each COF by homozygous insertion of a cassette containing an AID to either N- or C-terminus of the respective COF gene in the Parental cell line (right). c, Western blots of denoted COFs in the cell line where the respective COF is tagged by AID, without and with IAA treatment for 1h. done once, validated by mass spectrometry; gel source data: Extended Data Fig. 1a and Supplementary Figure 1. d, Activity of three enhancers (E1-E3) measured by STARR-seq in different COF-AID cells with and without IAA treatment (normalized STARR-seq signal for merged replicates; adjusted P-values of the edgeR negative binomial model). Endogenous chromatin accessibility and histone modifications in wild-type HCT116 cells are shown on top. e, Log2 fold-change for a reference set of 6249 enhancers is shown, sorted individually for each COF-AID cell line from the least affected (or most upregulated) enhancers on the left to the most downregulated enhancers on the right. Three enhancers shown in d are marked for BRD4 and MED14 cell lines. f, Hierarchical clustering of Parental and COF-AID cell lines based on log2 fold-change of enhancer activity in IAA treated vs. untreated cells shown in e.
Figure 2
Figure 2. Differential cofactor requirements define distinct enhancer types with distinguishing sequence and chromatin features
a, Log2 fold-change of enhancer activity upon individual cofactor degradation for four groups of enhancers defined by partitioning-around-medoids clustering. Boxplots summarize the values per COF for each group. N = 1392, 1660, 1519, 1678 for Groups 1 to 4, respectively. Boxes: median and interquartile range; whiskers: 5th and 95th percentiles. b, Examples of enhancers from each of the four groups showing activity in different COF-AID cell lines with and without auxin (IAA) treatment (normalized STARR-seq signal for merged replicates; adjusted P-values of the edgeR negative binomial model). c, Enrichment of chromatin accessibility and histone modification ChIP-seq peaks (left) and various cofactor ChIP-seq peaks (right) from HCT116 cells for the four groups of enhancers against random control regions. d, e, Mutual enrichment of chromatin accessibility and histone modification ChIP-seq peaks (d, left), genomic localization (d, right), transcription factor (TF) motifs (e, left) and TF ChIP-seq peaks (e, right) for the four groups of enhancers. The enrichment for each group is calculated against the remaining three groups. Statistically significant (twosided Fisher’s exact test; P-value ≤0.05) enrichments and depletions are colored in shades of red and blue, respectively. Non-significant (NS) fields are shown in white.
Figure 3
Figure 3. P53-bound enhancers and target genes are insensitive to MED14 depletion
a, P53 motifs and ChIP-seq peaks in STARR-seq enhancers sorted from least to most affected upon MED14 depletion. P-values: one-sided Fisher’s exact test (top against bottom 20%). b, Activity change for P53-bound (N=621) vs. other (N=5628) enhancers in MED14- (left) and BRD4-AID (right) cells. c, Enhancer activity (merged normalized STARR-seq replicates) and nascent transcription (merged normalized PRO-seq replicates) in RRM2B locus upon P53 induction with Nutlin-3a in MED14- and BRD4-AID cells with and without auxin (IAA). d, Differential gene PRO-seq in MED14-AID cells (left: +/- auxin; right: auxin+Nutlin-3a vs. auxin-only; FDR≤0.05; fold-change≥2; N=2 independent replicates; yellow: 151 Nutlin-3a-induced genes [Extended Data Fig. 4b]). PRO-seq fold-change for P53 targets (left; N=243 [Extended Data Fig. 4c]) and distal P53-bound sites around targets (right) in MED14-AID cells upon Nutlin-3a with (+IAA) or without auxin (-IAA). N = 243, 20964, 233, 346 for P53 targets, other genes, P53- and FOS-bound enhancers, respectively. f, Differential PRO-seq analysis for distal P53- or FOS-bound enhancers upon Nutlin-3a in auxin-treated MED14-AID cells. g, Expression (qPCR) of P53 targets in auxin- or/and Nutlin-3a-treated MED14-AID cells. N=3 independent replicates; mean +/- SD; P-values: two-sided Student’s t-test. h, MED1 IF with concurrent RNA-FISH against P53 target p21 (top) and control TRIB1 gene (bottom) in Nutlin-3a-treated HCT116 cells. Left: gene loci with P53, FOSL1 and MED1 ChIP-seq signal and intronic FISH target sequence (magenta). Dashed line: nuclear periphery. Right: mean RNA-FISH and MED1-IF signals centred on FISH spots, or random spots (n=number of spots). i, MED1 IF signal at FISH spots, normalized to mean MED1 IF signal at random regions. j, Distance between FISH spot and nearest MED1 IF spot. In i and j, N = 127, 50, 133, 118 FISH spots for p21, RRM2B, TRIB1 and MYC, respectively. In b, e, i and j, boxes: median and interquartile range; whiskers: 5th and 95th percentiles; P-values: two-sided Wilcoxon rank-sum test.
Figure 4
Figure 4. Combination of TATA- and CCAAT-boxes renders transcription of LTR12 retrotransposons and histone genes independent of BRD4
a, LTR12D element with increased enhancer activity upon BRD4 degradation. b, Enhancer-activity change upon BRD4 depletion for LTR12- (N=117), LTR10-overlapping (N=198) and all other (N=5935) enhancers. c, Change in endogenous LTR12 expression (qPCR) upon auxin treatment of BRD4- or MED14-AID cells. N = 7, 5, 3 independent replicates for Parental, BRD4- and MED14-AID cells, respectively. d, Occurrence of TATA- and CCAAT-boxes in LTR12 repeats with STARR-seq activity, relative to their endogenous TSSs. e, Change in endogenous LTR12 expression (qPCR) upon BRD4 depletion before and after NFYA & NFYB knock-down. N=6 independent replicates. f, Differential analysis (+/-auxin) of PRO-seq in promoter+pause region (left) and gene body (right) for BRD4-AID cells (FDR≤0.05; fold-change≥2; yellow: histone genes; N=2 independent replicates). g, Change of PRO-seq signal in promoter+pause region and gene body in BRD4-AID cells (left) and gene body in MED14-AID cells (right) for histone genes (N=50) vs. all other expressed genes (N=11869). h, PRO-seq signal at HIST1H2BD in BRD4- and MED14-AID cells +/-auxin (normalized signal for merged replicates). i, Transcription (base-pair resolution; Extended Data Fig. 9b) from WT and mutant HIST1H2BD promoters (top) and from neutral sequences with inserted LTR12-derived TATA- and/or CCAAT-boxes (bottom). Mean normalized STAP-seq signal across barcodes and replicates (N=2 independent replicates, 5 barcodes per sequence) in +auxin (red) vs. -auxin (blue) BRD4-AID cells is overlaid. j, STAP-seq signal for WT and mutated versions of histone and LTR12 promoters (left; N=50), and for random neutral sequences with inserted TATA- and/or CCAAT-boxes (right; N = 90, 120, 900 for WT, single insertions and double insertions, respectively). In b, g, j, boxes: median and interquartile range; whiskers: 5th and 95th percentiles; P-values: two-sided Wilcoxon rank-sum test. In c, e, mean +/- SD; P-values: two-sided Student’s t-test.

Comment in

References

    1. Reiter F, Wienerroither S, Stark A. Combinatorial function of transcription factors and cofactors. Current Opinion in Genetics & Development. 2017;43:73–81. - PubMed
    1. Nakagawa T, Yoneda M, Higashi M, Ohkuma Y, Ito T. Enhancer function regulated by combinations of transcription factors and cofactors. Genes Cells. 2018;23:808–821. - PubMed
    1. Rathert P, et al. Transcriptional plasticity promotes primary and acquired resistance to BET inhibition. Nature. 2015;525:543–547. - PMC - PubMed
    1. Jaeger MG, et al. Selective Mediator dependence of cell-type-specifying transcription. Nat Genet. 2020;52:719–727. - PMC - PubMed
    1. Chipumuro E, et al. CDK7 Inhibition Suppresses Super-Enhancer-Linked Oncogenic Transcription in MYCN-Driven Cancer. Cell. 2014;159:1126–1139. - PMC - PubMed

MeSH terms